Velocity vs Acceleration 2: A Comprehensive Guide for Physics Students

velocity vs acceleration 2

Summary Velocity and acceleration are two fundamental concepts in physics that describe the motion of objects. This comprehensive guide delves into the technical details, formulas, examples, and real-world applications of velocity and acceleration, providing a valuable resource for physics students. Velocity: Definitions, Units, and Measurement Definition Velocity is the rate of change of an object’s … Read more

Negative Constant Velocity Graph: What, How, Examples

cvcxvxv 294x300 1

The article discusses a negative constant velocity graph with solved problems and examples.

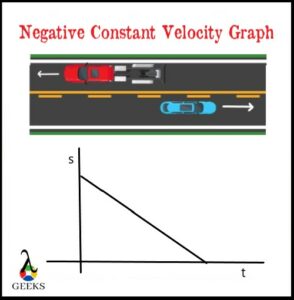
The motion is depicted when we plot its displacement or position-time graph. For an object moving opposite to another, when we plot a graph by taking a displacement or position on a y-axis and a time taken on the x-axis, it displays the negative constant velocity of an object moving in opposite. 

The constant negative velocity is due to an object’s displacement or position decreasing with time. The position is the exact location of an object in a given time, whereas the displacement is the position different from one time to another.

The negative constant velocity graph reveals how an object moves in the opposite or reverse direction when no external force acts. Therefore, the graph’s slope seems to be a straight line beginning at the maximum displacement and minimum time values. It ended at a minimum displacement and maximum time values. Hence, the slope also supports us calculate the value of an object’s negative velocity.

Read more about What is Constant Negative Velocity.

What is Negative Constant Velocity Graph
Negative Constant Velocity Graph

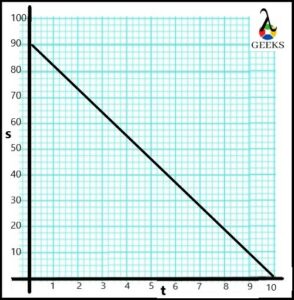
Suppose the car moves on the opposite road to other vehicles. From the displacement-time graph, calculate the negative constant velocity. 

Displacement Time Graph

Given:

From graph,

s1 = 80m

s2 = 0m

t1 = 0sec

t2 = 10 sec

To Find

v =? 

Formula

v= s2-s1/t2-t1 = Δs/Δt

Solution

The value of the negative constant velocity of moving car is calculated as, 

v = s2-s1/t2-t1

Substituting all values,

v= 0 -80/10-0

v = -8

The car moves with a negative constant velocity of -8m/s.

Read more about Constant Positive Velocity.

What is Negative Constant Velocity Graph?

The negative constant velocity graph signifies an object moving in a negative direction.

When an object moves negative or opposite, its displacement time graph displays a slightly cross and steeper straight line slope indicates the ‘negative constant velocity’. The more stepper the graph’s slope is, the faster an object moves in a negative direction with negative constant velocity. 

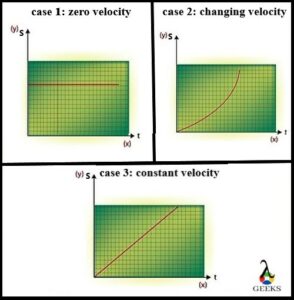
If an object rest, then the displacement – time graph illustrated the zero motion as a horizontal straight line slope. If an object acceleratesthe displacement – time graph illustrates the changing motion as a curved slope.The constant velocity conceived when zero acceleration on an object is due to no external forces being exerted, represented by displacement –time graph as straight-line slope.

Since the velocity is measured as relative motion between two objects, the constant velocity is termed ‘negative’ when two objects move opposite each other. 

The perfect example of constant negative velocity is the two escalators moving in the opposite direction. i.e., one is going up, and the other is down. For the escalator going up, the people standing on the escalator going down seem to go down with constant negative velocity as its displacement decreases. Similarly, the escalator going down and the people standing on the escalator going up seem to be going with a constant negative velocity.

Negative Constant Velocity Example
(credit: shutterstock)

Suppose a person chooses to go down on the escalator going up; it moves with constant negative velocity with respect to the escalator going down. At the same time, the person moves with constant positive velocity with respect to the escalator going down.

Read more about Relative Motion.

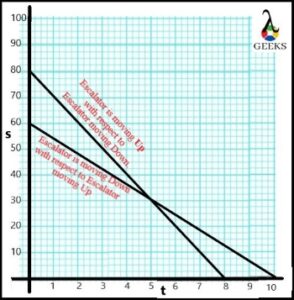
From the data, draw the displacement and time graph for both escalators going up and down with respect to each other. 

Escalator is moving Up with respect to Escalator moving Down.
Displacement 80 70 60 50 40 30 20 10 0
Time 0 1 2 3 4 5 6 7 8
  Escalator is moving Down with respect to Escalator moving Up
Displacement 60 55 48 42 35 30 25 20 11 7 0
Time 0 1 2 3 4 5 6 7 8 9 10
Negative Constant Velocity Graph

Calculate the negative constant velocity for both escalators is moving opposite to each other. Comment on the result. 

Given:

For escalator going Up

s1 = 80m

s2 = 0m

t1 = 0sec

t2 = 8sec

For escalator going Up

s1 = 60m

s2 = 0m

t1 = 0sec

t2 = 10sec

Solution:

The negative constant velocity of the escalator going up w.r.t. escalator going down is calculated as,

v= s2-s1/t2-t1

Substituting all values,

v = 0 -80/8-0

v = -10 ……………(1)

The negative constant velocity of the escalator going down w.r.t. escalator going up is calculated as,

v =s2-s1/t2-t1

Substituting all values,

v= 0 -60/10-0

v = -6……… (2)

From (1) and (2), we observe that the escalator going up w.r.t. the escalator going down is moving more rapidly with a negative constant velocity of 10m/s.

Therefore, the slope of the escalator going down w.r.t. escalator going up is more down than the escalator going up w.r.t. escalator going down. 

Suppose two trains are running opposite on different tracks. After running a certain distance, both trains stop at the station for some time and start running opposite each other. 

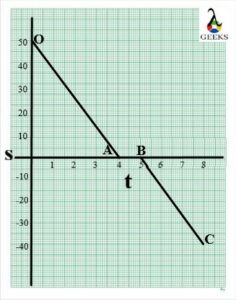
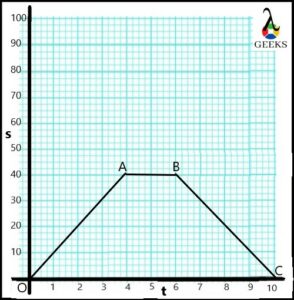
For data below, draw the negative constant velocity graph for train A running opposite to train A.

Displacement 50 35 25 15 0 0 -15 -25 -40
Time 0 1 2 3 4 5 6 7 8
Negative Constant Velocity Graph

Calculate the initial and final negative constant velocity value. 

Solution:

The section OA represents the train moving with negative constant velocity w.r.t. another train. 

The initial negative constant velocity of train A is calculated as,

v = s2-s1/t2-t1

Substituting all values,

v= 0 -50/4-0

v =-50/4

v = -12.5m/s 

The horizontal line in section AB shows that both trains stop for about a second. Hence, the value of the negative constant velocity of train A zero in section AB. 

The section BC represents the train again starting moving with negative constant velocity w.r.t. another train.

The final negative constant velocity of train A is calculated as,

v = s2-s1/t2-t1

Substituting all values,

v = -40/8-5

v= -40/3

v= -13.3m/s

Train A’s final negative constant velocity is greater than the initial negative constant velocity. 


Also Read:

Does Constant Acceleration Mean Constant Velocity: Detailed Facts

Constant velocity and constant acceleration are phrases that you could come upon. Does constant acceleration mean constant velocity? Let us have a look at this article to find out the answer.

When an object moves with a constant velocity, it means that the moving object has no acceleration. However, when an object moves with constant acceleration, its velocity changes by a constant amount throughout the same time interval.

Before delving into the answer, it is important to understand what you mean by constant velocity and constant acceleration. Let us have a look at it first.

Constant Velocity:

Velocity is the physical term that gives information about the rate of change of an object or body’s displacement. Thus, if an object changes its displacement from xi to xf over a time interval t, its velocity v may be calculated using the following formula:

gNf3oQ6yATGlMUBga7KDzY74vFdwMi1b3flYHh07Kqcq4t8wS7eTo62Kx3EcAEX2423F6pUHijUNwJ9lqT3HYnPfvPK145jEH75N5ARCAnZKaBOGPNZ5rvyG5zb jA1bhbqX3Cgd

Thus, when the distance traveled in one direction is the same during each time interval, then the velocity of an object or body is said to be constant.  

As a result, having a constant velocity does not imply that the object is stable. If a graph of displacement vs time is drawn, it will be parallel to the X axis, the time axis, i.e. a horizontal line as shown in the figure below.

5ELE81ZZdkRvQHWEf9F jOigRvXY qvClvLOFZge HStWXDnAuSV4ga WSgrHUz2VFsr8DPKe T5OBo8zq7hRViiKtoQVmB 6cBMfLtUlf2pgjzmGeeswMZrM fC2 C8yKX9KqNg

Constant Acceleration:

Acceleration is also the physical term that gives information about the rate of change of an object or body’s velocity. Thus, when a moving object is changing, its speed in one direction is the same during each time interval, then the acceleration of an object or body is said to be constant. Thus, if an object changes its velocity from vi to vf over a time interval t, its acceleration a may be calculated using the following formula:

As a result, same as the constant velocity, having a constant acceleration also does not imply that the object is stable. If a graph of velocity vs time is drawn, it will be parallel to the X axis, the time axis, i.e. a horizontal line as shown in the figure below.

does constant acceleration mean constant velocity

Learn more about the graph of constant velocity vs. time by reading this article.

Does constant acceleration mean constant velocity?

Constant acceleration and constant velocity are two physics expressions that have different meanings.

When anything has constant acceleration, it means that its velocity change is the same in each time interval. It means it is subjected to the same amount of force throughout the motion. As a result, constant acceleration does not imply constant velocity at all.

You might wonder what are the differences between constant velocity and constant acceleration? Let us look at the differences between constant velocity and constant acceleration.

Constant velocity vs Constant acceleration:

Motion with constant velocity and constant acceleration has totally different meanings. The followings are the differences between constant velocity and constant acceleration:

Suppose any object or body is traveling with constant velocity. It means that it continuously travels at the same speed and also in the same direction. If the velocity of an object or body is constant, then its velocity is not changing, and thus, it has no acceleration with time. Consider you are driving on the highway on one way where your speedometer indicates the same speed, then it is said that you are traveling with constant velocity.

Constant acceleration is quite different from constant velocity. Suppose any object or body is moving with constant acceleration. It means that the velocity of an object or body is changing, but the rate at which it is changing is always constant. The best example of constant acceleration is the acceleration due to gravity. 

Consider an object is falling from some height, which happened due to the earth’s gravitational force. If you are considering the earth’s gravitational force, then the gravitational acceleration due to earth has a constant value of 9.8 m/s2. The gravitational force on the moon is 1/6th of that of the earth. Thus, the gravitational acceleration of the moon is also 1/6th of that of the earth, so its value is 1.625 m/s2.

Frequently Asked Questions (FAQs)

Q: Does constant velocity mean no acceleration?

Ans: Acceleration is a physics term that describes the rate at which velocity changes.

When a moving item has constant velocity, it means that time is changing, but its velocity is not. As a result, according to the definition of acceleration, if the object’s velocity does not change, it does not have acceleration. As a result, we might conclude that constant velocity implies no acceleration.

Q: What is the cause of the object’s zero acceleration?

Ans: Zero acceleration term denotes that the velocity of an object or body remains constant across time.

When no net force is exerted on a moving object, the object will continue to move in the same direction and speed, or more accurately, velocity. As a result, given those circumstances, we can say that it has zero acceleration.

Problems of finding velocity and acceleration:

Problem 1: At time t = 25 seconds, a boat is moving at a velocity of 50 m/s, and at time t = 50 seconds, the same boat is moving at a velocity of 100 m/s. Find the constant acceleration by calculating the change in velocity and time.

Given:

Initial time ti = 25 s

Finale time tf = 50 s

At time t1 velocity of a boat vi = 50 m/s

At time t2 velocity of the same boat vf = 100 m/s

To find:

Change in velocity Δv = ?

Time interval Δt = ?

Acceleration a = ?

Solution:

Change in velocity:

Δv = vf – vi = (100 – 50) m/s = 50 m/s

Time interval:

Δt = tf – ti = (50 – 25) s = 25 s

Constant acceleration of the boat:

a = Δv/Δt =(50 m/s) / 25 s 

∴a = 2 m/s2

Thus, the constant acceleration of the boat is 2 m/s2.

Problem 2: Consider a car is moving in the east direction, and in each second, it travels the distance of 7 m. Find its velocity and acceleration.

Given:

Time interval Δt = 1 s

Change in displacement Δx = 7 m

To find:

Velocity v = ?

Acceleration a = ?

Solution:

Velocity of the car:

v = Δx / Δt

∴ v = 7 m / 1 s = 7 m/s

As each second car is traveling a distance of 7 m, we can say that its velocity is constant, and its value is 7 m/s.

Acceleration of the car:

As the car has constant velocity we can say that Δv = 0.

Thus, acceleration of the car a = 0 m/s2.

Also Read:

What Is Constant Negative Velocity: Why, How, When and Problem Examples

czvxcvx 294x300 1

The article discusses about what is constant negative velocity with some solved problem examples.

The constant negative velocity is defined by values of displacement. If it increases with time, an object drives straight with constant positive velocity. But if it decreases with time, an object drives in reverse or opposite direction with constant negative velocity.  

Since velocity is a vector quantity, it can be positive or negative depending on its direction, determined by its displacement. When no net force applies, an object moves with constant speed in the same direction, either straight or opposite. In the previous article, we have thoroughly discussed about constant positive velocity when an object moves in a straight direction

In the displacement time graph plot for the decreasing displacement per unit time for an object moving in the opposite direction, we obtain a straight line vertical slope. The slope starts from a higher displacement value and ends at a lower displacement value, symbolizing the constant negative velocity. 

What is Constant Negative Velocity
Constant Negative Velocity Slope
Constant Negative Velocity Slope in Displacement Time Graph

The graph also helps us to calculate the value of constant negative velocity from its slope. 

v = s2-s1/t2-t1

Read more about How to Calculate Speed from Force and Mass.

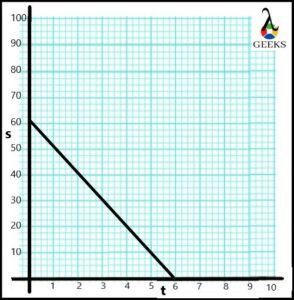
Calculate the constant negative velocity of the car from the below displacement vs. time graph. 

 Displacement Time Graph
Displacement Time Graph

Given:

From graph,

s1 = 60m

s2 = 0m

t1 = 0sec

t2 = 6sec

To Find:

v  =?

Formula:

v =s2-s1/t2-t1= Δs/Δt (s)

Solution:

The constant negative velocity of the car is calculated as,

v= s2-s1/t2-t1

Substituting all values,

v=0 -60/6-0

v = -10

The constant negative velocity of the car is -10m/s.

Read more about Horizontal Velocity.

How is Constant Velocity Negative?

The constant velocity is negative as an object’s displacement decreases with time.  

The constant velocity becomes negative when the object’s displacement decreases with time. It occurs because an object moves in the opposite direction after traveling a certain distance straight with constant positive velocity. 

Since there is no external force, an object cannot accelerate in any other direction, and it moves with a constant velocity. But since it is moving, its displacement varies with time. Hence, the constant velocity value is either positive or negative, depending upon the displacement is either increasing or decreasing. 

The displacement time graph illustrates both constant positive and constant negative velocity when an object moves forward and backward. 

Suppose a car moves forward on an inclined slope of a hill, and its motion is called constant positive energy. But if the driver cannot accelerate the car on an inclined plane, then the car starts moving backward, and its motion is termed as its constant negative velocity.

How is Constant Velocity Negative

Read more about How Does an Inclined Plane Make Work Easier.

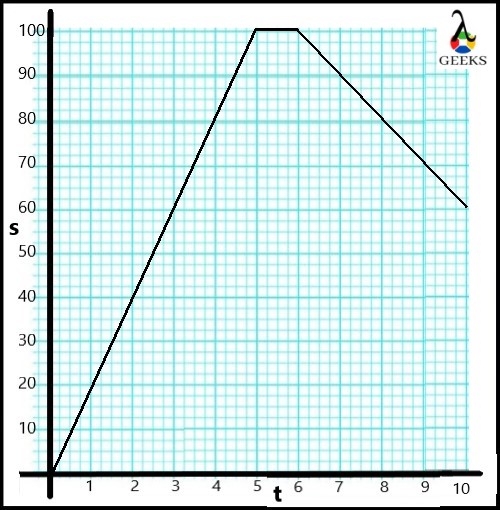
Draw a displacement time graph from the following data that includes displacement by the moving car on an inclined plane per unit time:

Displacement(meter) Time (secs)
0 0
20 1
40 2
60 3
80 4
100 5
100 6
90 7
80 8
70 9
60 10
Displacement Time Graph

Also, calculate the constant positive velocity and constant negative velocity of the car.

Given:

For constant positive velocity-

s2: 80m

s1: 0s

t2: 4m

t1: 0s

For constant negative velocity:

s2: 60m

s1: 90m

t2: 10s

t1: 7s

Formula:

v= s2-s1/t2-t1

Solution:

The constant positive velocity of car is calculated as,

v= s2-s1/t2-t1

v = 80-0/4-0

v = 80/4

v = 20m/s

The car moves on an inclined plane with a constant positive velocity of 20m/s.

The constant negative velocity of car is calculated as,

v = s2-s1/t2-t1

v =90-60/10-7

v =30/3

v = 10m/s

The car moves on an inclined plane with a constant negative velocity of 10m/s.

Read more about Velocity on an Inclined Plane.

When is Constant Velocity Negative?

The constant velocity negative is when an object moves in the opposite direction. 

The positive and negative signs of velocity reveal the direction of an object’s motion. So whenever an object moves in the opposite direction, it drives with constant negative velocity. But this negative direction is defined by the coordinate system to specify the position. 

An object’s final displacement may be either zero, positive or negative, larger, smaller, or the same as initial displacement. Hence, its constant velocity also is zero, positive or negative, when no force is applied.

The displacement time graph shows different shapes of slopes for different values of negative velocities. That means the slope appears more down for the high value of constant negative velocity than the low value of negative velocity, which demonstrates which object is moving faster than the other.

Usually, we estimate the velocity as positive. In contrast, we do not express the velocity in a negative value. Hence, the constant negative velocity is expressed as the relative motion between two objects. One object’s forward direction is the opposite to the others when both move oppositely. The relative motion between two oppositely moving objects is specified by its coordinate system (x,y,z,t).

Suppose two athletes, A and B, run opposite each other with constant velocity. For athlete A, athlete B is running with constant negative velocity. Hence we say athlete B is running with a constant negative velocity with respect to athlete A. Whereas, for athlete B, athlete A is running with a constant negative velocity. So we can say it is a constant negative velocity of athlete A with respect to athlete B.

When is Constant Velocity Negative

Read more about Relative Motion.

Constant Negative Velocity Example

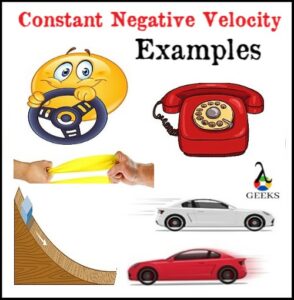
The constant negative velocity example depicts the opposite motion of an object which is listed below:

Constant Negative Velocity Examples

Inclined Plane

When pushing the box upon an inclined slope-like ramp, it slides with constant positive velocity as it pushes it in a positive forward direction. Suppose we leave the box midway through the slope; it slides backward on an inclined ramp in a negative direction. So we can say it slides oppositely with constant negative velocity.

Automatic Door

It is another example where an object moves with constant velocity in a positive direction when we push it. But if we leave the door after we pass, it automatically starts to move in the opposite direction to being closed. While this opposite automatic motion, the door moves with constant negative velocity.

Steering Wheel

It is a constant negative velocity example in terms of rotational motion. While taking a left or right or U-turn, we rotate the steering wheel fully in a clockwise or anticlockwise direction. In such a case, steering wheels move with constant positive angular velocity. To turn the vehicle, we need to rotate the wheel in the opposite direction again, where it moves with constant negative angular velocity.

Dialing Old Telephone

An old-fashioned example depicts an object moving with constant angular motion. While dealing with the telephone, we rotate the dialer in the clockwise direction. Hence its constant angular velocity is positive.

But when we leave the dealer after one rotation, it automatically comes to its original position. The old telephone’s automatic opposite motion portrays that its constant angular velocity is negative.

Stretched Spring

When we stretch the spring forward, its displacement increases with time; hence it moves with constant positive velocity. But the spring has the restoring force that enables it to regain its original position after releasing the stretch. Hence, the spring again moves in the opposite direction to regain its original position due to spring force. Since it moves in the opposite direction, its constant velocity is negative.

Stretched Rubber

Like the last example, rubber also stretches with constant positive velocity in a positive direction. But the rubber material also has the restoring force, which allows it to regain its original position. Hence, after we remove the stretch on the rubber, it moves in the opposite direction regain due to elastic force. Therefore, its constant velocity is negative.

Moving Car

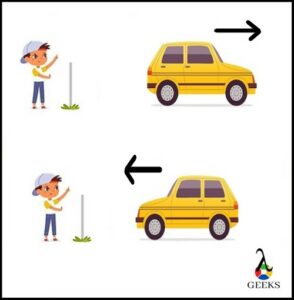
Suppose a boy is standing at the side of the road. If the car is moving away from the boy, then the car moves in a positive direction with the constant positive velocity with respect to the car itself and also with respect to the boy on the road.

But if the car moves toward the boy, then the car moves with constant positive velocity to itself only; but it moves with the constant negative velocity with respect to the boy.

Constant Negative Velocity Example

Running Trains

When two trains run on separate railway tracks, their motion is relative. Therefore, one’s constant positive velocity appears as the constant negative velocity to another train and vice-versa.


Also Read:

Negative Velocity Positive Acceleration Graph: Detailed Analysis

Even when the velocity is negative, acceleration can be positive. Let us know about the negative velocity positive acceleration graph. 

By plotting the graph of velocity-time, we get the acceleration as the slope. The negative sign of the velocity infers that the object’s motion is in the opposite direction. The velocity does not actually go below zero.

If the object moves in the opposite direction, then its velocity is represented by a negative sign. For example, if a boy is going to the market with velocity v, then from coming back from the market to home with the same speed, the velocity will become -v. 

Since velocity is negative, therefore, the acceleration can also be negative. The positive acceleration gives the rate of increasing velocity. At the same time, the negative acceleration implies the rate of decreasing velocity. 

We have already seen that a body can have negative velocity positive acceleration. Let’s take the example we have mentioned above; while coming back from the market, the velocity is negative. Now, if the boy increases his velocity to reach home faster, the acceleration is positive. 

Let us know how to plot negative velocity positive acceleration graphs. 

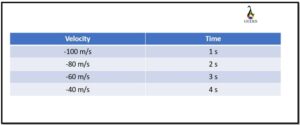
Suppose a man was travelling from his home to his office by car. But due to some reason, he reversed his car and is now moving back to his home. The above table shows us the motion of the car. The negative sign is here to infer that the direction of the object is in the opposite direction.  

We take velocity components on the y-axis, and time is represented on the x-axis. Since velocity is negative, therefore, we take it on the negative y-axis. 

Screenshot 2022 01 29 131753

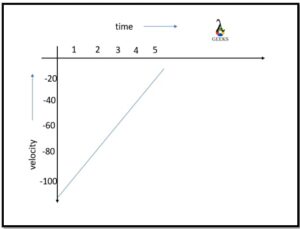
The next step is to plot a negative velocity positive acceleration graph. For this, we take the points from the above table as A(1, -100), B (2, -80), C(3, -60), D(4, -40). 

negative velocity positive acceleration graph

After plotting the graph, we joined all the points and got the slope. We know by calculating the slope of the velocity-time graph, we get to know about the acceleration of the object. On moving, from left to right, the slope is moving upwards, so it is obvious that it is positive, i.e. positive acceleration. 

Now moving on forward, let’s find the acceleration from the graph. Take any two points on the graph P and Q and plot their coordinates. Now substitute these points in the slope formula slope = y2-y1/x2-x1

We know that the slope of the velocity-time graph gives acceleration; therefore, acceleration for the above graph is, which is positive.

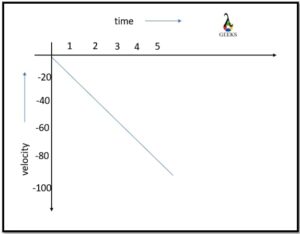
Now the negative velocity graph can be of two types. First, the negative velocity positive acceleration graph and the other one gives negative velocity negative acceleration. 

Screenshot 2022 01 29 132626

The negative velocity positive acceleration graph is as shown in the above figure. The velocity is decreasing, and that too is in the negative direction. And if we move from left to right, the slope is going upward; that is, acceleration is positive.

The negative velocity negative acceleration is as shown in the above figure. Here we can see that velocity is negative and increasing in the opposite direction. And the slope moves downward; therefore, acceleration is negative. 

So, from the above discussion, we are able to understand the negative velocity positive acceleration graph. 

Frequently Asked Questions (FAQs)

Can acceleration be negative?

Yes, the acceleration can be a vector as well because it is a vector. 

The negative acceleration indicates that the rate of velocity of the particular object is decreasing. The negative acceleration is also termed deceleration or retardation. 

is negative velocity positive acceleration graph possible? 

Yes, the acceleration can be negative or positive when the velocity is negative. 

For example, a cat is moving down the tree, then the velocity is negative, but it increases to its speed, then the acceleration becomes positive. Therefore negative velocity and positive acceleration are possible. 

Where is acceleration positive on the velocity-time graph?

From the slope of the velocity-time graph, we get the value of acceleration. 

Therefore to calculate the acceleration, we find the slope of the graph. If the slope is moving upwards when going from left to right of the graph, then the acceleration is positive.

How to find acceleration from a velocity-time graph?

The graph of velocity and time represents the motion of a moving object on the graph. 

On the velocity-time graph, we represent the velocity on the y-axis and the time on the x-axis. Thus slope is calculated by:

slope =Δy/Δx = y2-y1/x2-x1

The slope gives the value of the acceleration of the moving body. 

Does positive velocity mean positive acceleration?

No, the positive velocity doesn’t need to mean positive acceleration. 

For instance, if a person is driving a car at 80 km/hr but after moving to some distance, the traffic increases and he, therefore, decreases its velocity to 50 km/hr. Since the velocity has decreased, it shows negative acceleration but positive velocity. 

What is retardation or deceleration? 

Retardation and deceleration mean exactly the same thing. 

Retardation and deceleration are the same as negative acceleration. It indicates the velocity of the moving body is decreasing with timeThe slope of the negative acceleration is downward that is on moving from left to right it moves downwards. 

What is an example of positive acceleration?

Positive acceleration is explained as the increase in the velocity of the object with time.  

In case you are riding a bicycle and racing with your friend. Now to win the race, you accelerate the bicycle and its velocity increases. The acceleration would be positive; that is, it would be increasing. The slope of positive acceleration moves in the upward direction.

Also Read:

How to Measure Velocity in Fusion Physics: A Comprehensive Guide

how to measure velocity in fusion physics

Measuring velocity in fusion physics involves a range of sophisticated techniques and diagnostics to quantify the velocity distributions of ions and other particles within the plasma. This comprehensive guide delves into the various methods used to measure velocity in fusion physics, providing a detailed and technical exploration of the subject. 1. Ion Velocity Distributions Constraints … Read more

Terminal Velocity 2: A Comprehensive Guide for Physics Students

terminal velocity 2

Terminal velocity is a fundamental concept in physics, describing the maximum speed an object can reach as it falls through a fluid, such as air or water. This phenomenon occurs when the force of gravity acting on the object is balanced by the force of drag. Understanding terminal velocity is crucial for various applications, from … Read more

Constant Velocity vs Time Graph: Graphs And Detailed Analysis

The phrase “constant” refers to a state of being stable. What happens when an object’s velocity remains constant? Let’s look at a constant velocity vs. time graph to see what we are talking about.

When a body or object moves at a constant velocity, the constant velocity vs time graph will have no slope. And because velocity remains constant, i.e., it does not change even when time does, there will be no acceleration.

Velocity vs Time Graph:

The velocity of an object or body is nothing but its speed in a particular direction. It means that if two objects or bodies are moving at the same speed but not in the same direction, their velocities will differ.

In the velocity vs time graph, there will be time on the horizontal axis (X-axis) as it is the independent variable. At the same time, on the vertical axis (Y-axis), there will be the object’s velocity as it is time dependent. The velocity vs. time graph is the one that is used to compare how velocity is changing with time. Moreover, using this graph, velocity and its direction of motion, acceleration of an object, and displacement of an object can be found. The slope of the line in the velocity vs time graph will give us the object’s acceleration. The area under that line, on the other hand, will give us the object’s displacement.

Meaning of the slope of the velocity vs. time graph:

In the velocity vs time graph, the slope of the graph gives us acceleration. As we know, if we divide the change in the y-axis to change in the x-axis, it gives us the slope of the graph. As a result, we can write:

vW1BLbC0dDu WBm0olYoPfQrWN17KYjHk OVQgSJ69gAQMuXT24ODomASWdt 5XhSnmBtT8hV0Tiu4BR r AFyejc8HCEJQCTAntB3d

We now know that velocity is measured on the y axis, and time is measured on the x axis. As a result of plugging in the y axis and x axis values, we get:

dwXcnpbqYslM68k58gxZmDywMCCagIPCpyUg8ASoL8fK2MIns3OXMmi3EqNaHq7AV5oyE8

However, dividing the change in velocity by the passage of time yields the value of acceleration. As a result,  by looking at the slope of the velocity vs time graph, one can calculate the acceleration. Thus, we can write:

Slope = Acceleration a

When the slope is steeper, its value is higher, so the acceleration is greater. And when the slope is less steep, or we might say shallower, its value is less, so the acceleration is lower. 

The meaning of the shape of velocity vs. time graph:

The slope of the graph not only gives the magnitude of acceleration but also tells us how the object is accelerating, i.e., if it is increasing, decreasing, or not accelerating. If the graph has a positive slope, it will also have a positive acceleration. Similarly, if the slope of the graph is negative, it means acceleration is also negative. Lastly, if the graph has no slope or zero slope, the object is not accelerating or has zero acceleration.

To further grasp positive, negative, and zero acceleration, consider the example of boating. The boat is initially stationary on the riverbank. A group of folks decided to take a river trip by boat after some time had passed. As a result, turning on the motor increases the boat’s velocity, and the boat begins to move. The boat is now going at a consistent speed as they approach the middle of the river. They slowed down and then finally came to a halt when they noticed familiar faces on another boat. They restart the boat after some conversation time. This is how the velocity vs. time graph for the entire scenario will look:

vzXjz

If we analyze the graph, we can observe that the boat has no velocity because it is standing on the river bank. As people start the boat’s engine, the velocity increases with time. As a result, its slope will be positive, so its acceleration will be positive. When the boat is moving with constant speed, the graph will be a straight line, and thus it will have no acceleration. After that, as the boat slows down and comes to a halt, its slope will be negative and thus will have negative acceleration, which is also called deceleration.

If you want to know how to find acceleration in the velocity-time graph, go through this article. Let us now focus on the constant velocity vs time graph, which is the primary goal of this article.

Constant Velocity vs Time Graph:

In each time interval, if a body or the object is traveling the same distance in the same direction, then we can say that its velocity is constant. Because velocity does not change with time, the plot of the constant velocity vs. time graph will be a horizontal line parallel to the x axis or the time axis. The line on the graph has no slope because it is horizontal. As a result, we can conclude that the object which is moving with constant velocity has no acceleration.

Consider a car is moving in the east direction with a constant velocity of 7 m/s, i.e., in each second, it travels the distance of 7 m.

WdJXq36qv MGnsCpb 87T8Pn RzaW 0z8YxBuqRCADbXxQp7tDwLW0LTjQ 2f l2ZrtkCDqQjAXv ck45seBr4pZEBitl6kOVJS CqZQ5rQpQ jFdfLoo0gljP 0v2gUXGs0KQFr

If the velocity vs. time graph is plotted for the given data of the car, then the graph will look like the following.

constant velocity vs time graph

We can observe that because the motion of the car is continuous, the graph of velocity vs. time is a horizontal line. As we know, the horizontal line has no slope; hence there is no acceleration. It can be proved mathematically as follows: 

yMHwu4SAaVKh5WMU nY49cvvx HQJItCemyeCJuVK2oYWAjdv asiheDjdMtlmQ1jWLPAf VQqdvoDryGrRbmvgzR 2uFJWUND4V2SYlc88xjOoCj8vwwj9Y9Z0Egebq7 R7YRkh

∴ a = 0 m/s2

Frequently Asked Questions (FAQs):

Q: How can you tell when velocity is constant of a velocity time graph?

Ans: The slope of the velocity vs time graph reveals information regarding velocity and acceleration.

Consider an object moving with any velocity and plot the velocity vs. time graph to know its motion. If an object moves at a constant velocity, it shows that there is no change in velocity with time. Thus the graph has no slope. It means if the graph of velocity vs. time is a horizontal line, then we can say that its velocity is constant.

Q: If the object is not accelerating, does it mean that it is stable?

Ans: The object is said to be accelerating if its velocity keeps on changing with time.

The term “stable” refers to an object that has no velocity and consequently no acceleration. Furthermore, if an object moves at a constant velocity (one that does not change over time), it will not accelerate. As a result, we can conclude that if the acceleration is zero, it is not necessarily stable; it can be traveling at a constant velocity.

Q: How can an object with zero acceleration move?

Ans: An object or body can move only if it is under the influence of force.

As per Newton’s second law, if the acceleration of an object or body is zero, it means there is no net force acting on it. The net force is zero means the opposite force acting on an object or body cancels each other. As a result, we can say that an object or a body can move even without acceleration. 

Also Read:

Constant Velocity in Displacement Time Graph: What, Why, Facts, Problems

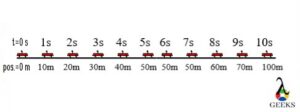
260nw 1928649281 2 2 300x112 1

The article discusses some facts about constant velocity in displacement time graph.

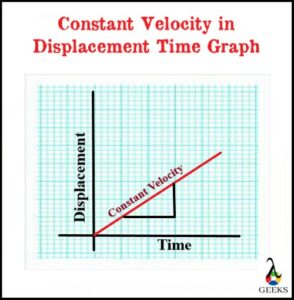
The displacement time graph, known as the position-time graph, represents an object’s motion. When we plot the moving object’s displacement on a y-axis as a dependent variable and time on an x-axis as an independent variable, its straight-line slope reveals an object moves with constant velocity. 

Read more about Horizontal Velocity.

When we plot a moving object’s displacement values for respective time values, we get a slope that displays an object’s motion characteristics

The connection between the slope of displacement time graph and constant velocity: 

  • If a slope appears as a horizontal straight line, it indicates that an object’s velocity is zero, as it is at rest.
  • If a slope appears as a curved line, it indicates that an object’s velocity changes as it is accelerated.
  • If a slope appears as a straight line, it indicates that an object is moving with constant velocity, as it is not accelerated.
What is Constant Velocity in Displacement Time Graph
Displacement Time Graph Slopes

The slope exhibits similar characteristics as the velocity. Let’s investigate the concept of constant velocity in the displacement-time graph. When an object travels with constant velocity, the displacement changes by a fixed value in each unit of time

The graph displays the type of motion and provides the value of velocity. The slope is a change in displacement per change in time values of the line draw, which is equal to the velocity. Simply saying, the calculated slope value is a value of an object’s velocity.

v = s2-s1/t2-t1 = Δs/Δt

How to Calculate Slope
How to Calculate Constant Velocity

Read more about Displacement.

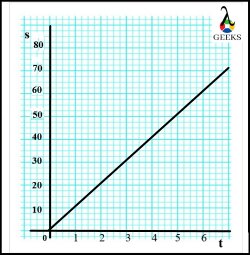
Calculate the constant velocity of the moving car from below displacement vs. time graph. 

Displacement Time Graph

Given:

From graph,

s1 = 0m

s2 = 60m

t1 = 0sec

t2 = 6sec

To Find:

v =?

Formula:

v = s2-s1/t2-t1 = Δs/Δt

Solution:

The value of constant velocity of moving is calculated as,

v = s2-s1/t2-t1 = Δs/Δt

Substituting all values,

v = 60-0/6-0

v = 10

The car moves with constant velocity of 10m/s.

What is Constant Velocity in Displacement Time Graph?

The constant velocity in the displacement time graph is the straight-line slope.

The displacement time graph displays various slopes based on the motion. But the slope emerges as a steep straight line signifies the constant velocity. The steeper or more vertical the graph’s slope line, the faster an object travels with constant velocity as no net force is acted.

Read more about Net Force.

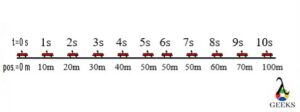
When there is no net force on an object moving with constant velocity, it continues to move with constant speed in the constant direction. But its displacement is changing with respect to time, as shown below figure. If we plot the displacement time data for the moving car, then the resulting displacement time graph as below: 

260nw 1928649281 2 2
Car moving with Constant Velocity

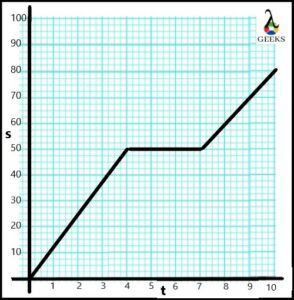
We observe that the car moves with a constant velocity until 50m. Further, it remains stationary for 2 seconds, and then it moves with constant velocity.  

Displacement-Time Graph

Read more about Speed due to Net Force.

From the displacement – time graph above, calculate the following:

How far does the car travel in 8 secs?

What is the constant velocity of the car initially and laterally?

What is the average speed of the car?

Formula:

  • v = s2-s1/t2-t1
  • v=sf-si/tf-ti

Solution:

1) The car travelled 60m in 8 seconds.

2) (i) The constant velocity of the car initially is calculated as,

v = s2-s1/t2-t1

Subsisting values from the slope of graph,

v = 50-0/5-0

v = 50/5

v = 10

The constant velocity of the car initially is 10m/s

(ii) The constant velocity of the car latterly is,

v = s2-s1/t2-t1

Subsisting values from the slope of graph,

v = 100-50/10-7

v = 50/3

v = 16.6

The constant velocity of the car latterly is 16.6m/s

3)The average speed of the car is calculated as,

v=sf-si/tf-ti

Substituting all values from the slope of graph,

v = 100-0/10-0

v = 10

The car’s average speed is 10m/s.

When Velocity is Constant in Displacement Time Graph?

The velocity is constant in the displacement time graph when its displacement changes. 

The correlation between displacement and velocity gives rise to the diverse slope shapes in the displacement time graph. It depends on the positive or negative value of the constant velocity as per an object’s direction. 

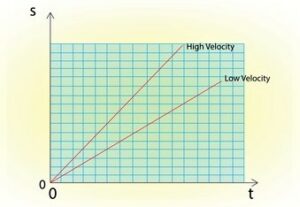
Let’s illustrate the displacement-time graph for high and low constant velocities for the car moving to the right. We observe the slope of the low constant velocity graph is more down than the high constant velocity graph. Both slopes of constant velocities is positive as the displacement changes in an increasing manner. That’s how we can imagine which object is moving faster than the other from the displacement time graph. 

Constant Positive Velocities
(credit: shutterstock)

On the other hand, if an object’s displacement decreases with time, it shows the constant negative velocity in the displacement time graph.

Constant Negative Velocity

We have examined the subsequent facts in the displacement time graph:

  • Greater the slope, the greater the constant velocity.
  • If displacement increases, sloping upwards as time increases, and constant velocity is positive.
  • If displacement decreases, sloping downwards as time increases, and constant velocity is negative.
  • If displacement is zero, the slope is horizontal, and the constant velocity is zero.  

Read more about Relative Motion.

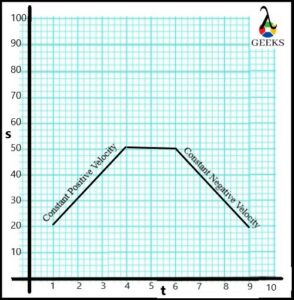
Analyze and comment on different sections in the displacement time graph below. Also, calculate the constant positive velocity and constant negative velocity from the graph. 

Constant Positive Velocity and Constant Negative Velocity

Solution:

1) The section OA represents the constant positive velocity as displacement is increasing.

The positive constant velocity is calculated as

v = s2-s1/t2-t1

Substituting values from the section AB of the graph,

v = 6-0/2-0

v =3

The constant positive velocity is 3m/s.

2) The displacement does not change from section A to B for 4 seconds; that means an object remains stopped at 2m and its constant velocity is zero.

3) The section BC represents the constant negative velocity as displacement is decreasing.

The negative constant velocity is calculated as

v = s2-s1/t2-t1

Substituting values from the section BC of the graph,

v = 0-6/2-0

v = -6/2

v =-3

The constant negative velocity is -3m/s.

4) At point C, displacement is zero; that means the moving object with constant velocity returns to its original position and becomes stationary.


Also Read: