How Does Position Change Velocity: Exhaustive Insights And Facts

h11 300x194 1

In this article, you will know more about one of the critical aspects of physics about how does position change velocity.

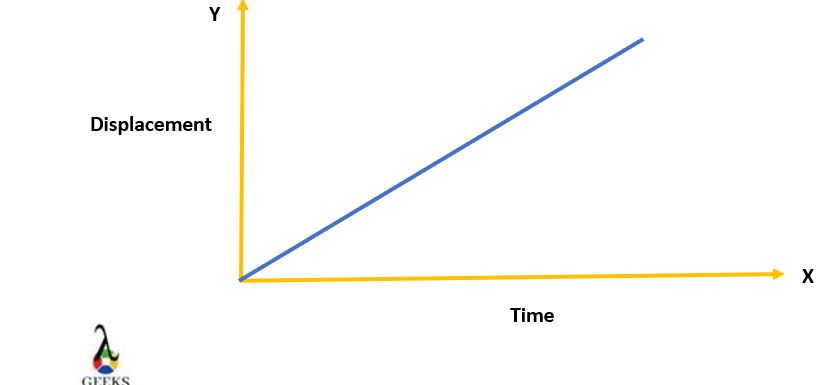
The position of a particle at different places requires a change in velocity. If we plot it on a Position-Time graph and observe the nature of the graph or the curve, the slope will change, indicating that the velocity changes. From this, we can find out that position changes velocity.

Now let us look at the different aspects that tell us about how position changes velocity.

How does position affect velocity

To know how position affects velocity, we have to know some of the aspects of the position-time graph.

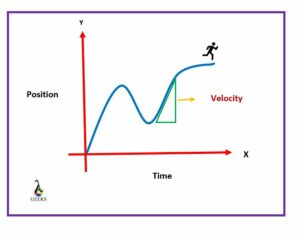
The nature of the curve on a p-t graph, its slope represent the change in velocity of a particle for different positions. If the slope on a p-t graph is constant, even the velocity is constant. If the slope is variable, then even the velocity varies. The direction of the slope also indicates its sign.

Now let’s focus on the relationship between position and velocity.

What is the relation between position and velocity

There will be some change in velocity for every position change, whether it be large or small objects.

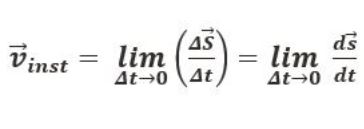
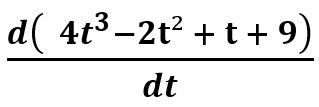
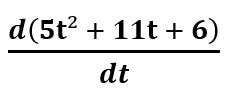
Suppose we consider the change in Position as P(x). In that case, the velocity can be termed as the first derivative of the position function P(x), which signifies that for every minute or significant change in position, there will be the required change in velocity of the object. These can be found out by using the differential equations of velocity.

It is time to look into the change in velocity concerning the position.

Does velocity increase as position increases

The velocity increase as position increases can be defined by using the following criteria.

  • Depending on the position of a particle, there is a required change in velocity
  • When we turn on a vehicle, we have to accelerate it to start quickly.
  • At this point, the velocity will be more so that the vehicle changes its position, and if that vehicle is in the middle of somewhere, then the velocity will be constant based on the route.
  • At the end of the journey, the velocity will sometimes be less; here, the vehicle’s position will be changing at some constant rate.
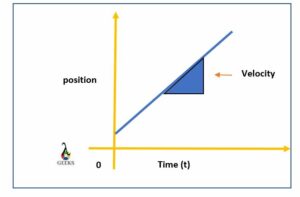
How does position change velocity
Image: Position and Velocity relation
How does position changes velocity

Now let us know how to derive the relationship between position and velocity.

How is position velocity relation derived

Both position and velocity are related to each other by a formula we will derive now.

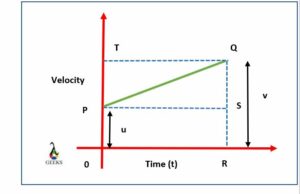
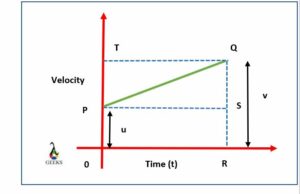
Consider the graph shown in the below image.
How does position change velocity
Image : Velocity-time graph to derive the relation between position and time.

The graph shows that the distance(s) covered by the object in a time interval “t” is represented by the amount of area PQ that is the trapezium area OPQR.

Now we can consider the below equation to find the position velocity relation.

Total distance covered by the body = Area of the trapezium OPQR

Take into consideration the sum of parallel sides and the height.

S = add the two parallel sides and then multiply it by the height.

i.e., s = (sum of the parallel sides) x height(h)/2

s = (OP + RQ) x OR/2

We know that OP + RQ = u + v and OR = t,

After substituting and simplification we get,

s = (u + v) x t/2 ………(1)

Now from the velocity-time relation formula, we can write as below,

t = (v-u)/a

In this step, substitute the value of ‘t’ in equation 1

we get,

s = (u + v)/2 (v – u)/2

we can further simplify it as follows,

v² = u² + 2as

It is the required relationship of position and velocity and can be used to solve various problems related to the position and velocity of the objects.

Now let us see into the aspect about the effect on position when velocity decreases.

What happens to position when velocity decrease

We know that we get constant velocity for an equal amount of change in the position of a particle.

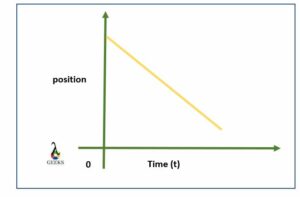
In general, for a constant change in velocity, the distance or the position increases or changes by an equal amount for each time interval unit. On a P-T graph, the changes in velocity can be seen. If there is any decrease in velocity, then the increments on the coordinates of the slope will be smaller, and we get a convex curve from which we can estimate the values of velocity.
How does position change velocity

There will be a change in the increment of velocity for a change in position.

Is position the integral of velocity

The integral of velocity in consideration with the time taken is the position.

We know that in physics, the change in position of a particle in consideration of the time interval is velocity. So, if we consider its integral, we will get the change in the position of a particle. Hence, we can say that the position is the value of the definite integral of velocity. It can be represented in the form of an equation as shown below,

∆s = ∫v dt

Similarly, we can say that velocity is the integral value of acceleration with time.

Is velocity the derivative of position

Above, we discussed how the position is an integral value of velocity. Here we will know about how velocity is derivative of position.

In general, we have an idea that the derivative of any a will be any c, and in contrast, we have studied that the integral value of c will be a. So, we know that the position is the integral value of velocity, and in contrast, velocity will be the derivative of the change in position.

The derivative value of change in velocity will be the change in acceleration.

Does speed affect velocity

Speed and velocity are two different phenomena.

Even if the speed of a particle remains constant, its velocity will keep changing according to time. Because speed is a scalar and velocity is a vector will have a constant value of magnitude and keep changing its direction. So, we can say that speed does not have much effect on the particles velocity.

In the next concept, let us know the exciting aspect of how position changes velocity.

Does the position-time graph have an increase as velocity increases?

By observing the nature of the Position-time graph, we can predict the increment or decrements in the particle’s position.

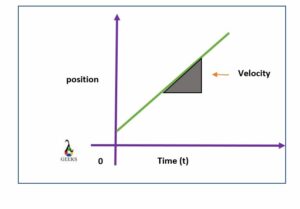
If the velocity increases steadily, then the slope of the position vs. time graph will also increase. From this, we can say that there should be an increase in velocity for a position to increase. Similarly, there should be an increase in position for a velocity to increase.
How does position change velocity
Image: Position-Time Graph

It is how both position and velocity of a body are related.

How does position change velocity

Velocity and position are interrelated to each other by specific formula and BY position-time graph.

Velocity represents both speed of a particle and along which direction it moves. We can also term it as the rate of change of position of a particle in consideration with time. Even the velocity is the derivative of position change and vice versa. In all these ways, position and velocity are interrelated.

Frequently asked Questions | FAQs

What factor makes the velocity increase?

The acceleration is one of the main factors that make the velocity increase.

If the acceleration of a particle is positive, then the velocity will be increasing for a specific time interval. But if the acceleration is in a negative direction, then the velocity decreases.

Can velocity increase if acceleration is negative?

If the acceleration is negative, there is less chance for a velocity to increase.

Consider that a particle moves along the negative direction with varying velocity. Here, the acceleration will be increasing but acting in a negative direction, so even the velocity will be along the negative direction, decreasing instead of increasing.

Does velocity have a direction?

Velocity is a physical vector quantity, so it consists of direction.

The velocity is a vital vector quantity; the direction of velocity will be along the direction of the particle in which the particle moves. It shows the magnitude of speed and how quickly the body moves in a specific direction.

When velocity increases, what happens to the position?

 When velocity increases, there will change in the particle’s position for which the velocity is calculated.

The slope of the position-time graph will constantly increase as there will be a change in the particle’s velocity. The slope of the P-T graph gives the values of velocity at different coordinates.

How can we tell whether velocity is increasing or decreasing?

We can take the help of specific formulas or even acceleration-time or position-time graphs to know the change in velocity.

From the position-time graph, we can look into the slope and determine the slope value from which c can know the velocity since velocity is the derivative of a p-t graph. Another way is to look into the acceleration factor and determine the increase or decrease in velocity.

What is the meaning of position in physics?

In general, the position is where the objects or particles are located.

In physics, the position is a fundamental quantity to be measured to determine other physical factors such as velocity acceleration, speed, etc. It is a vector because the direction is taken into consideration.

Also Read:

Position Time Graph To Velocity Time Graph: Exhaustive Insights And Facts

image 2

This post let us know the different aspects of the Position time graph to velocity time graph and their relation.

The relation between position time graph to velocity time graph is that the V-T graph is derived from the P-T graph. The primary difference between them is that the velocity-time graph tells about the body’s speed and position-time about the absolute path traveled by the particle in motion.

image 2

The transition from a Position-Time Graph (PTG) to a Velocity-Time Graph (VTG) is achieved through the process of differentiation. In simpler terms, the slope or gradient of the position-time graph at any given point gives the velocity at that point, which can then be plotted on the velocity-time graph.

Key Points :

Here’s a table that helps summarize the relationship:

Aspect Position-Time Graph Velocity-Time Graph
Y-Axis Position (Displacement) Velocity
Slope Represents Velocity Acceleration
Horizontal Line Constant position (no movement) Constant velocity
Upward Sloping Line Positive velocity Positive acceleration
Downward Sloping Line Negative velocity Negative acceleration
Steeper Slope Greater velocity Greater acceleration
Curve Upwards Increasing velocity Positive acceleration
Curve Downwards Decreasing velocity Negative acceleration
Area Under Curve Not commonly used for interpretation Displacement from a point in time
Intercept with Y-Axis Initial position Initial velocity

Some things to keep in mind:

  • The x-axis is time in both cases.
  • The transition from a position-time graph to a velocity-time graph involves finding the slope at each point on the position-time graph. This can be done by calculating the derivative in the context of calculus.
  • The velocity-time graph can then be used to determine acceleration by looking at its slope or the rate at which velocity changes.
  • Similarly, the transition from a velocity-time graph to an acceleration-time graph involves finding the slope of the velocity-time graph.

Now let us know about different insights of these two graphs as it is the post’s primary focus.

Position time graph to velocity time graph examples

The following graphs are some examples of position time to velocity-time graph transitions.

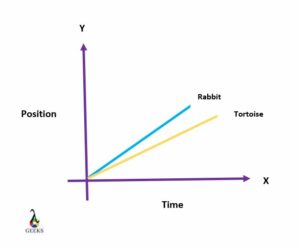
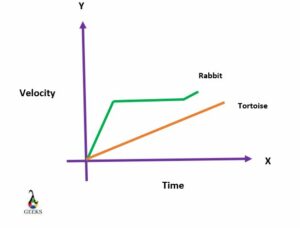
If we consider the race of rabbit and tortoise as an example, we can plot both the graphs as follows if we take the change in distance and velocity.

position time graph to a velocity time graph
Image: Position-time graph
position time graph to a velocity time graph
Image: Velocity-time graph

Again, if we consider one more example of an athlete in a marathon, we can consider the change in his position and velocity and plot it below.

position time graph to a velocity time graph
Image: Position-time graph
position time graph to a velocity time graph
Image: Velocity-time graph

The slope on the P-T graph shows the velocity in both examples, and the area under the V-T graph accelerates the considered characters.

Now let us see into some examples of P-T graphs.

Position vs time graph examples

By looking at the examples of the position-time graph, we can understand them better.

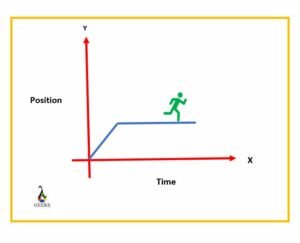
Consider a person going on a walk at a specific rate. Then he feels to jog, there is a transition of position with time, and by plotting the values, the P-T graph obtained will be as below it represents an increase in velocity.

position time graph to a velocity time graph
Image: Position-time graph of a person

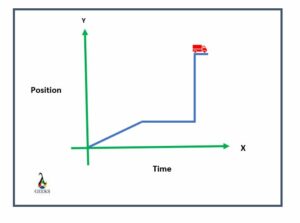
Consider a truck that moves on a linear path without taking any turn; if we plot the P-T graph for its value, we obtain a linear graph representing the constant velocity.

position time graph to a velocity time graph
Image: Position-time graph of a moving truck

These are some examples of P-T graphs.

Position vs time graph

The P-T graph generally indicates the velocity/speed of the body in motion.

A position vs. time graph indicates the distance of path that the particle has traveled, considering from its beginning point to the final point of the movement. It has a time interval on its x-axis and position on the y axis. If the slope is steep, it indicates that it has a large slope, and the particle speed changes quickly.

Now let us know how to convert a P-T graph to a velocity-time graph.

How do you convert a position time graph to a velocity time graph

To convert a position-time graph to a velocity-time graph, we have to follow some simple steps;

  • We know that the derivative of the P-T graph is the Velocity time graph. You can also measure it by using the formula.
  • If we calculate the slope of the P-T graph, then we obtain velocity as a result.
  • After obtaining the velocity, we can plot the V – T graph under it and calculate the area under it to measure acceleration.

In this way, we can convert position time to the velocity-time graph.

Is position time graph same as velocity time graph

Both the graphs are different from each other in finding some aspects.

The main difference between the P-T graph and the V-T graph indicates the body’s speed depending on the increase or decrease in the vehicle. At the same time, the P-T graph indicates the movement of that body over a certain period.

Now it’s time to study the relationship between the P-T graph and velocity.

How does position and time relate to velocity

To measure the velocity of a particle, the concept quantities position and time are required.

 Should know the position and time of the object to calculate the velocity of the particle that is traveling. If any of the quantities are not known, then it won’t be easy to measure the velocity of that particle. They are related to each other by formula and even by the slope of the P-T graph that calculates velocity.

Now let us know how position affects the velocity of a body.

How does position affect the value of velocity

The slope of the P-T graph directly affects knowing the nature of velocity.

  • We know that by looking at the value of slope on the P-T graph, we can find the nature of velocity, i.e., we can say that,
  • The constant value of a slope on the P-T graph indicates the object has constant velocity.
  • Changing slope indicated variable velocity.
  • If the slope is downwards or from left to right, it will be considered negative velocity.

The direction of the slope of the P-T graph represents the nature of velocity.

Importance of Velocity-time graph

To know the measure of acceleration and displacement V-T graph is useful.

We know that we can calculate two different quantities from the two different elements of the V-T graph, i.e., by knowing the value of the slope of the V-T graph, we can find its acceleration. In the same way, by calculating the area under its curve, we can measure the object’s displacement.

Now let us know the importance of the P-T graph.

Importance of position-time graph

In the P-T graph, we can calculate the distance traveled by the body in its motion and taken time.

We can measure the body’s motion at a specific time interval on a position-time graph. After plotting the values on the x and y-axis and joining the values, we can measure the slope, and this slope signifies the value of the velocity of that body.

Both the graphs have their importance.

Frequently Asked Questions | FAQs

How does constant velocity look like on a position-time graph?

To know about how the graph of constant velocity looks on a position-time graph, we can see below,

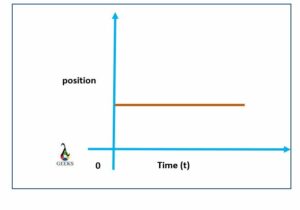
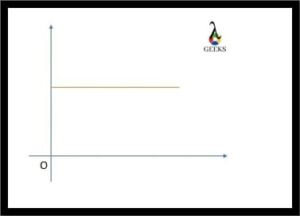
If we plot a graph of position with time and the body in the motion traveling with constant velocity, the graph will be in the form of a straight line. We sometimes observe the horizontal line on a position-time graph, which symbolizes zero velocity.

Can distance-time graph and velocity-time graph be similar?

Two different quantities can be found on the position-time graph and velocity-time graph.

The position-time graph involves the object’s position change, and the time represents the amount of distance moved by that object in a particular period. At the same time, the slope or area under the velocity-time graph line indicates the object’s acceleration within a particular time.

What is the method to find out the V-T graph?

As the name indicates, we can use a graphical method to find the velocity value.

  • First, choose any two points on the curve and find their coordinates.
  • Take the difference of the two chosen points along both the y and x-axis.
  • In the third step, divide the values of the y-axis with the values of the x-axis.
  • The obtained value is turned out to be the value of the required quantity.

What do position-time graphs show?

The P-T graph represents the amount of change in the position of a body in motion.

In general terms, we can tell that a position-time graph can represent the amount of distance or the change in position of a body, taking into consideration from the beginning to end of the particular motion in a simple manner.

How do you describe a position-time graph?

We can take the help of slope on a P-T graph to describe it.

In a P-T graph, the change in velocity of a body is obtained by calculating the slope/steepness of the line on the graph. If the graph is linear or flat, then the body’s position is constant. If the line is steeper, there will b an increase in a curve, and the body moves faster.

Can we create an accurate position vs. time graph using a velocity vs. time graph?

Cannot create the accurate position vs. time graph from the velocity vs. time graph.

We know that a P-T graph gives the total amount of distance traveled by the body. But on a V-T graph, the slope signifies the value of change in velocity and gives no information about the position of that body. From this, we can say that it is impossible to create an accurate P-T graph from a V-T graph.

What kind of graph do we obtain if we plot the position-time graph of the moving truck?

Here are some consequences are given below that might help know the nature of the graph.

  • The kind of graph will usually depend on the nature of motion.
  • The P-T graph will not be linear to the x-axis since the time does not remain the same.
  • Similarly, the P-T graph will not be linear to the y-axis since it is not stationary does not remain the same.
  • It will not be a parabola curve, as time cannot be negative.
  • Finally, we can tell that it will have some measurable slope and a line to obtain the velocity value.

Also Read:

Does Velocity Affect Potential Energy:Detailed Facts,Examples And FAQs

quicklatex.com 6450f6733af3c7ae86561afe41980fcf l3 4

Does velocity affect potential energy? The relevant question came to mind while talking about potential energy.

The potential energy is the capacity to cause the work, which is possessed by a stationary object due to its position and configuration. Then how does velocity affect potential energy of the object? Let us know the significance of velocity on the potential energy in this post.

How does velocity affect potential energy of the system?

Generally, the potential energy is possessed by the object at the stationary state. If there is no movement takes place then the velocity will be zero. This implies that the velocity has nothing to do with the potential energy as long as the object is at rest. But when the object starts moving, the potential energy decreases with an increase in the velocity because now the energy acting object is the kinetic energy.

Does velocity affect gravitational potential energy?

The gravitational potential energy is the work done by the gravitational field.

The general expression for the gravitational potential energy is given by

U = m*g*h Where U is the potential energy, g is the acceleration due to gravity, h is the height of the object associated with its center of mass.

If the velocity of the object is against the gravitational pull, i.e., in the upward direction, the gravitational potential energy increases because the kinetic energy is converted into potential energy.

Suppose the velocity of the object is in the same direction of the gravitational pull i.e., in the downward direction, the gravitational potential energy decreases because the kinetic energy becomes maximum by converting all the potential energy. Thus increases in the velocity nullify the potential energy.

Does velocity affect elastic potential energy?

Elastic potential energy is stored in the physical system subjected to elastic deformation. This kind of energy can be seen in the stretched string or spring, which can regain its original shape even after the compression or elongation.

The elastic potential energy is given by the expression;

CodeCogsEqn 56 1

Where K is the spring constant and ∆x is the position of the spring.

It is clear that the elastic potential energy depends on the spring constant and the position of the spring, not on the velocity. So the velocity has nothing to do with the elastic potential energy.

Does velocity affect electric potential energy?

The electric potential energy is associated with the two oppositely charged particles by the virtue of their configuration, generally, between the positive and negative charges. Generally, it is given by the formula;

CodeCogsEqn 57

The time-variant electric filed describes the electric potential energy; in contrast, the time-invariant electric field is describes the electrostatic potential energy.

The electrostatic potential energy is given by the formula;

CodeCogsEqn 58

Let us imagine that electron is placed inside a uniform electric field, like a parallel plate capacitor. As the electron experience the electric field, it begins to accelerate in the opposite direction, and hence the kinetic energy of the electron is increased.

electric PE
Electric Potential Energy

As the velocity increases, the electron will gain more kinetic energy, and its potential energy decreases. But the system’s total energy remains the same because the gain of kinetic energy compensates for the loss of potential energy.

It can be expressed by using the formula given below:

CodeCogsEqn 59

Where m is the mass of the electron, v1 and v2 are the initial and final velocity of the electron, V1 and V2 are the electric potential energy.

Does velocity affect chemical potential energy?

The chemical potential energy is possessed by the strength of the bond between the molecules.

The chemical potential energy of a compound is released in two ways; one is some of the potential energy is converted into work which causes the motion, and another is some of the potential energy is released in the form of heat.

In the first case, the stored potential decreases as the energy are converted into work. This is due to the work that causes the motion, and hence the stored potential energy converted as kinetic energy. The velocity increases as the kinetic energy increase so that the potential energy gradually decreases.

Frequently Asked Questions

When will the stored potential energy become zero?

The stored potential energy becomes zero only when all the potential energy is transforms into kinetic energy or released in the form of heat.

If the force is applied to the system, it begins to move. At that instance, the kinetic energy is obtained by transforming the potential energy. This kinetic energy is responsible to increase the velocity. The increase in the kinetic energy makes the potential energy zero.

When is the gravitational potential energy not affected by the velocity?

Gravitational potential energy is possessed on the object by virtue of gravity acting on the body.

Until the body is stationary, the potential energy remains the same in the body. The gravitational potential energy is also not affected by the velocity until the body moves parallel. If the body moves upward or downward, the velocity affects the gravitational potential energy.

How can electric energy be potential energy as there is a movement of the electron?

The electric potential energy can be both potential and kinetic energy as there is a motion of the electron.

Before releasing the electron, it is considered the potential energy. Once the electron is released, it begins to move in the opposite direction. The energy required to keep the electron in motion is kinetic energy. So the electron has both potential as well as kinetic energy.

Give examples for chemical potential energy?

The examples for chemical potential energy are:

The fuel in the car consists of a large number of chemical bonds held by the potential energy. The fuel burnt and caused the motion of the car. By breaking the bond potential energy is released as kinetic energy which makes the car to move.

Dynamite is another excellent example of chemical potential energy that causes a large amount of heat when it explodes.

How does the total energy remain the same even if the potential energy is lost?

The work done on the system compensates for the loss of potential energy.

From the work-energy theorem, the work done by a system and the total energy are equal. The loss of potential energy may be converted into work, or it may be released in the form of heat, which is also responsible for doing the work on the system. The system’s total energy never decreases even though potential energy is lost.

Which state of matter has more potential energy?

Solid has more potential energy than liquids, and liquid has more potential energy than gases.

The potential energy is due to the position rather than the motion. The solid has much potential energy as a strong force holds the particles, and it is slightly difficult to move the solid substance compared to the other two states. Hence solid have much greater potential energy.

Also Read:

How To Calculate Mass From Force And Velocity: Several Approaches and Problem Examples

mass from force and velocity 0

When it comes to understanding the relationship between force, mass, and velocity, it’s crucial to have a clear grasp of the fundamental principles of physics. In this blog post, we will explore how to calculate mass from force and velocity, delving into the underlying physics, mathematical representations, and step-by-step calculation methods. By the end, you’ll have a solid understanding of this concept and its practical applications in the field of physics and engineering.

The Relationship Between Force, Mass, and Velocity

The Physics Behind Force, Mass, and Velocity

In physics, force, mass, and velocity are interconnected concepts that play a fundamental role in describing the motion of objects. According to Newton’s second law of motion, force (F) is directly proportional to the product of mass (m) and acceleration (a). Mathematically, this can be expressed as:

F = m cdot a

Velocity (v), on the other hand, represents the rate of change of displacement with respect to time. It is calculated by dividing the change in position (∆x) by the change in time (∆t):

v = frac{Delta x}{Delta t}

The Mathematical Representation of the Relationship

By combining the formulas for force and velocity, we can derive an equation that relates mass to force and velocity. Rearranging Newton’s second law equation, we have:

m = frac{F}{a}

Substituting the formula for acceleration (a = ∆v/∆t), we obtain:

m = frac{F}{frac{Delta v}{Delta t}}

Simplifying further, we find:

m = frac{F cdot Delta t}{Delta v}

This equation allows us to calculate mass (m) when we know the force (F) and the change in velocity (∆v) over a given time interval (∆t).

How to Calculate Mass from Force and Velocity

mass from force and velocity 2

Step-by-Step Guide to Calculate Mass

To calculate mass from force and velocity, follow these steps:

  1. Determine the force acting on the object. This can be obtained from experimental data or given in the problem statement.
  2. Measure the change in velocity (∆v) of the object over a given time interval (∆t).
  3. Substitute the values of force and ∆v into the equation:

m = frac{F cdot Delta t}{Delta v}

  1. Calculate the mass using the formula.

Worked Out Examples on Calculating Mass

Let’s consider a few examples to illustrate how to calculate mass from force and velocity.

Example 1:
A force of 20 N is applied to an object, causing it to accelerate from rest to a velocity of 10 m/s over a time interval of 5 seconds. What is the mass of the object?

Solution:
Given:
Force (F) = 20 N
Change in velocity (∆v) = 10 m/s
Time interval (∆t) = 5 s

Using the formula
m = frac{F cdot Delta t}{Delta v}

Substituting the given values:
m = frac{20 , text{N} cdot 5 , text{s}}{10 , text{m/s}}

Simplifying the expression:
m = 10 , text{kg}

Therefore, the mass of the object is 10 kg.

Example 2:
A ball is subject to a constant force of 12 N and accelerates uniformly to a velocity of 6 m/s in 0.5 seconds. What is the mass of the ball?

Solution:
Given:
Force (F) = 12 N
Change in velocity (∆v) = 6 m/s
Time interval (∆t) = 0.5 s

Using the formula
m = frac{F cdot Delta t}{Delta v}

Substituting the given values:
m = frac{12 , text{N} cdot 0.5 , text{s}}{6 , text{m/s}}

Simplifying the expression:
m = 1 , text{kg}

Therefore, the mass of the ball is 1 kg.

Common Mistakes to Avoid While Calculating Mass

When calculating mass from force and velocity, there are a few common mistakes to watch out for:

  1. Forgetting to convert units: Ensure that all measurements are in consistent units (e.g., meters, seconds, Newtons) before plugging them into the formula.
  2. Using average velocity: Be careful to use the change in velocity (∆v) rather than the average velocity when calculating mass.
  3. Neglecting the sign of the force: Pay attention to the direction of the force and consider its sign when calculating mass.
Applications of Calculating Mass from Force and Velocity

Real-life Scenarios Where Mass Calculation is Required

mass from force and velocity 1

The ability to calculate mass from force and velocity has numerous practical applications. Some examples include:

  • Automotive engineering: Determining the mass of a vehicle is crucial for understanding its performance, fuel efficiency, and stability.
  • Sports science: Calculating the mass of athletes’ bodies can help in training and performance analysis.
  • Aerospace engineering: Estimating the mass of aircraft and spacecraft is essential for flight dynamics, fuel consumption, and payload capacity.

Importance of Calculating Mass in Physics and Engineering

mass from force and velocity 3

Understanding the relationship between mass, force, and velocity is vital in physics and engineering. It allows us to analyze and predict the behavior of objects in motion, enabling advancements in fields such as:

  • Kinetic energy: The ability to calculate mass helps determine an object’s kinetic energy, which is a crucial concept in understanding energy transformations.
  • Momentum: Calculating mass allows us to determine an object’s momentum, which is essential for analyzing collisions and determining the effect of forces on objects.
  • Gravitational force: By knowing the mass of objects, we can calculate the gravitational force they exert on each other, allowing us to explore celestial mechanics and understand phenomena such as planetary motion.

How can force and velocity be used to calculate mass?

The concept of calculating mass from force and velocity is explored in the article “How to calculate mass from force and velocity“. However, another interesting question arises: “How to find mass without acceleration?” This topic is covered in detail in the article “How to find mass without acceleration“. In this article, you can learn about methods to determine mass even without the presence of acceleration. It provides valuable insights into the calculations and equations involved in such scenarios.

Numerical Problems on how to calculate mass from force and velocity

  1. Problem: A force of 10 N is applied to an object and it accelerates at a rate of 2 m/s^2. Calculate the mass of the object.

Solution:

Given:
Force (F) = 10 N
Acceleration (a) = 2 m/s^2

We know that force (F) is related to mass (m) and acceleration (a) by the equation:

 F = ma

Substituting the given values, we have:

 10 = m times 2

To find the mass (m), we divide both sides of the equation by 2:

 m = frac{10}{2}

Therefore, the mass of the object is 5 kg.

  1. Problem: An object has a mass of 2 kg and is moving with a velocity of 4 m/s. Calculate the force acting on the object.

Solution:

Given:
Mass (m) = 2 kg
Velocity (v) = 4 m/s

We know that force (F) is related to mass (m) and velocity (v) by the equation:

 F = mv

Substituting the given values, we have:

 F = 2 times 4

Therefore, the force acting on the object is 8 N.

  1. Problem: A car of mass 1200 kg accelerates from rest to a velocity of 20 m/s in 10 seconds. Calculate the average force exerted on the car during this time.

Solution:

Given:
Mass (m) = 1200 kg
Initial velocity (u) = 0 m/s
Final velocity (v) = 20 m/s
Time (t) = 10 s

We know that average force (F) is related to mass (m), initial velocity (u), final velocity (v), and time (t) by the equation:

 F = frac{m(v-u)}{t}

Substituting the given values, we have:

 F = frac{1200(20-0)}{10}

Simplifying the equation, we get:

 F = frac{24000}{10}

Therefore, the average force exerted on the car during this time is 2400 N.

Also Read:

Constant Acceleration Graph Velocity Vs Time: Detailed Insights

In this article, we will study Constant Acceleration Graph Velocity Vs time, which is one of the essential aspects of finding the value of acceleration.

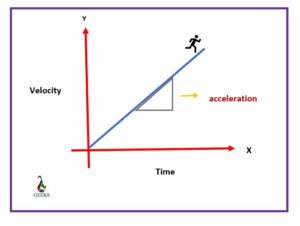
As the term constant indicates steadiness, the constant acceleration graph velocity vs time indicates that the acceleration remains constant throughout the motion, only we can find the change in velocity of a body for a certain period by measuring the slope of the plotted curve the V-T graph.

Now let us focus on different aspects of constant acceleration graph velocity vs time, which is the main focus.

What does constant acceleration look like on a velocity vs time graph

The graph of constant acceleration will be linear.

The term constant indicates that there will be no change in acceleration during a particular motion. If the object undergoes this type of acceleration, then the graph plotted will be linear along with slope; these curves are used to find out the value of only variable velocity.

Now let us know about velocity and constant acceleration relation.

What happens to the velocity at constant acceleration

It is known that if the body is accelerating, there is a change in velocity.

  • The accelerating body changes the velocity by an equal amount for each second. It is known to be constant acceleration since velocity changes by an equal amount for a period. Should not compare it with a body having a constant velocity.
  • If we consider a V-T graph, this acceleration is calculated by knowing the slope of the line. If that line is horizontal, that velocity will be constant, and the acceleration will be zero.

It is time to study the graph of constant acceleration.

To know about how to find average velocity on A-T graph check here.

How to know if a graph has constant acceleration

We can interpret the velocity-time or V-T graph by seeing the shape of the curve on its graph.

  • If the V-T graph has a parabolic position curve, it has constant acceleration.
  • It is referred to as a constant acceleration graph.
  • It is further obtained when constant acceleration indicates the continuous change in velocity of a motion.
  • When plotted, the graph will have a steady increase in slope.
  • Constant also ensures that the V-T graph has a constant slope.

The constant acceleration may be straight or parabolic, depending on the values.

How do you interpret an acceleration vs time graph

We can measure the value of change in velocity from the acceleration vs time graph.

When we use the values of observed motion and plot it on a constant acceleration graph vs time, the area under the curve obtained tell about the change in velocity of an object. In other words, we can say that area under the curve for a period will be equal to the velocity change during that interval.

The A-T graph is meant for finding out the velocity change.

How do you graph velocity vs time

There are two possibilities to plot a V-T graph that are summarized below.

  • When the values are plotted on a V-T graph, there will be two types of motion that are classified as constant and variable velocity.
  • The slope of the variable velocity vs time graph gives acceleration. It indicates that the slope at a certain period indicates the acceleration value of the body at that point.
  • If the slope is sharp or steep, the body will have rapid variable velocity.
  • If the slope is shallow, then there will be constant velocity.
  • The other two cases are that if the slope is positive and upwards, then acceleration is positive.
  • If the V-T graph slope value is negative and plotted downwards, the acceleration will be negative. The following image can be an example for motion.
constant acceleration graph velocity vs time
Image credit:
Pixabay free images

Now let us get some information regarding the constant acceleration graph vs time.

Significant cases of Constant acceleration graph velocity vs time

The three essential cases regarding acceleration graph velocity vs time are summarized below.

Case 1: V-T graphs with constant velocity for the case of zero acceleration

  • In a V-T graph, the y-axis signifies velocity, and the x-axis denotes time.
  • From the graph shown below, we can interpret that V is constant in the whole time interval.
  • Even though the time changes, the velocity will be constant at each graph point.
  • Here the initial velocity is positive because we get a different graph when we choose negative initial velocity.
  • Example: Acceleration of an object is zero, and velocity is constant at the rate 6m/s at t=0, then it remains constant throughout the interval.
constant acceleration graph velocity vs time
Image: zero acceleration

Case 2: Constant acceleration graph velocity vs time

Suppose the acceleration and constant, in other words, will be positive, and the initial V is zero. In that case, the velocity of the object increase and we get a linear curve of values when calculated with the help of the following equation.

V = u + at

Here u = 0, then the above equation becomes

V = a * t

constant acceleration graph velocity vs time
Image: Constant acceleration

As shown below, the area’s slope under the graph will measure the magnitude of acceleration.

Case 3: V-T graphs with increasing acceleration

When there is an increase in acceleration, along with time being, the V-T graph obtained will be a curve that can be measured using the formula as shown below,

V = u + (a * t)

Here u = 0, then the above equation becomes

V = a * t

  • We know that acceleration is a function of time; this is why we obtain a curve on the V-T graph.
  • It was only about the increase in acceleration; the deceleration graph will be different from the positive acceleration vs time graph.
  • For example, if a body’s acceleration is a function of t and the initial velocity U=0, the graph will be a curve. The slope of the V-T graph at any instant point of the period gives the acceleration at that time.
constant acceleration graph velocity vs time
Image : Increase in acceleration

Since the acceleration increases continuously with t, the magnitude of its slope will also increase.

Frequently Asked Questions | FAQs

What does the area under a velocity-time graph indicate?

The area we get when we plot the velocity-time graph is a change of position of a body.

When we want to calculate the acceleration on a velocity-time graph, we plot its values. Hereafter plotting the values, we get a specific area under the graph that signifies the displacement that can even be known as a change in position of a body when it is in motion.

What is the slope of the velocity-time graph?

We know that we can calculate acceleration value from the typical velocity-time graph.

When we plot a velocity vs time graph, we will find the value of the acceleration of a body travelling on a path; that is why the slope of the V-T graph represents an acceleration of a body. When we calculate the slope at a particular time, it indicates the acceleration of the body at that point.

How can we interpret an acceleration time graph?

We can interpret an acceleration vs time graph by finding the area under the plotted graph.

The area on the plotted acceleration time graph tells about the change in velocity of the body in motion at a particular period. From this, we can say that area under the curve of the A-T graph is approximately equal to the velocity change of the body.

How do you find out that a graph has constant velocity?

You must see many Velocity time graphs to interpret its values.

If you consider any one of the V-T graphs, and if it is a flat line or horizontal line, we can consider that it has constant velocity. If the graph is other than horizontal, then the velocity is variable, and if you consider an A-T graph and it will be zero, then even in this case, there is constant velocity.

What happens to velocity when the acceleration is constant?

Velocity will not be constant when the acceleration is constant.

In a particular example of motion, if the acceleration of the motion is constant, then there will be no constant velocity because the constant quantity per second will alter the velocity of an object in a specific motion.

How does velocity change with constant acceleration?

There will be a change in velocity when the body moves with constant acceleration.

If a body undergoes constant acceleration, then there will be some constant change in that body’s velocity. If both velocity and acceleration are in the same direction, then the trajectory of this graph will be similar to the graph plotted for no acceleration.

How can you interpret that acceleration is constant from a velocity-time graph?

We can interpret the value of acceleration by observing the type of curve on the graph.

When a body undergoes constant acceleration, the graph will be linear, i.e., straight and sloped. These lines on the V-T graphs represents the change in velocity during motion, but not in the case of constant acceleration and deceleration.

Also Read:

How To Find Average Velocity On A Acceleration Time graph: Different Approaches And Problems

how to find average velocity on a acceleration time graph science 0

If a motion involves constant acceleration, we can learn an easy method how to find average velocity on a acceleration time graph in this article.

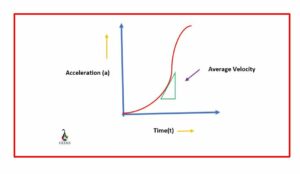
To know how to find average velocity on a acceleration time graph, we must know that the Vavg of an object is measured by dividing the total change of position seen in a motion concerning the time taken to complete that motion. Similarly, on A-T graph by measuring the slope of the initial and last points of the plot.

Now let us know how to find average velocity on the acceleration time graph in detail.

How to find average velocity on a position-time graph

how to find average velocity on a acceleration time graph science 1

To find average velocity on a P-T graph, we have to know some basic ideas that are as follows,

In general, we know that Vavg is calculated based on the criteria of position and time; these two are essential in measuring Vavg, So the thing we can do is assign the values and label the axis, then plot it. Draw a slope to the curve, mark any two points, and consider the initial and endpoints. The value of this slope will be Vavg.

Now let us know about the acceleration time graph.

Acceleration-time graph

how to find average velocity on a acceleration time graph science 2

There are many relation graphs in physics to find quick values of specific quantities.

Acceleration time graphs are one of those crucial graphs. We require to convert a velocity-time graph into an acceleration time graph to find out specific values, i.e., by finding the derivative of certain values such as average velocity. We can take the slope of a line tangent to the curve drawn at the graph at any point.

Now, as we learned about the A-T graph, let us know about its features.

Features of Acceleration Time graph following average velocity.

how to find average velocity on a acceleration time graph science 3

The essential features of the acceleration time graph in accordance with calculating average velocity is as follow,

  • To find Vavg on the A-T graph, after doing all the labeling and plotting, and joining of values.
  • Draw a slope, and that slope is called jerk. Here slope values will be equal to the total average velocity.
  • In the case of constant acceleration, s should calculate the slope value for the obtained horizontal line, which is termed average velocity.
how to find average velocity on a acceleration time graph

After all this, it’s time to see the different aspects of this approach.

Aspects of acceleration time graph and average velocity

The different aspects of the acceleration time graph and average velocity can be seen below,

  • The acceleration time graph of all the objects that moves with constant V will be similar.
  • The object might be a large airplane or small ant, and the graph will be the same, differing in their values.
  • The graph will be collinear on the x-axis (horizontal line).
  • The V will be similar for all these objects in their reference.

How to find average velocity on a acceleration time graph?

There are specific steps to find the V on the acceleration time graph.

First and foremost, we have to note the initial velocity and the constant acceleration of the body in motion.

Then use this acceleration and find out the final velocity.

After finding all the values, plot them on the A-T graph.

  • Consider any two points and draw a slope.
  • Then measure the area under that curve and use the formula
  • The formula includes distance and time, use the average velocity formula and derive it from obtaining the term used to measure average values.
  • Later the tangent and slope are drawn to give us the value of the required V.

This way, we can find the average velocity on an acceleration time graph.

Relation between acceleration time graph and average velocity

To find V., we sometimes use an acceleration time graph. There are two critical cases of acceleration in measuring average velocity.

  • Both the quantity’s average velocity and acceleration do not depend on each other.
  • If there is more acceleration, then the change in velocity will be maximum, but it does not tell about velocity at a particular time. Here we get the overall value of velocity termed average velocity.
  • Coming to the other case, if the acceleration is constant, the A-T graph will be linear. Here the average velocity will be similar at all the points.

Now let us solve some problems to understand them better.

Problems to find average velocity using acceleration time graph.

Here are some problems to solve to understand the concept better.

Problem 1

The initial velocity of the body moving in the positive direction is zero, but as it moves, its acceleration is 9m/s; find its velocity will be at 8s?

Solution: 

∆V = a∆t

∆V = (9.8m/s)(1.0s)

∆V = 9.8m/s

Now the final velocity is to be calculated

∆V = a∆t

∆V = (9 m/s) (8s)

∆V = 72m/s

If we find this on the acceleration time graph, we will find the average velocity by calculating the area under the curve.

It is one of the fundamental problems to solve on V on an A-T graph.

Different Approaches to find Average velocity

Average velocity can be found mainly by two methods that are illustrated below,

  • With the help of specific formula, we can find average velocity in many ways by using distance or position change of the object on a path at a specific time.
  • We can even use calculus to find out the required average velocity.
  • Another method to find out Vavg is using certain graphs such as a position-time graph, Velocity-time graph, and even an acceleration-time graph.
  • By plotting the data values, and later by following specific steps, it is possible to calculate average velocity.

The approaches mentioned earlier are the primary methods used to find average velocity.

To study about instantaneous velocity

Frequently Asked Questions | FAQs

What is average velocity from acceleration and time?

On an acceleration time graph, the average velocity of a body is calculated by considering two points on the plot.

If the acceleration is variable, there is slight difficulty measuring the average velocity on the acceleration time graph. Still, if the acceleration is constant, Vavg can be found by adding the body’s velocity in the beginning and at the end using a specific formula.

How do you find the average velocity average from acceleration and time?

The average velocity that is usually denoted in Vavg can be given as follows with the usage of acceleration and time.

We are using acceleration that is denoted as a and time as t, with the help of distance and time. We can follow specific steps and derive a formula with the help, we can measure the Vavg of a body; the formula is given below.

S = vi + ½at2

vavg = s/t = vi + ½at2

vavg = vi + ½ (vf – vi)

vavg = (vf – vi)

That is, acceleration multiplied with time equals the total change in velocity.

What is a Velocity-time graph?

Even velocity-time graph is one of the essential graphs in physics.

It is an actual representation of the object’s change in velocity during the motion according to the time taken. The graphs may be of any type depending on the constant and variable aspects. If the velocity is rapid, the graph’s line will not be horizontal to any axis, and vice-versa if there is any variable term, then the graph’s line will be parallel to the axis.

What is an acceleration-time graph?

The acceleration time graph involves acceleration and time respectively on the x and y-axis.

The graph of acceleration v/s time is plotted according to the time taken by an object to move on a linear path. This graph can find the average velocity depending on the constant and variable acceleration. The graph value is represented in the form of y= a(t). The unique feature of this graph is we can find both positive and negative values of velocity and even acceleration.

Also Read:

How To Find Average Velocity: Different Methodologies And Problems

average velocity illustration in circular motion

average velocity is a fundamental concept in physics that allows us to describe the motion of an object over a certain period of time. It provides valuable information about the overall displacement and speed of an object. In this blog post, we will explore various methods and formulas to find average velocity, from basic calculations to advanced concepts in calculus. So, let’s dive in!

average velocity illustration in circular motion

How to Calculate Average Velocity

how to find average velocity
Image by MikeRun – Wikimedia Commons, Wikimedia Commons, Licensed under CC BY-SA 4.0.

A. The Basic Formula to Find Average Velocity

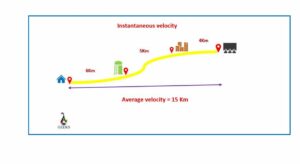
To begin with, let’s start with the most basic formula to find average velocity. average velocity is defined as the displacement divided by the time taken. Mathematically, it can be expressed as:

text{Average Velocity} = frac{text{Displacement}}{text{Time Taken}}

The displacement refers to the change in position of an object, while the time taken represents the duration of the motion. For example, if an object moves from point A to point B with a displacement of 10 meters and takes 5 seconds, the average velocity would be 2 meters per second.

B. How to Determine Average Velocity with Distance and Time

Another way to calculate average velocity is by using distance and time instead of displacement. The formula remains the same, but this time, average velocity is equal to the total distance traveled divided by the time taken. Mathematically, it can be represented as:

text{Average Velocity} = frac{text{Total Distance}}{text{Time Taken}}

For instance, if a car travels a total distance of 100 kilometers in 2 hours, the average velocity would be 50 kilometers per hour.

C. How to Measure Average Velocity with Initial and Final Speeds

In some cases, you may be given the initial and final speeds of an object instead of the displacement or distance. Don’t worry, you can still find the average velocity using these values. The formula for average velocity in such scenarios is:

text{Average Velocity} = frac{text{Initial Speed} + text{Final Speed}}{2}

Let’s say a runner starts a race with an initial speed of 5 meters per second and finishes with a final speed of 10 meters per second. To find the average velocity, simply add the initial and final speeds and divide by 2. In this case, the average velocity would be 7.5 meters per second.

D. How to Calculate Average Velocity with Two Speeds

Sometimes, you might need to find the average velocity when an object travels at two different speeds during its motion. In this case, you need to find the total distance traveled and the total time taken. Once you have these values, you can use the formula we discussed earlier:

text{Average Velocity} = frac{text{Total Distance}}{text{Total Time Taken}}

For example, let’s say a cyclist covers a distance of 20 kilometers at a speed of 10 kilometers per hour and then covers another 40 kilometers at a speed of 20 kilometers per hour. The total distance traveled would be 60 kilometers, and the total time taken would be 3 hours. Therefore, the average velocity would be 20 kilometers per hour.

Advanced Concepts in Finding Average Velocity

A. How to Find Average Velocity over an Interval

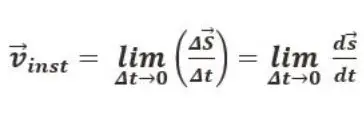
In calculus, we can find the average velocity over an interval by taking the derivative of the position function. The derivative gives us the instantaneous velocity at a particular point. To find the average velocity, we calculate the difference in position between the endpoints of the interval and divide it by the difference in time. Mathematically, it can be expressed as:

text{Average Velocity} = frac{text{Change in Position}}{text{Change in Time}}

B. How to Determine Average Velocity Given Position Function

In calculus, when we have the position function of an object, we can find the average velocity by taking the derivative of the position function with respect to time. The derivative represents the rate of change of position, which gives us the velocity. To find the average velocity, we integrate the velocity function over the given time interval and divide it by the length of the interval. Mathematically, it can be represented as:

text{Average Velocity} = frac{1}{text{Length of Interval}} int_{t_1}^{t_2} v(t) , dt

Here, v(t) represents the velocity function, and t_1 and t_2 are the initial and final times respectively.

C. How to Calculate Average Velocity in Circular Motion

average velocity in circular motion

In circular motion, the average velocity is determined by dividing the total displacement by the total time taken. The displacement is the shortest distance between the initial and final positions in the circular path. However, since the object moves in a curved path, the displacement is not equal to the distance traveled. Therefore, the average velocity in circular motion can be given by:

text{Average Velocity} = frac{text{Total Displacement}}{text{Total Time Taken}}

D. How to Measure Average Velocity with Constant Acceleration

When an object experiences constant acceleration, we can find the average velocity by using a specific formula. This formula relates the initial velocity, final velocity, and time taken. Mathematically, it can be expressed as:

text{Average Velocity} = frac{text{Initial Velocity} + text{Final Velocity}}{2}

This formula holds true when the acceleration remains constant throughout the motion.

Average Velocity in Different Scenarios

A. How to Find Average Velocity from Acceleration and Time

If you know the acceleration and time, you can calculate the average velocity using a simple formula. The formula is derived from the equation for uniformly accelerated motion. It can be represented as:

text{Average Velocity} = text{Initial Velocity} + text{Acceleration} times text{Time}

This formula is particularly useful when you have the initial velocity, acceleration, and time, but not the final velocity.

B. How to Determine Average Velocity between Two Time Intervals

To find the average velocity between two time intervals, you need to calculate the total displacement and the total time taken. The formula for average velocity remains the same:

text{Average Velocity} = frac{text{Total Displacement}}{text{Total Time Taken}}

C. How to Calculate Average Velocity between Two Points

If you have the coordinates of two points in a straight line, you can find the average velocity by dividing the displacement by the time taken. Simply subtract the initial position from the final position to find the displacement, and divide it by the time taken. Mathematically, it can be represented as:

text{Average Velocity} = frac{text{Displacement}}{text{Time Taken}}

D. How to Measure Average Velocity from a Table

In some cases, you may be given a table of values representing the position of an object at different points in time. To find the average velocity, you can use the data from the table to calculate the total displacement and the total time taken. Then, use the formula for average velocity:

text{Average Velocity} = frac{text{Total Displacement}}{text{Total Time Taken}}

Average Velocity in Calculus

how to find average velocity
Image by GregorDS – Wikimedia Commons, Wikimedia Commons, Licensed under CC BY-SA 4.0.
how to find average velocity
Image by Yomomo – Wikimedia Commons, Wikimedia Commons, Licensed under CC BY-SA 4.0.

A. How to Find Average Velocity over an Interval in Calculus

In calculus, finding the average velocity over an interval involves taking the derivative of the position function with respect to time. The derivative gives us the instantaneous velocity at any given point. To find the average velocity, we calculate the difference in position between the endpoints of the interval and divide it by the difference in time. Mathematically, it can be expressed as:

text{Average Velocity} = frac{text{Change in Position}}{text{Change in Time}}

B. How to Determine Average Velocity of a Particle in Calculus

When dealing with particle motion in calculus, we can find the average velocity of the particle by integrating the velocity function over a certain time interval and dividing it by the length of the interval. Mathematically, it can be represented as:

text{Average Velocity} = frac{1}{text{Length of Interval}} int_{t_1}^{t_2} v(t) , dt

Here,v(t) represents the velocity function, and t_1 and t_2 are the initial and final times respectively.

C. How to Calculate Average Velocity when Acceleration is Not Constant

In calculus, when the acceleration is not constant, finding the average velocity becomes more complex. In this case, we need to find the displacement function by integrating the velocity function. Then, we can find the average velocity by dividing the displacement over a certain time interval by the length of the interval. Mathematically, it can be expressed as:

text{Average Velocity} = frac{1}{text{Length of Interval}} int_{t_1}^{t_2} v(t) , dt

Here, v(t) represents the velocity function, and t_1 and t_2 are the initial and final times respectively.

D. How to Measure Average Velocity when Acceleration is Constant

When the acceleration is constant in calculus, finding the average velocity becomes relatively simpler. In this case, we can use the formula:

text{Average Velocity} = frac{text{Initial Velocity} + text{Final Velocity}}{2}

This formula holds true when the acceleration remains constant throughout the motion.

How is average velocity related to finding the slope of a graph?

The concept of finding the slope of a graph is closely related to understanding average velocity. Average velocity is a measure of how fast an object is moving in a particular direction over a given period of time. When calculating the average velocity, we can use the same mathematical technique as finding the slope of a graph. By determining the change in position (distance traveled) over the change in time, we can find the average velocity. To further explore this relationship, you can read more about Finding the slope of a graph.

Additional Information on Average Velocity

A. Does Average Velocity Have Direction?

Yes, average velocity does have direction. It not only tells us the speed at which an object is moving but also the direction in which it is moving. For example, if an object is moving to the right, the average velocity would be positive. If it is moving to the left, the average velocity would be negative.
B. How to Find Average Velocity Vector

To find the average velocity vector, we need to consider both the magnitude and direction of the average velocity. The magnitude is found using the formulas we discussed earlier, while the direction can be determined by considering the signs of the displacement or the initial and final speeds.

C. What Equation to Use to Find Average Velocity

The equation to find average velocity depends on the given information and the context of the problem. You can refer to the formulas and explanations provided earlier in this blog post to determine the appropriate equation based on the scenario.

And there you have it! A comprehensive guide on how to find average velocity, from basic calculations to advanced concepts in calculus. Remember to apply the appropriate formulas and methods based on the given information, and you’ll be able to calculate average velocity with ease. Happy calculating!

Also Read:

Find Coefficient Of Friction Given Velocity And Distance: Detailed Analysis and Problems

velocity and distance 300x191 1

To find the coefficient of friction, the normal reaction and the friction involved in the necessary quantities. But how to find coefficient friction given velocity and distance

The velocity and the distance contribute to the friction evolving between the surfaces. The impact of these two quantities can be resolved. By knowing the velocity and the distance moved by the object, the coefficient of friction can be calculated.

How to find coefficient of friction given velocity and distance moved by the object

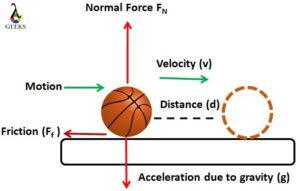
To find the coefficient of friction given velocity and distance, let us consider an object of mass ‘m’ moving with a velocity ‘v’ at a distance ‘d’ from the initial position. The friction force Ff is retards the motion of the object in the direction opposite to the movement. The normal reaction Fn is acting perpendicular to the motion of the object. The motion of the object is influenced by the gravity ’g’, which results in a normal reaction.

Find Coefficient Of Friction Given Velocity And Distance
To find coefficient of friction given velocity and distance

We can find the coefficient friction given velocity and distance by two methods. Let us it discuss one by one.

Method 1: considering the work done by the friction

The work done by the friction on the object is given by

W = PE+ KE+ Eloss 

Since the object is moving, the stored potential energy is zero, and the energy loss is negligible during the process. So the work done can be rewritten as

CodeCogsEqn 24

Where m is the mass of the object and v is the velocity at which the object is moving.

This work done is equal to the friction force times the distance, so we can write the equation as

CodeCogsEqn 27
CodeCogsEqn 29

The friction force acting on the object is given by

Ff = µFn

Where µ is the coefficient of friction and Fn is the normal reaction.

The normal reaction is equal to the net weight of the object given by Fn=mg

So that the friction is given by the equation,

Ff = µmg …..(2)

Since the above two equations of friction are the same, we can equate them

CodeCogsEqn 30

Rearranging the equation we get,

CodeCogsEqn 31

Now consider that initially the object is moving with velocity v0, with the time its velocity changes and finally it is moving with velocity vf covering the distance d, then the coefficient of friction is given by

CodeCogsEqn 33

Method 2: By using the Kinematics

The kinematic equation of motion for given velocity and distance is,

vf2 = v02 + 2ad

Where, vf2 is the final velocity of the moving object.

v02 is the initial velocity of the moving object.

a is the acceleration, and d is the distance travelled by the object.

Here we consider the object is moving with a constant velocity so that the final velocity vf2 become zero. Hence we can modify the equation as

0 = v02 + 2ad

-v02 = 2ad

CodeCogsEqn 34

From Newton’s second law of motion, the relation between the acceleration and the force is given by,

F = m*a

Substituting in the above equation, we get

CodeCogsEqn 35

The force acting on the object cannot have a negative value. We can take the magnitude of the equation as,

CodeCogsEqn 36
CodeCogsEqn 37

Since in this case, we have considered the force acting on the object is friction force so that substituting the formula of the friction, we get the equation as

CodeCogsEqn 38

Generally, we can write the equation as

CodeCogsEqn 39

On rearranging the terms, we get the coefficient of friction as,

CodeCogsEqn 40

It is clear that the coefficient of friction arrived from both methods are the same. Using the above formula, we can find the coefficient of friction given velocity and distance.

Solved Problems On Coefficient Of Friction

An object of mass of 2kg is moving with a velocity of 12ms-2, the friction force acting on the body make the object stop at a distance of 22m. Find the coefficient of friction and hence calculate the friction force. The acceleration due to gravity g given as 10ms-2.

Solution:

               Given: Mass of the object m = 2kg

                            Velocity v = 13ms-2

                            Distance covered by the object d = 22m

                            Acceleration due to gravity g = 10ms-2

The formula to find coefficient of friction given velocity and distance is

CodeCogsEqn 31

Substituting the values of the given terms in the above equation

CodeCogsEqn 41
CodeCogsEqn 42

µ = 0.38

The formula to calculate friction is

Ff = µmg

Ff = 0.38×10×2

Ff = 7.68N.

Find the coefficient of friction given velocity and distance as 28ms-2 and 34m respectively and hence find the normal reaction and the friction force. (Given: Mass of the object is 4kg and Acceleration due to gravity is 10 ms-2).

Solution:

The velocity is 17ms-2

The distance travelled by the object is34m. 

The coefficient of friction for given velocity and distance is given by the formula

CodeCogsEqn 31

Substituting the values in the expression,

CodeCogsEqn 44
CodeCogsEqn 43

µ = 0.425

The normal reaction is given by FN = m*g

FN = 4 × 10

FN = 40 N.

The friction force acting on the object is Ff = µ FN

Ff = 0.425 × 40

Ff = 17 N.

A body of mass of 12kg is moving on a rough surface. It travelled a distance of 72m, and then its motion is hindered by the friction force of 45N. Calculate the coefficient of friction and hence find the velocity at which the body is moving.

Solution:

Mass of the body m = 12kg

The distance traveled by the body d = 72m

The friction force acting on the body Ff = 45N

Acceleration due to gravity g = 9.8 ms-2.

The coefficient of friction for given friction is given by the formula

CodeCogsEqn 45

Substituting values in the above equation

CodeCogsEqn 46
CodeCogsEqn 47

µ = 0.382

To find the velocity, let us consider the equation

CodeCogsEqn 31

On rearranging the terms, we get the equation for the velocity as,

v2 = 2µgd

Substituting the values

v2 = 2× 0.382× 9.8× 72

v2 = 539.07

Taking the square root, we get

CodeCogsEqn 49

The velocity at which the body is moving is v = 23.21 ms-2.

The coefficient of friction is 0.46, and the mass of the object is 7kg. The object is moving with a constant velocity of 46 ms-2. Calculate the distance travelled by the object after friction retards the object’s motion.

Solution:

The coefficient of friction µ = 0.46

Mass of the object m = 7kg

Velocity of the object v = 16 ms-2

Acceleration due to gravity g = 9.8 ms-2

CodeCogsEqn 31

Rearranging the expression

CodeCogsEqn 50
CodeCogsEqn 51
CodeCogsEqn 52

d = 28.39m.

The object covers a distance of 28.39m before it stops its motion.

A block of mass 5kg is moving with the initial velocity of 12ms-2. After a time t, its velocity is increased by 19ms-2 and covers a distance of 33m, then its motion is stopped by the friction. Find the coefficient of friction given velocity and distance and hence find the friction required to stop the motion of the object.

Solution:

The initial velocity of the object v0 = 12 ms-2

The final velocity of the object vf = 19ms-2

The distance covered by the object d = 33m

Mass of the object m = 5kg

The coefficient of friction for given initial and final velocity is given by the expression

CodeCogsEqn 33
CodeCogsEqn 53
CodeCogsEqn 55

µ = 0.33

The friction required to stop the motion of the object is

Ff = µmg

Ff = 0.33× 5× 9.8

Ff = 16.17 N.

Also Read:

How To Find Distance In Velocity Time Graph: Exhaustive Insights And Facts

Discover the method to calculate distance using a velocity-time graph, an essential tool for visualizing the relationship between an object’s velocity and time. This guide breaks down the process and makes it easy to understand how to interpret these graphs for practical physics applications.

By plotting the velocity-time graph of a complete journey of a moving body, we can also find the distance covered. The distance is determined by calculating the area under the graph, both positive and negative sides. 

The velocity and time graph shows the speed of the object at a particular time. While plotting this graph, we take the value of velocity on the vertical axis that is the y-axis. Similarly, the time is taken on the x-axis, the vertical one. Just like the position-time graph, we can find the slope of the velocity-time graph. The slope is calculated by the formula: 

CodeCogsEqn 25

Here,

CodeCogsEqn 1 2

Since we take time on the x-axis then: 

CodeCogsEqn 2 2

Similarly,

CodeCogsEqn 3 2

We take velocity on the y-axis so;

CodeCogsEqn 4 2

Therefore the formula for velocity-time graph becomes;

Slope=(v2-v1)/(t2-t1)

The unit for velocity is meter per second (m/s), and that of time is second (s). 

Therefore if we put the unit in the above slope formula, we get. 

slope=ms-2

We know that the unit is that of the acceleration. So the slope of the velocity and time graph gives the value of the acceleration of the object. 

If the steepness of the slope is in a downward direction, then its value would be negative. Hence the acceleration would also be negative. The negative acceleration means that the velocity is decreasing. Hence the downward slope would mean that the body is decelerating. The gentle rise of the slope of a graph means that its value is positive, so the body accelerates. 

How to find distance in velocity time graph

When the slope of the graph is zero, that is, it is parallel to the time axis. In this circumstance, the acceleration becomes zero. And hence it means that the velocity remains constant throughout the journey. 

Screenshot 2021 11 26 215323

Now let us know how to find the distance in velocity time graph. The area of the graph gives the value of the entire distance that an object covers. To understand it step by step, check below.

The above graph shows the velocity and time relation of a moving car. We can clearly see that originally the body was accelerating, then the velocity became constant, and after that, it started decelerating. To find the distance divide the graph into triangles and trapezium, as shown above. Now the last thing is to find the values of figures and add them. 

The area of triangle 1 =

(1/2)*base*height

(1/2)*2*8

The area of triangle 1 = 8

The area of trapezium 2 =

(1/2)*(a+b)*height

(1/2)*(8+12)*3

The area of trapezium = 30

The area of triangle 3

=(1/2)*base*height

=(1/2)*3*12

The area of triangle 3 = 18

To find the area of the graph, add all three areas:

Distance covered = Area 1 + Area 2 + Area 3

Distance covered = 8 + 30 + 18

Distance covered = 56

This is the total area that the car covered. So the distance in the velocity time graph is calculated by finding the area of the graph.  

How to find distance from a curved velocity time graph

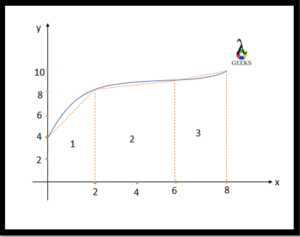
For a curved velocity time graph, the distance is traveled by finding the area under the graph. Take the above graph; the slope here is not straight. It is curved; that is, it keeps increasing or decreasing. 

how to find distance in velocity time graph

The very first step is to divide the graph roughly into triangles and trapeziums. A minute up and down can be ignored. In this way, we get to know the correct value of the distance traveled by the body. After dividing the graph into triangles and trapeziums, the next is to find the area of each figure. Therefore the area of the triangles and trapeziums are calculated as:

Area 1 = (1/2)*(4+8)*2

Area = 12

Area 2 =(1/2)*(8+9)*4

Area 2 = 34

Area 3 =(1/2)*(9+10)*2

Area 3 = 19

The last step is to add the areas of the rough figure and get the value of distance traveled. 

Distance covered = Area 1+ Area 2+ Area 3

Distance covered = 12 + 34 + 19

Distance covered = 65

Therefore the distance for the above graph is 65

Frequently Asked Question (FAQs)

What is the velocity time graph?

The graph showing a relation between velocity and time of a moving body is known as the velocity time graph. 

In the velocity time graph, we plot the velocities of the object on the y-axis and the time taken on the x-axis. It tells the speed of the moving particle at a particular time. The rising slope says that the velocity is increasing, and downward steepness says that velocity is decreasing. 

What does the slope of the velocity time graph depict?

The steepness of a line of the graph is its slope. It provides the value of some physical quantity. 

In the velocity time graph, by finding the slope, we get the value of the acceleration of the body. If the slope is positive, that means the body is accelerating. If the slope is downwards, it infers that velocity keeps decreasing with time. 

How to show that the velocity is constant by a velocity time graph?

With a velocity time graph, we can show all kinds of velocity, increasing, decreasing, changing, or even constant ones too. 

When the slope is zero, that means that it is parallel to the horizontal x-axis; that is, the time means that the velocity is constant. This shows that at different times the value of the velocity remains the same; hence it is constant. 

How to find distance in velocity time graph?

With the help of a velocity time graph, we can easily find the total distance covered by an object during the whole journey. 

The area of the velocity time graph is used to find the exact distance traveled by the object. To find the area, we divide the graph into triangles and trapeziums and then find their area and add them. And hence the magnitude of distance is known. 

Can we find displacement from the velocity time graph?

No, the velocity time graph does not provide information about the displacement.  

By finding the area under the velocity and time graph, we get the distance traveled and not the displacement. We can not find the displacement from the velocity-time graph. It is because, for displacement, we need to know the initial and final positions that are not provided by this graph. 

Also Read:

Is instantaneous velocity greater than the average velocity

Z2

Instantaneous and average velocity differs in the rate of calculation. In this post, we will know, is instantaneous velocity greater than the average velocity.

The instantaneous velocity can be greater, equal or lesser than average velocity depending on time interval. Average velocity is measured as the total sum of displacement divided by the whole time. In contrast, the instantaneous velocity is the measurement of velocity at any specific period.

z21
Image: Instantaneous velocity vs average velocity

Let us study in-depth the various aspects of instantaneous velocity vs average velocity.

Instantaneous velocity vs average velocity

Both the quantities are different to some extent. Now, let’s study about the expected differences of instantaneous velocity vs average velocity as shown below,

 Parameters    Instantaneous Velocity           Average Velocity
                Definition Instantaneous velocity is the measurement of velocity at any value of time when the particle moves. It can also be given as the limit of . Average velocity is the sum of the total calculation of the rate of change of velocity in the whole motion in consideration of time.
                Formula Z2 Z3             
                Usage of symbols Z4 = it refers to the derivative of the position of the particle in consideration with time interval.
Z5= sf – si
z7= tf – ti
Sf = Final position
Si = Initial position
tf = Final point of time interval
ti = Initial point of time interval
Nature        Vector quantity         Vector quantity
                Relation   At a given point of the interval, and is considered as the limit of average velocity. After the completion of motion in any given time interval, it is measured.
                Components Magnitude as well as direction Magnitude as well as direction
Example If we consider a bicycle race, can calculate the instantaneous velocity at every turning point. In the same example of instantaneous velocity, one can measure the average velocity after completing the motion.

These are some of the primary vital points of instantaneous velocity vs average velocity.

Comparison of instantaneous velocity and average velocity

Even though both the quantities are calculated by considering different values of time intervals, there are some similarities.

  • The average and instantaneous velocities are obtained through calculating the slope of mathematical quantities secant and tangents.
  • They are vector quantities and have a dimension of L/T.
  • During constant motion, both the quantities will have the same value.
  • Vinst is measured between any two points of a particle in action, while the path of Vavg may be of any form [linear, curved].

These are some similarities between instantaneous velocity and average velocity.

Is instantaneous velocity greater than average velocity

 can discuss the relationship between instantaneous and average velocity in time intervals.

Will be able to calculate the Vinst at any point of the total time interval when the body travels, and it is the limit of the average rate. In comparison, can measure average velocity after the completion of motion. Can understand the relationship clearly by knowing the distance-time graph.

The instantaneous velocity is a part of average velocity.

Graphs of instantaneous velocity and average velocity

 It is possible to show both Vinst and Vavg in a displacement-time graph.

Instantaneous velocity is the measure of velocity using the slope of tangents.

Instantaneous velocity vs average velocity
Image: Instantaneous velocity
  • Average velocity is the measure of velocity using the slope of secants.
Instantaneous velocity vs average velocity
Image: Average velocity

It is the primary comparison of graphs of Vinst  and Vavg

Formulas to calculate instantaneous velocity and average velocity

There are two different formulas given according to measure the value of instantaneous velocity and average velocity.

  • Instantaneous velocity

Z2 1

where,

ds/dt = it refers to the derivative of the position of a particle in consideration with time interval.

Z5= sf – si
z7= tf – ti

  • Average velocity

Z3

where,

Sf = Final position

Si = Initial position

tf = Final point of time interval

ti = Initial point of time interval

The above formulas can even be obtained in different forms according to necessity.

Problems on instantaneous velocity and average velocity

Let us understand the concept of instantaneous velocity vs average velocity by solving some primary problems.

Problem 1

Find instantaneous velocity at t = 5, given the displacement equation as S = 4t3 – 2t2 + t + 9. 

Solution:

The given equation of motion is

S(t) = 4t3 – 2t2 + t + 9. 

Vinst = z8= z9 = [ (3 x 4 t2) – (2 x 2t) + 1]

Vinst = 12t2 – 4t + 1

Instantaneous velocity at t = 5s

Vinst = 12(5)2 – 4(5) + 1

Vinst = 300 – 20 + 1

Vinst = 281 meters/second

The instantaneous velocity is 281 meters/second

Problem 2

A toy is thrown from a height to fall under the influence of gravity. The equation of motion is given by s(t) = 7.2 t2. Find the instantaneous velocity of the body at the eight-second after release?

quoi 10430 1280 4
Image Credit:
Pixabay free images

Solution:

The equation of motion is

s(t) = 7.2 t2

To find Instantaneous velocity at t = 8s

Vinst = z10

Vinst = [7.2 x 2 x t]t=8

Vinst = [7.2 x 2 x 8]

Vinst  = 115.2 m/s

The instantaneous velocity is 115.2 meters/second

Problem 3

The motion of the truck is given by the function s = 5t2 + 11t + 6. and it moves at 30 km off the street in 6 minutes and again comes back and moves 13km back the street in 4reverses and drives 12 km back down the road in 4 minutes. Calculate instantaneous at t=2s and average velocity?

instantaneous velocity vs average velocity
Image Credit:
Pixabay free images

Solution:

To calculate Instantaneous velocity

Given function is s = 5t+ 11t + 6.

Differentiating the given function with respect to t, we get

Vinst = ds/dt = z11

Vinst = v(t)= 10t + 11

For time t = 2s, the Instantaneous Velocity is articulated as,

V(2) = 10(2) + 11

V(2) = 31 m/s.

To find the Average velocity, the formula is

V = Displacement/time

V = (30 – 13)/ (6+4)

V = 17/10

V = 1.7 kilometre / minute

The instantaneous velocity is 31m/s, and the average velocity is 1.7 Km/min.

In this way, we got to know the various problem of instantaneous velocity vs average velocity.

Frequently asked Questions | FAQs

Mention the fundamental difference between instantaneous velocity and average velocity?

The primary difference between average velocity and instantaneous velocity lies in the calculation of position.

In general, we know that average velocity is the total change in the position of an object in consideration of time during the motion. In comparison, the instantaneous velocity is the calculation of instant change in the displacement related to time within the movement.

How can we find instantaneous velocity from average velocity?

There is some meaningful connection between average and instantaneous velocity.

When we try to measure Vinst of a particle during this, If we notice carefully, Vinst  will be taken as the limit of Vavg as time tends towards zero. It can be even written in the form of derivative of x as given below,

                                                                        v ( t ) = d d t x ( t ) 

Why do we use instantaneous velocity?

Instantaneous velocity acts according to its definition, and it helps in measuring tiny values of velocity.

Instantaneous velocity helps in calculating very tiny values of velocity at any point of motion of a body. It sometimes helps to note down the velocity of an object in any race at a particular time.

Can variation in instantaneous velocity affect the value of average velocity?

The variation in instantaneous velocity may or may not lead to any change in the average velocity.

We know from the definitions of both instantaneous and average velocity that they are used to measure the velocity of a body in any motion according to specific time intervals. Since the average is the total calculation and instantaneous is the calculation at a point, there may or may not be any changes.

Which scale of quantity is more critical among average velocity and instantaneous velocity?

Both the quantities have equal importance when it comes to the measurement of velocity.

If we consider an example of a race, then with the help of average velocity, we can calculate the total value of the velocity of motion of the car. Similarly, with the help of instantaneous velocity, we can know the velocity at any particular time.

On what condition do instantaneous velocity and average velocity become equal?

At some specific conditions, instantaneous velocity becomes equal to average velocity, and it is given below.

We know that the derivative of velocity with time leads to acceleration, and it plays a vital role in measuring both types of velocities. When the acceleration of the body is equal to zero, automatically, both the velocities will become equal since there is no chance of change in velocity.

Also Read: