Cypress Promise and Cypress Asynchronous: 13 Important Facts

411 4116389 cypress io logo7639 cypress io logo 300x93 1

In our previous article, we saw the configurations in Cypress and various options that can be configured in JSON files. This article will understand Cypress Promise and Cypress Asynchronous behaviour with hands-on implementation and examples in our project. We will also discuss how to incorporate awaits in our asynchronous code and some essential functions like wrap() and task(). Let’s get started!

Cypress Promise and Cypress Asynchronous:

Cypress Promise and Cypress Asynchronous nature are some of the essential concepts. Like any other Javascript framework, Cypress also revolves around Asynchronous and Promises. Cypress handles all the asynchronous behaviour internally, and it’s hidden from the user. We will use .then() to handle promises manually in our code. There are external packages like Cypress-promise in npm where we can manipulate the Cypress asynchronous behaviour. We will discuss each of these topics in detail.

Cypress Promise and Cypress Asynchronous
Cypress Promise

Table of Contents

Cypress Asynchronous

As we know, Cypress is based on Node JS. Any framework that is written build from Node.js is asynchronous. Before understanding the asynchronous behavior of Cypress, we should know the difference between synchronous and asynchronous nature.

Synchronous nature

In a synchronous program, during an execution of a code, only if the first line is executed successfully, the second line will get executed. It waits until the first line gets executed. It runs sequentially.

Asynchronous nature

The code executes simultaneously, waits for each step to get executed without bothering the previous command’s state. Though we have sequentially written our code, asynchronous code gets executed without waiting for any step to complete and is completely independent of the previous command/code.

What is asynchronous in Cypress?

All Cypress commands are asynchronous in nature. Cypress has a wrapper that understands the sequential code we write, enqueues them in the wrapper, and runs later when we execute the code. So, Cypress does all our work that is related to async nature and promises!

Let’s understand an example for it.

 it('click on the technology option to navigate to the technology URL', function () {
        cy.visit('https://lambdageeks.com/') // No command is executed
        //click on the technology option
        cy.get('.fl-node-5f05604c3188e > .fl-col-content > .fl-module > .fl-module-content > .fl-photo > .fl-photo-content > a > .fl-photo-img') // Nothing is executed here too
            .click() // Nothing happens yet
        cy.url() // No commands executed here too
            .should('include', '/technology') // No, nothing.
    });
        // Now, all the test functions have completed executing
        // Cypress had queued all the commands, and now they will run in sequence

That was pretty simple and fun. We now understood how Cypress Asynchronous commands work. Let us dive deeper into where we are trying to mix sync and async code.

Mixing Cypress Synchronous and Asynchronous commands

As we saw, Cypress commands are asynchronous. When injecting any synchronous code, Cypress does not wait for the sync code to get executed; hence the sync commands execute first even without waiting for any previous Cypress commands. Let us look into a short example to understand better.

 it('click on the technology option to navigate to the technology URL', function () {
        cy.visit('https://lambdageeks.com/') 
        //click on the technology option
        cy.get('.fl-node-5f05604c3188e > .fl-col-content > .fl-module > .fl-module-content > .fl-photo > .fl-photo-content > a > .fl-photo-img')
            .click() 
        cy.url() // No commands executed here too
            .should('include', '/technology') // No, nothing.
        console.log("This is to check the log")  // Log to check the async behaviour
    });
});
log screenshot 1
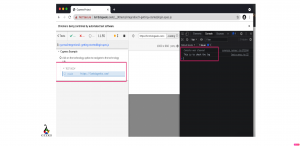
Synchronous execution of the log command

The log is added at the end of the code, which is a sync command. When we run the test, you can see that the log has been printed even before the page is loaded. This way, Cypress does not wait for the synchronous command and executes it even before executing its commands.

If we want them to execute as expected, then we should wrap it inside the .then() function. Let us understand with an example.

it('click on the technology option to navigate to the technology URL', function () {
        cy.visit('https://lambdageeks.com/') 
        //click on the technology option
        cy.get('.fl-node-5f05604c3188e > .fl-col-content > .fl-module > .fl-module-content > .fl-photo > .fl-photo-content > a > .fl-photo-img')
            .click() 
        cy.url() // No commands executed here too
            .should('include', '/technology') // No, nothing.
        .then(() => {
            console.log("This is to check the log")  // Log to check the async behaviour
        });
    });
after sync log
Async execution with .then() command

What is Cypress Promise?

As we saw above, Cypress enqueues all the commands before execution. To rephrase in detail, we can say that Cypress adds promises(commands) into a chain of promises. Cypress sums all the commands as a promise in a chain.

To understand Promises, compare them with a real-life scenario. The explanation defines the Promise in asynchronous nature too. If someone promises you, they either reject or fulfill the statement they made. Likewise, in asynchronous, promises either reject or fulfill the code we wrap in a promise.

However, Cypress takes care of all the promises, and it is unnecessary to manipulate them with our custom code. As a Javascript programmers, we get curious about using awaits in our commands. Cypress APIs are completely different than we are used to generally. We will look into this a later part of this tutorial in depth.

States of Cypress Promises

Promises have three different states based on the Cypress commands. They are

  • Resolved – Occurs when the step/ command gets successfully executed.
  • Pending – State where the execution has begun, but the result is uncertain.
  • Rejection – Occurs when the step has failed.

As a Javascript programmer, we tend to write promises in our code and return them. For example,

//This code is only for demonstration
describe('Cypress Example ', function () {
    it('click on the technology option to navigate to the technology URL', function () {
        cy.visit('https://lambdageeks.com/')
        //click on the technology option
        cy.get('.fl-node-5f05604c3188e > .fl-col-content > .fl-module > .fl-module-content > .fl-photo > .fl-photo-content > a > .fl-photo-img')
            .then(() => {
                return cy.click();
            })
        cy.url() 
            .then(() => {
                return cy.should('include', '/technology') 
            })
    });
});

Here, we are returning promises to each of the commands. This is not required in Cypress. Fortunately, Cypress takes care of all the promises internally,and we don’t need to add promises in each step. Cypress has the retry-ability option, where it retries for a particular amount of time for executing the command. We will see an example of a code without including promises manually.

    it('click on the technology option to navigate to the technology URL', function () {
        cy.visit('https://lambdageeks.com/')
        //click on the technology option
        cy.get('.fl-node-5f05604c3188e > .fl-col-content > .fl-module > .fl-module-content > .fl-photo > .fl-photo-content > a > .fl-photo-img')
            .click()
        cy.url()
            .should('include', '/technology')
    });
});
SAMPLE
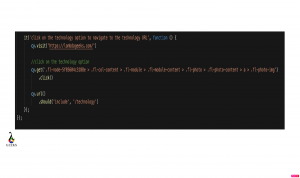
Cypress commands with promises handled internally

The above code is not clumsy and is easy to read and understand. Cypress handles all the promise work, and it is hidden from the user. So we don’t have to worry about handling or returning the promises anywhere!

How do you use await in Cypress?

As discussed above, Cypress has its way of handling asynchronous code by creating a command queue and running them in sequence. Adding awaits to the commands will not work as expected. Since Cypress is handling everything internally, I would recommend not adding awaits to the code.

If you need to add awaits, you can use a third-party library like Cypress-promise that changes how Cypress works. This library will let you use promises in the commands, and use await in the code

Let us understand the ways to use awaits and how not to use them.

You should not use awaits like this

//Do not use await this way
describe('Visit the page', () => {
  (async () => {
     cy.visit('https://lambdageeks.com/')
     await cy.url().should('include', '/technology');
  })()
})

Instead, you can use like this

describe('Visit the page', () => {
  cy.visit('https://lambdageeks.com/').then(async () => await cy.url().should('include', '/technology') ())
})

This will work for any Cypress commands.

Cypress Wrap

wrap() is a function in Cypress that yields any object that is passed as an argument.

Syntax

cy.wrap(subject)
cy.wrap(subject, options)

Let us look into an example of how to access wrap() in our code.

const getName = () => {
  return 'Horse'
}
cy.wrap({ name: getName }).invoke('name').should('eq', 'Horse') // true

In the example, we are wrapping the getName and then invoke the name for it.

Cypress Wrap Promise

We can wrap the promises that are returned by the code. Commands will wait for the promise to resolve before accessing the yielded value and. then proceed for the next command or assertion.

const customPromise = new Promise((resolve, reject) => {
  // we use setTimeout() function to access async code.
  setTimeout(() => {
    resolve({
      type: 'success',
      message: 'Apples and Oranges',
    })
  }, 2500)
})
it('should wait for promises to resolve', () => {
  cy.wrap(customPromise).its('message').should('eq', 'Apples and Oranges')
});

When the argument in cy.wrap() is a promise, it will wait for the promise to resolve. If the promise is rejected, then the test will fail.

Cypress-promise npm

If we want to manipulate the promises of Cypress, then we can additionally use a library or package called Cypress-promise and incorporate it in our code. This package will allow you to convert a Cypress command into a promise and allows you to await or async in the code. However, these conditions will not work before or beforeEach the blocks. Initially, we should install the package in our project by passing the following command in the terminal.

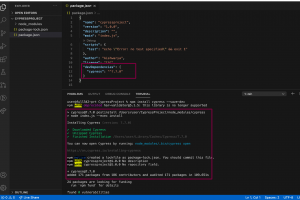
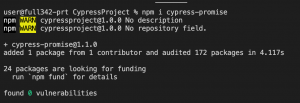
npm i cypress-promise

Once installed, the terminal will look something like this.
Screenshot 2021 08 11 at 9.43.42 PM
Cypress-promise install

After installation, we should import the library into our test file.

import promisify from 'cypress-promise'

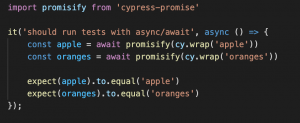
With this library, you can create and override the native Cypress promise and use awaits and async in the code. You should access the promise with the promisify keyword. Let us look into an example for the same.

import promisify from 'cypress-promise'
it('should run tests with async/await', async () => {
    const apple = await promisify(cy.wrap('apple'))
    const oranges = await promisify(cy.wrap('oranges'))
    expect(apple).to.equal('apple')
    expect(oranges).to.equal('oranges')
});
Screenshot 2021 08 11 at 9.49.02 PM
Promisify in Cypress-promise

This was very simple and fun to learn! This way, you can assign asynchronous code in Cypress.

Cypress Async Task

task() is a function in Cypress that runs the code in Node. This command allows you to switch from browser to node and execute commands in the node before returning the result to the code.

Syntax

cy.task(event)
cy.task(event, arg)
cy.task(event, arg, options)

task() returns either a value or promise. task() will fail if the promise is returned as undefined. This way, it helps the user capture typos where the event is not handled in some scenarios. If you do not require to return any value, then pass null value.

Frequently Asked Questions

Is Cypress Synchronous or Asynchronous?

Cypress is Asynchronous by returning the queued commands instead of waiting for the completion of execution of the commands. Though it is asynchronous, it still runs all the test steps sequentially. Cypress Engine handles all this behavior.

Is it possible to catch the promise chain in Cypress?

Cypress is designed in a way that we will not be able to catch the promises. These commands are not exactly Promises, but it looks like a promise. This way, we cannot add explicit handlers like catch.

What is Cypress Json: 11 Facts You Should Know

cypress logo 1 300x157 1

We will discuss the JSON structure, examples, and detailed hands-on experience to write JSON in our code. But, first, let’s dive into our article!

What is Cypress Json: Example, Schema, Detailed Hands-On Analysis

In our previous article, we discussed variables and aliases and how to write our first test case. Now, we will discuss Cypress JSON and how to incorporate it into our code.

cypress json

Table of Contents

Cypress JSON File

As we saw earlier, the first time we open our Cypress Test Runner, it creates a cypress.json file. This file is used to pass any configuration values we require. So first, we will look into the options that we can pass in our cypress.json file.

Default JSON Options

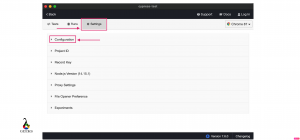
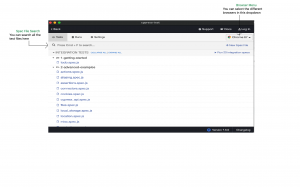
Certain options are set by default in Cypress. However, we can customize them according to our project. To identify the default values set by Cypress, navigate to the Settings folder in our Cypress Test Runner. From there, expand the Configuration option to view the default options set by Cypress.

config settings
Cypress JSON File

The options are the default configurations provided by Cypress.

{
animationDistanceThreshold:5
baseUrl:null
blockHosts:null
browsers:Chrome, Firefox, Electron
chromeWebSecurity:true
component:{}
componentFolder:"cypress/component"
defaultCommandTimeout:4000
downloadsFolder:"cypress/downloads"
e2e:{}
env:null
execTimeout:60000
experimentalFetchPolyfill:false
experimentalInteractiveRunEvents:false
experimentalSourceRewriting:false
experimentalStudio:false
fileServerFolder:""
firefoxGcInterval:runMode, openMode
fixturesFolder:"cypress/fixtures"
hosts:null
ignoreTestFiles:".hot-update.js" includeShadowDom:false integrationFolder:"cypress/integration" modifyObstructiveCode:true nodeVersion:"default" numTestsKeptInMemory:50 pageLoadTimeout:60000 pluginsFile:"cypress/plugins" port:null projectId:"hpcsem" redirectionLimit:20 reporter:"spec" reporterOptions:null requestTimeout:5000 responseTimeout:30000 retries:runMode, openMode screenshotOnRunFailure:true screenshotsFolder:"cypress/screenshots" scrollBehavior:"top" supportFile:"cypress/support" taskTimeout:60000 testFiles:"/.*"
trashAssetsBeforeRuns:true
userAgent:null
video:true
videoCompression:32
videosFolder:"cypress/videos"
videoUploadOnPasses:true
viewportHeight:660
viewportWidth:1000
waitForAnimations:true
watchForFileChanges:true
}

Options

We can change the default options of Cypress by passing any arguments that are compatible with our project. As the name suggests, cypress.json is a JSON file, so we have to pass our arguments in JSON format. In our VS code, you could see that the cypress.json is empty with no arguments passed to it. Now let us see the different options that we can pass in our JSON file.

Global Options

We can pass the global options to arguments that need to be accessed globally. For example, in the table below, the Options column represents the keyword we will be passing in our JSON file; Default indicates the default value of the particular option set by Cypress, and Description indicates the meaning of the option.

OptionDefaultDescription
baseUrlnullWe can set the URL globally instead of passing in each file. It can be used for cy.visit() or cy.request() commands
clientCertificates[]You can use this option for configuring client certificates on a URL basis
env{}You can pass any environment variables as a value. This option will be useful if we are testing our application in different environments like staging or production.
watchForFileChangestrueThis option checks whether Cypress watches and restarts tests on any file changes are made.
portnullWe can pass the port number on hosting Cypress. A random port is generated, but we can add the port number we require.
numTestsKeptInMemory50This option is the number of test snapshots and commands data that are stored in memory. If there is high memory consumption in the browser during a test run, we can reduce the number.
retries{ "runMode": 0, "openMode": 0 }This option is to specify the number of times to retry a test that is failing. We can configure it separately for cypress run and cypress open.
redirectionLimit20We can configure the limit for the number of times the application can be redirected before an error occurs.
includeShadowDomfalseThe ability to navigate inside the Shadow DOM to interact with elements. By default, it is set to false. If our application has any element requiring shadow root navigation, you can set it to true.

Cypress JSON Timeout

Timeout is one of the most important concepts in any automation framework. Cypress provides a variety of options that helps in handling timeouts in our scripts. First, we will look into the options that we can configure.

OptionDefaultDescription
defaultCommandTimeout4000This option is to wait for the DOM Elements-based commands to load. This is in milliseconds.
requestTimeout5000Time, in milliseconds, to wait until the request of cy.wait() command to go timeout.
responseTimeout30000This timeout is to wait until a response in a series of commands such as  cy.request()cy.wait()cy.fixture()cy.getCookie()
cy.getCookies()cy.setCookie()cy.clearCookie()cy.clearCookies(), and cy.screenshot() commands
taskTimeout60000Timeout, in milliseconds, for the completion for the execution of cy.task() command
execTimeout60000This time in milliseconds is to wait to finish execution of the cy.exec() command,
which is the completion of the system command
pageLoadTimeout60000This timeout waits for page navigation events or commands that interact
with the pages like cy.visit()cy.go()cy.reload()

Cypress Read JSON File

Sometimes, we will require to interact with the folders or files in our project. To interact, we have to set certain options in our cypress.json file to manipulate the files. So, first, let us look into the options available in our folders/ files configuration.

OptionDefaultDescription
downloadsFoldercypress/downloadsThis is the path where the files are downloaded and stored during a test run
fixturesFoldercypress/fixturesThis is the path to the folder that contains the fixture files. We can pass false to disable storing the files.
ignoreTestFiles*.hot-update.jsYou can pass this as a string or array of global patterns to ignore test files for the test run. However, it would be displayed in the test files.
integrationFoldercypress/integrationIntegration test files are stored in this path to the folder.
pluginsFilecypress/plugins/index.jsThis path is where the plugins are stored. You can pass the argument as false to disable this configuration.
screenshotsFoldercypress/screenshotsScreenshots from the execution of cy.screenshot() command and test failure during cypress run are stored in this foldersupportFilecypress/support/index.jsHere the test files that load before the test are stored. You have the option to disable by passing false
testFiles**/*.*Path to the test files that need to be loaded. It is either a string or array of global patterns.
videosFoldercypress/videosFolder path which will store videos during test execution

Screenshots and Video Options

We can configure our snapshots and videos in our cypress.json() file, and Cypress provides us some options to customize our configuration.

OptionDefaultDescription
screenshotOnRunFailuretrueOption to set to either true or false whether Cypress takes a screenshot during test failure when cypress runs. It is set to true by default
trashAssetsBeforeRunstrueThis option is to trash assets in the videosFolder, downloadsFolder and screenshotsFolder before every cypress run
videoCompression32This option is the quality of the video compression measured in the Constant Rate Factor(CRF). By passing false, you can also disable this option. You can pass values from 0 to 51, where the lowest value gives better quality.
videosFoldercypress/videosThe folder where the video of the tests is saved.
videotrueBoolean value to capture the video of the test execution with cypress run.
videoUploadOnPassestrueThis option is to upload the videos to the Dashboard when all the test cases in a spec file are passing.

Viewport and Actionability

You can configure and pass values to change the viewport height and width with the options provided by Cypress. Actionability options can also be configured.

OptionDefaultDescription
viewportHeight660This is to provide the default height for the application in pixels. We can override this command with cy.viewport()
viewportWidth1000Option for the viewport width in pixels for the application. Can be overridden with cy.viewport() command.
animationDistanceThreshold5The threshold value for the distance measured in pixels where an element must exceed considering the time for animating.
waitForAnimationstrueOption to wait for the elements to complete the animation before performing any commands.
scrollBehaviortopThis is a viewport option that must scroll to an element just before performing any commands. Available options are 'center''top''bottom''nearest', or false, wherein false disables the scrolling.

Cypress JSON Example

Earlier, we saw the different configurations we can pass in our cypress.json file. Now, we will look into an example of how to use them in our project.

Overriding default values in the cypress.json file

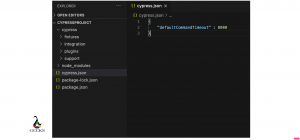
In our VS code, open the cypress.json file. We will override the defaultCommandTimeout command to 8000.

{
    "defaultCommandTimeout" : 8000
}

This is how it looks in our VS code project.

defaulttimeout
cypress.json file

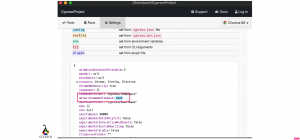
By changing the cypress.json file, it applies to the whole framework. We can verify by navigating to our Cypress settings. It has changed from a default value of 4000 to 8000

settings cypress
Cypress settings default values

Overriding default values via the test script

We can manipulate the default values via our test script too. Instead of passing in the cypress.json file, we will pass it in our test file.


//Changing the timeout from 4 seconds to 8 seconds
Cypress.config('defaultCommandTimeout',8000)

// Test code
cy.get('#username').type(users.email)
cy.get('#pswd').type(users.password)
cy.get('#login_btn').click()

This way, we can override default values in our test file. However, this does not impact any configuration changes on the framework level. Cypress gives priority to the values in cypress.json. Lastly, it takes up the global configurations.

Cypress Fixture JSON Array

Cypress cy.fixture() is a function that loads a fixed set of data in a file. We can use the fixture as a JSON to load any values or array in the JSON file. First, let’s understand how to access the JSON file in our project.

My JSON file has two properties: username and password. My JSON file name is examples.json.

{
"email": "[email protected]",
"password" : test123
}

In our spec file, we will access our fixture with the cy.fixture() command and the concept of aliases.

 cy.fixture('example.json').as('example')

 //Using the alias name to this keyword, So we can use globally  
        const userObj = this.userData
//looping our .json data with a new variable users
         cy.get(userData).each((users) => 
         {
              //Write the test code.
        cy.get('#username').type(users.email)
        cy.get('#pswd').type(users.password)
          }       

Cypress env JSON

Environment variables are used across many projects in organizations. We use environment variables

  • when values are dynamic across different machines
  • when we want to test under different environments such as staging, testing, development, production/live

These cases require us to define environment variables. However, if we set an env variable in one spec file, it is not reflected across other spec files. This is because Cypress runs each spec files independently. This way, we will need to configure env variables separately.

We access our environment files from our Cypress JSON file, i.e., cypress.json file. So we will be required to assign the option in our cypress.json file and used it across our spec file. So let us dive into our example.

We can set our environment variables in our configuration file or cypress.env.json file.

Setting environment variable in cypress.json file

We set the env property by a key-value pair. Any values passed under the keyword env fall under environment variables, and Cypress takes the argument from the env keyword. The syntax looks like the below.

{
  "env": {
    "key1": "value1",
    "key2": "value2"
  }
}

If we want to access the env variable in our spec file, we assign them as mentioned below.

Cypress.env() //returns both the key1,value1 and key2, value2

Cypress.env(key1) //returns only the value1

We will add the env configuration in our project and will access them in our spec file. In our cypress.json file, add the following configuration. We are setting our URL property and assigning them to our URL. Here, URL is the key, and https://lambdageeks.com/technology/ is the value.

{
  "env" : {
      "url" : "https://lambdageeks.com/technology/"
    }
}

As we have declared the configuration, we will access them in our spec file. It looks something like below. As mentioned above, we will be using Cypress.env() method to access the env variable.

// type definitions for Cypress object "cy"
// <reference types="cypress" />

describe('Cypress Example ', function () {

    it('accessing the environment variable', function () {

        //Calling URL from cypress.json
        cy.visit(Cypress.env('url'));

    })
})

Setting environment variable in cypress.env.json file

We can assign our environment variable in our cypress env JSON file. For that, we should create a new file called cypress.env.json at the root of the project. We will not require the env keyword; instead, we can directly access them by passing the key-value pair.

{
    "key1": "value1",
    "key2": "value2"
}

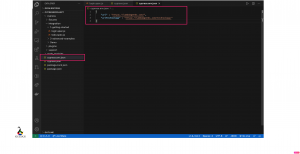
Let us look into how to assign them in our cypress.env.json file.

{
    "url" : "https://lambdageeks.com/",
    "urlTechnology" : "https://lambdageeks.com/technology/"
}
url cypress
Creation of cypress.env.json file

As you see above, we have created a new file, cypress.env.json, and added our URL properties. The way of accessing the environment variables would be the same as mentioned above in the previous section.

Cypress JSON Reporter

As we know, Cypress is built on top of Mocha; any reporters that are built for Mocha can be used. We can configure reporter in our JSON file globally in our cypress.json file.

reporterspecHere, you can specify the reporter that should generate during the cypress run. It is set to spec as the default reporter.
reporterOptionsnullThis is to specify the supported options for the reporter.

The options mentioned above are the configurations set in reporter by default. In addition, the spec reporter is set by default. Thus, in the reporter, we can set any reporter that is compatible with Mocha. reporterOptions is to specify the supported options depending on the reporter we are configuring.

Let’s see how to configure the reporter in our cypress.json file.

Let us consider the multi reporter mochawesome as our reporter. We will first install the reporter and add them to our cypress.json file.

npm install --save-dev mocha cypress-multi-reporters mochawesome

Install the reporter by passing the above command in the command line. Now, in our cypress.json file, add the following property.

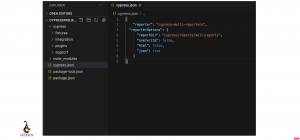
"reporter": "cypress-multi-reporters",
  "reporterOptions": {
      "reportDir": "cypress/reports/multireports",
      "overwrite": false,
      "html": false,
      "json": true
    }

We will understand each of the properties in detail.

reporter: The name of the reporter which we are configuring in our project

reportDir: The directory where we are going to output our results.

overwrite: This flag asks for overwriting the previous reports.

html: Generates the report on the completion of the test.

json: Whether to generate a JSON file on test completion.

cypress.json file
Cypress reporter in the cypress JSON file

Cypress package-lock.json

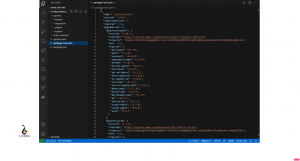
The package-lock.json file is created automatically for any operations when npm modifies the node modules or the package.json file. When we add any options or install any new dependencies to our Cypress package JSON file, then Cypress package-lock.json gets updated automatically.

Cypess package.lock JSON file traces every package and its version so that the installs are maintained and updated on every npm install globally. So in our Cypress package JSON file, when we update the version or add any dependency, package-lock.json also gets updated, and we don’t want to make any alterations to it.

package lock json cypress
Cypress package-lock.json file

Cypress Automation: 15 Important Factors Related To It

cy img3 edited 1 300x187 1

In this tutorial, we will discuss the Cypress Automation Framework in detail. We will be covering what Cypress is, how it is different from other testing frameworks, the architecture of Cypress, and the installation procedure in this article. Cypress is an exciting topic and is fun to learn too. Let’s begin!

Cypress Automation Framework

Cypress Automation Framework is a pure Javascript-based testing tool that mainly focuses on front-end testing in modern web applications. With Cypress, applications are easy to test with the visual interface to witness the test execution. Thus, Cypress comes as a boon for both developers and QA engineers by making script writing and test execution easy. In addition, it comes with a distinctive test runner, which makes DOM manipulation easy and runs directly on the Browser.

Table of Content

What is Cypress?

Cypress is faster, better and provides definitive testing that runs on a browser.Cypress is mainly compared with Selenium, but it is completely different. Cypress does not run on top of Selenium, which means it is completely independent. Instead, Cypress runs on top of Mocha, which is again a Javascript-rich test framework. It is compatible with only the Chai Assertion Library, which can access a wide range of BDD and TDD assertions.

Cypress mainly focuses on three different types of testing. They are End-to-End tests, Unit tests, and Integration tests. Cypress can execute any tests that can run in a browser. In addition, it comes along with different mocking capabilities and validations that are enthralled towards front-end testing.

The browsers that Cypress supports are Chrome, Firefox, Edge, Electron, and Brave. Moreover, cross-browser testing is easily achievable with Cypress. Finally, though Cypress supports only Javascript, it can also be written with Typescript, primarily written with Javascript.

Cypress Automation

Cypress is an open-source tool with a free Test runner but has pricing ranging for teams and businesses where they charge you for the Dashboard. However, Dashboard is free up to some extent, unless you additional features like Flake detection, Email support, Jira integration, and many more.

Cypress is mainly used to automate scripts on the web(can automate anything that runs on a browser). It can never run on native mobile apps but can automate some of the functionalities of the mobile applications if those are developed in a browser.

Features

There are many awesome features available in Cypress that stand out from any other automation tool. Here, let’s discuss some of the main features, and we’ll get introduced to other parts later once we begin writing our test cases!

  1. Automatic waiting – Cypress has the advantage of automatic waiting. We will never need to add force waits and sleeps for waiting for the DOM to fetch the element. Cypress automatically waits for any interaction with elements and execution of assertions. Thus, tests are fast!
  2. Time travel – Cypress captures screenshots during test execution. We can view the results visually in real-time by just hovering on the executed commands in the Dashboard. This way, the tests are easier to debug
  3. Debugging tests – Cypress can debug tests from popular tools like Developer tools. The errors are readable, and stacks are easily traceable.
  4. Stub requests – Cypress has options to confirm and control function behaviors, network responses, or timers used by stubs and spies.
  5. Continuous Integration – Cypress does not depend on any other additional CI services. However, on running the command for the test, integration is easily accessible.

Myth about Cypress

There is a myth that Cypress can run only on Javascript-friendly web applications. However, Cypress can test any web applications built with Django, Ruby on Rails, Laravel, etc. In addition, Cypress supports any of the programming languages such as PHP, Python, Ruby, C#, etc. However, we write our tests in Javascript; beyond that, Cypress works on any application.

Components of Cypress

There are two main components in Cypress. They are Test Runner and Dashboard.

Cypress
Cypress Test Runner
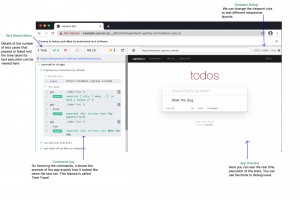
cy img2 1 edited
Cypress Test Feature

Test Runner – Cypress provides this unique test runner, where the user can view the commands during execution and application under test.

There are few subcomponents under Test runner. They are

  1. Command Log – This is a visual representation of the test suite. You can see the commands executed in the test, the assertion details, and the test blocks.
  2. Test Status menu – This menu shows the number of test cases that passed or failed and the time taken for execution.
  3. URL Preview – This gives you information about the URL you are testing to keep track of all the URL paths.
  4. Viewport sizing – You can set the app’s viewport size for testing different responsive layouts
  5. App Preview – This section displays the commands that run in real-time. Here you can use Devtools to debug or inspect each base.

Dashboard: Cypress Dashboard gives the ability to access the tests that are being recorded. With Dashboard service, we can witness the number of passed, failed, or skipped tests. Also, we can view snapshots of the failed tests by using cy. screenshot() command. You can also witness the video of the entire test or the clip of the failed tests.

Cypress Architecture

Most of the testing tools run on the server outside the Browser and execute commands over the network. But, Cypress runs on the Browser where the application is also running. This way, it can access all the DOM elements and everything inside the Browser.

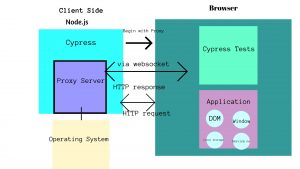
Node server runs behind the Cypress on the client-side. Thus, the node server and Cypress interact with each other, accompany and carry out tasks to support the execution. Since it has access to both the front and back end, the responsiveness to the application in real-time during execution is well accomplished and can also perform tasks that even run outside the Browser.

cypress architecture
Cypress Architecture

Cypress also interacts with the network layer and captures commands by reading and changing the web traffic. Finally, Cypress sends HTTP requests and responses from the node server to the Browser. Since Cypress operates in the network layer, it helps to modify the code that might interfere with the automation of the web browser. The communication between the Node server and Browser is via the WebSocket, which begins execution after the proxy is started.

Cypress controls all the commands that run in and out of the browsers. Since it is installed in a local machine, it directly interacts with the operating system to record videos, capture snapshots, accesses the network layer, and performs file system operations at ease. Cypress can access everything from DOM, window objects, local storage, network layer, and DevTools.

Install Cypress

This section will discuss the installation process that needs to be followed before writing our test cases. There are two different ways to download Cypress. They are

  1. Install via npm
  2. Direct Download

Before we install Cypress, we might need a few pre-requisites to kick start to install via npm. Let’s see them in detail.

Pre-requisites

We will require certain pre-requisites before writing our test cases.

  • As discussed above, Cypress runs on a node server; hence we will have to install Node.js.
  • Also, to write our test cases, we need a code editor or IDE.

In this example, we will be using Visual Studio Code. So let’s dive into the details.

Node.js Installation in Mac

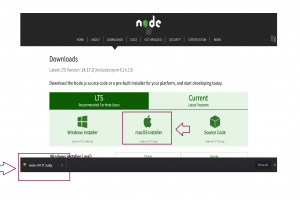
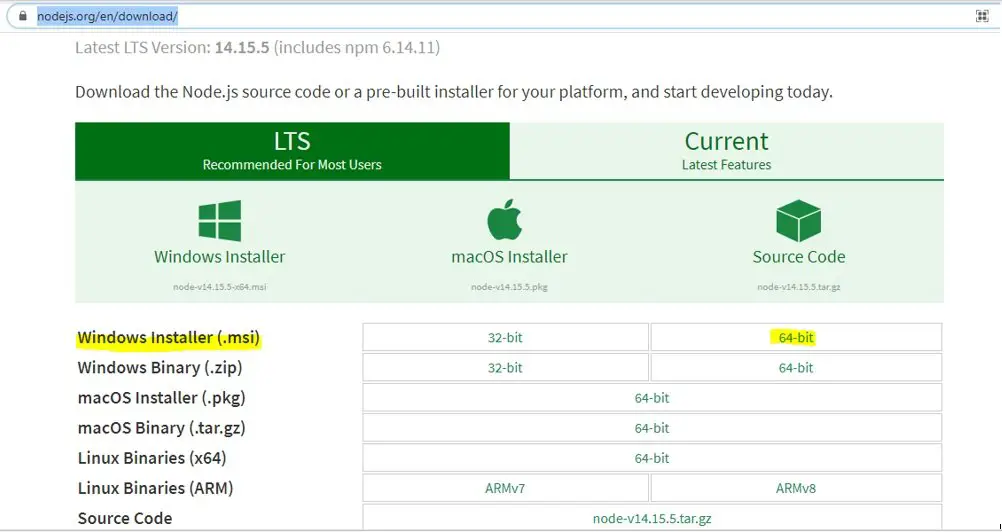
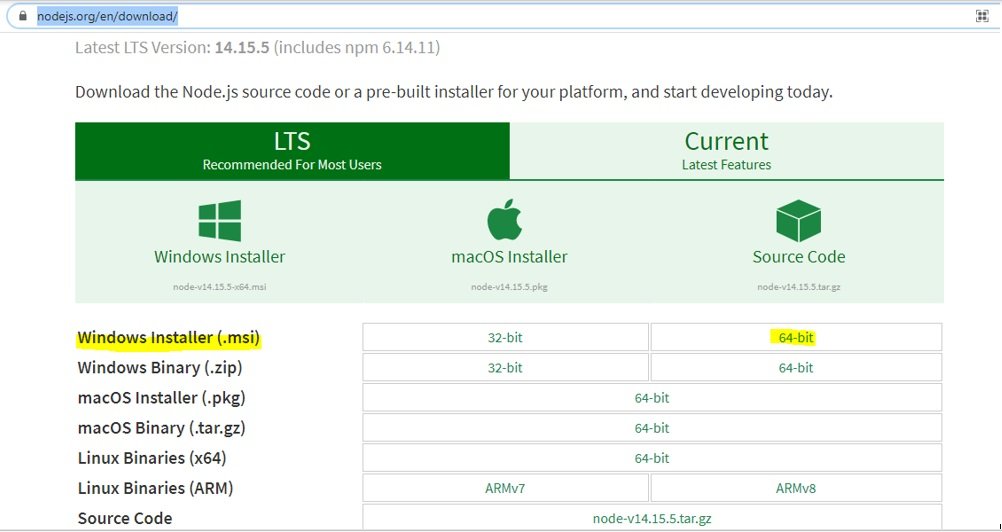
Here, we shall discuss the steps to download Node.js in Mac. Navigate to https://nodejs.org/en/download/. You will now land on the download page.

install 1 2 edited
Node package in macOs

1.Click on the macOS Installer. On clicking, You can find a package file downloaded below. Click on the pkg file to install Node.js

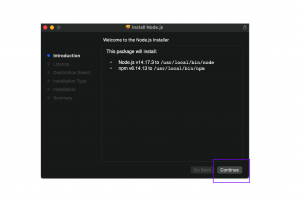
intro install edited
Installer introduction

2. Once you click the .pkg file, the Node installer will open. The introduction section gives you the Node.js and npm versions. Click on Continue

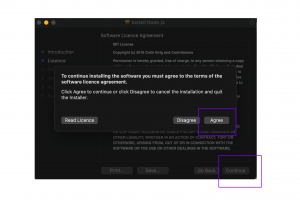
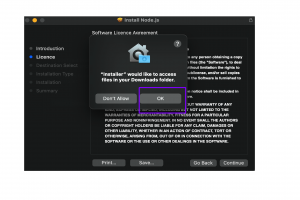
license install 1 edited
Agree License
license install 2 1 edited
Allow Access in Installer

3. Click on Agree Button and then Continue. A pop-up will appear to allow access to your files in the Download folder. Click on Ok.

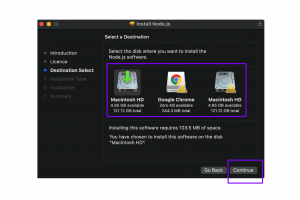
destination select install edited
Choose Destination

4. In this section, you can select the destination to which Node.js has to be downloaded. Again, you can choose according to your system space. Here I am choosing the default location.

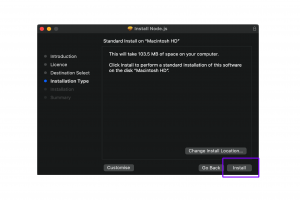
installation type 2 edited
Installation Type
username and password install 1 edited
Enter Username and Password to Install

5. Click on the Install button. Once you click, a pop-up asking your system password would arise. Enter your password and click on Install Software.

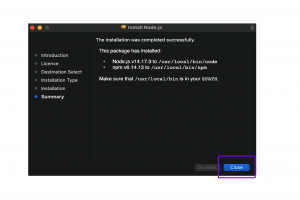
summary install edited
Installation Summary

6. Hurray! We have installed Node.js and npm package. Click on Close to finish installing.

Visual Studio Code Installation in Mac

We have successfully installed Node.js. Now let us install our code editor Visual Studio Code. VS code is a powerful tool that has all the in-built functionalities of Javascript. So let’s dive into the installation steps of Visual Studio Code.

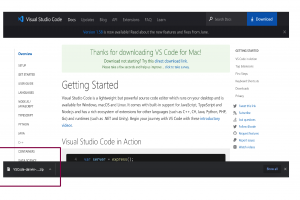
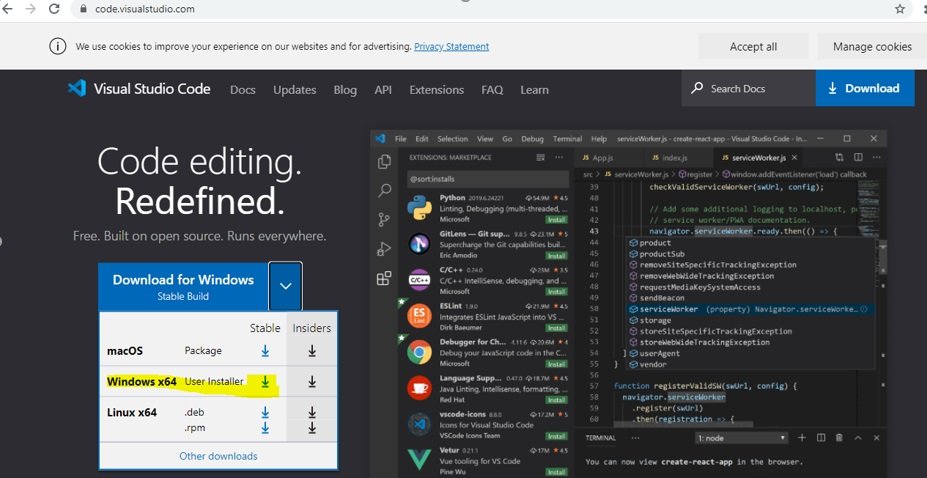
Here we will discuss the steps to download VS code in Mac. First, navigate to https://code.visualstudio.com/download to land on the download page of VS code.

vs code install edited
VS Code Install in Mac

1. Click on the Mac icon. You can see a package getting downloaded below.

vs zip edited
Installed Package in zip

2. Click on the downloaded file to unzip the package. Once unzipped, you can find the Visual Studio Code in your Downloads in Finder.

Screenshot 2021 07 09 at 11.38.58 PM edited 2
VS Code in Downloads

3. Hurray! We have downloaded our Code editor. Click on the icon to open Visual Studio Code.

Creation of a new Cypress project

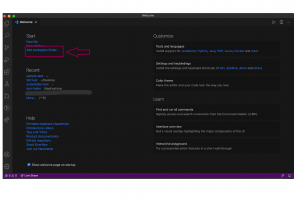
We will now see how to create a new node project in our Visual Studio Code. Once you click on the VS code icon, you will land on the Welcome page. Next, click on the Add Workspace folder to create a new folder.

newfolder vs 2 edited
Creation of new project

Once you click on the folder, you will get a pop-up asking to add a new folder. Now click on the location you want to add the workspace. Next, click on New Folder and Add the Folder name as CypressProject and click Open.

new folder vs edited
New folder Creation

Now we have created a folder for our Cypress test. Before we begin writing our tests, we should install the package.json file. Before installing, let us understand what is package.json file.

What is Package.json file?

Package.json comprises all the npm packages in a file, usually located in the project root. It is commonly located in the root directory of the Node.js project. This file holds all the applicable metadata necessary for the project. It gives all the information to npm and helps in identifying the project and handle dependencies. Package.json file contains information such as project name, versions, license, dependencies, and many more.
Now we have understood what is package.json file. So, let’s begin the steps to download the file in our Visual Studio code.

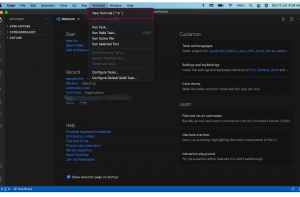
vs code open terminal edited
Open Terminal

1. To execute our commands, we need to open the Terminal. On the top of the VS code, click on the Terminal. Once the dropdown opens, click on New Terminal.

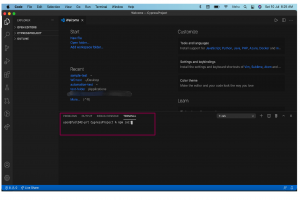
terminal npm init edited
Install package.json file

2. Once the terminal opens, type the below command in the project directory and press Enter.

npm init

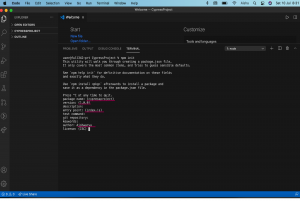
3. Once you press Enter, you can see the certain information displayed. You can type the required details in the Terminal and press Enter to obtain all the fields.

package.json creation edited
Project details
  • Package name: You can provide any name to your package. I have left it blank as it is pre-populated with the folder name we created.
  • Version: This gives the information of the version of npm. You can skip this and press Enter.
  • Description: Here, you can give a piece of additional information to the package. If required, you can type the description and press Enter again.
  • Entry point: This represents the entry point of the application. Since it is pre-populated with index.js, we can skip this field and press Enter.
  • Test command: Command that is given to run the test. Here it is not necessary to give any commands, but if required, you can definitely provide any command.
  • Git repository: This field requires the path to the git repository. You can leave this field blank as well.
  • Keywords: Unique keywords to help identify the project. You can skip this field too.
  • Author: This is usually the username of the person. You can add your name and press Enter.
  • License: License is pre-populated with ISC. You can proceed by pressing Enter.
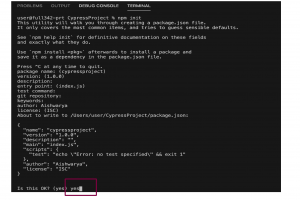
  • 4. Once you press Enter, Terminal will ask for confirmation by listing all the details you provided. Type Yes and press Enter again.
pckg json yes edited
Package.json file creation confirmation

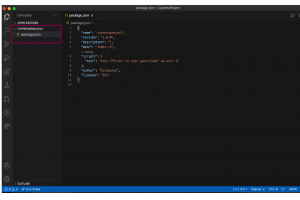
We have now generated a package.json file. You can view the file in your code editor with the information we provided.

pckg json created edited
Created Package.json file

Installation steps of Cypress

We have installed all the pre-requisites for our Cypress download, node, and initialized npm. As mentioned above, there are two ways to download Cypress.

Download Cypress via npm

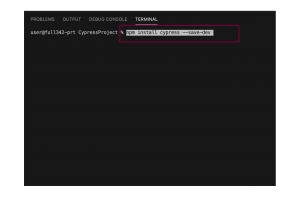
You will have to pass the below-mentioned command in the Terminal to install Cypress. In addition, you will have to give the command in the project directory to install the node and generated the package.json file.

npm install cypress --save-dev
install cypress command edited
Cypress Installation command

Once you pass the command, it will download all the relevant dependencies required for the project. At the writing of this article, the latest version of Cypress is 7.7.0. The version might differ at the time you are downloading.

cyp downloaded edited
Successful Cypress Installation

With reference to the above image, you can see that we have downloaded Cypress. You can verify by the downloaded representation in Terminal and the addition of devDependencies in the package.json file.

Direct Download

We can download Cypress directly from their CDN if you are not using the Node or npm package in the project. However, recording the tests in the Dashboard is not possible via direct download.

You can download by clicking on download Cypress directly from this link. This will now directly download the package. Once the package is downloaded, open the zip file and double click. Cypress will run without the need for any installation of dependencies. This download will always pick up the latest version based, and the platform will be detected automatically. However, downloading Cypress via npm is recommended rather than a direct download.

For more post on Technology, please visit our Technology page.

Great Learning Guide of Puppeteer Browser Class (Tutorial 8)

Puppeteer is an open-source node js library and is used a web automation as well as web scraping tool. You need the basic understanding of Javascript, and HTML DOM structure to start working with Puppeteer. This Puppeteer tutorial series is distributed in the below segments which will equip you with all the necessary experience to start working with Puppeteer. 

Puppeteer Tutorial

Tosca Tutorial #1: Puppeteer Overview

Tosca Tutorial #2: Puppeteer Environment Variables

Tosca Tutorial #3: Puppeteer Web Scraping and Puppeteer Test Automation Overview

Tosca Tutorial #4: Install Puppeteer

Tosca Tutorial #5: Sample Puppeteer Project

Tosca Tutorial #6: Puppeteer Automation Testing

Tosca Tutorial #7: Puppeteer Class

Tosca Tutorial #8: Puppeteer Browser Class

Tosca Tutorial #9: Puppeteer Page Class

In this “Puppeteer Browser Class” tutorial, we will have in depth understanding further about the below mentioned classes which consists of the important namespaces, events, and other exhaustive methods that are needed to work with Puppeteer web scraping techniques.  

Puppeteer BrowserFetcher Class

Puppeteer BrowserFetcher Class is used to download and manage the different browser versions. BrowserFetcher class operates on a revision string that specifies the version of the chrome browser. The revision number can be obtained from here. In the case of Firefox, it downloads the browser nightly based on the version number.

Below example shows how to download and launch the chrome browser using BrowserFetcher class.

const browserFetcher = puppeteer.createBrowserFetcher();
const revInfo = await browserFetcher.download('766890');
const browserChrome= await puppeteer.launch({executablePath: revInfo.executablePath})

It is not possible to work simultaneously with another instance of BrowserFetcher class. The frequently used methods of BrowserFetcher class are explained in the next sections.

Puppeteer BrowserFetcher Class – Methods:

Below methods are available in puppeteer browserfetcher class,

browserFetcher.canDownload(revision) – With the help of the revision number of the browser, this method checks the availability of the specified browser as a part of the header request. The method returns the boolean value(true or false) based on availability.

const boolVar = browserFetcher.canDownload(‘766890’);

browserFetcher.download(revision[, progressCallback]) – This method downloads the chrome browser using the revision number argument. Here progressCallback is an optional argument that calls the function with two arguments – downloaded bytes and total bytes. This method returns the revision information as a promise object.

const revInfo = browserFetcher.download(‘766890’);

browserFetcher.host() – It returns the hostname, which is used for downloading of browser.

const hostName = browserFetcher.host();

browserFetcher.localRevisions() – It returns the list of all revisions which are available in the local system.

const revList = browserFetcher.localRevisions();

browserFetcher.platform() – It returns the platform name of the host, which will be any of the mac, Linux, win32, or win64.

const platformName = browserFetcher.platform();

browserFetcher.product() – It returns the browser name which will be either chrome or firefox

const productName = browserFetcher.product();

browserFetcher.remove(revision) – This method is used to remove the specified revision for the current product/browser. It returns the promise object, which is resolved after completion of the process.

const revInfo = browserFetcher.remove(‘766890’);

browserFetcher.revisionInfo(revision) – It will return an object on revision information which includes revision, folderPath, executablePath, url, local, and product.

const revInfo = browserFetcher.revisionInfo(‘766890’);

Reference: Click here to learn more on BrowserFetcher Class methods.

Puppeteer Browser Class

The Puppeteer Browser class is created when the puppeteer launched or connected the browser using puppeteer.launch or puppeteer.connect methods.

Below example shows how to create the Browser class and Page using the browser reference.

const puppeteer = require('puppeteer');
(async () => {
  const browserChrome = await puppeteer.launch();
  const pageChrome = await browserChrome.newPage();
  await pageChrome.goto('https://www.google.com');
  await browserChrome.close();
})();

The frequently used events and methods of Browser class are explained in the next section.

Puppeteer Browser Class – Events:

Below events are available in browser class,

  • browser.on(‘disconnected’) – This event is triggered when the browser is closed/crashed or browser.disconnect method is called.
  • browser.on(‘targetchanged’) – This event is triggered when the url of the target has changed.
  • browser.on(‘targetcreated’) – This event is triggered when the new page opened in a new tab or window by the method browser.newPage or window.open.
  • browser.on(‘targetdestroyed’) – This event is triggered when the target is destroyed, i.e., the page is closed.

Puppeteer Browser Class – Methods:

Below methods are available in browser class,

  • browser.browserContexts() – It returns the list of all browser contexts. For a newly launched browser, this method will return the single BrowserContext instance.
  • browser.close() – This method is used to close all the open chromium-browser pages. 

await browser.close();

  • browser.createIncognitoBrowserContext() – It creates/returns the incognito browser context, which will never share the cookies or cache with any other browser contexts. In the below example, the web page(google) will be opened in incognito mode.

(async () => {
  const chromeBrowser = await puppeteer.launch();
  // Create new incognito browser context.
  const context = await chromeBrowser.createIncognitoBrowserContext();
  const pageChrome = await context.newPage();
  await pageChrome.goto(‘https://www.google.com’);
})();

  • browser.defaultBrowserContext() – It returns default browser context which can not be destroyed or closed.
  • browser.disconnect() – It will disconnect the browser from the puppeteer. But, the browser will remain running in this case.
  • browser.isConnected() – This method checks if the browser is connected or not. It will return boolean values based on the check.

const boolFlag = await browser.isConnected();

  • browser.newPage() – This method will create a new page and return the instance of the page.

const page = await browser.newPage();

  • browser.pages() – This method returns the list of all pages which are currently in the open state.

const pageList = await browser.pages();

  • browser.process() – This method returns the created browser process. If the browser is created using browser.connect method, and it will return a null value.
  • browser.target() – This method returns the target associated with the browser.

const target = await browser.target();

  • browser.targets() – It returns the list of all active targets within the browser.

const targetList = await browser.targets();

  • browser.userAgent() – It returns the promise object about the original agent of the browser.
  • browser.version() – It returns the version of the browser in the format of ‘HeadlessChrome/xx.x.xxxx.x’ for headless chrome and ‘Chrome/xx.x.xxxx.x’ for non headless chrome. The format can change in a future release.
  • browser.waitForTarget(predicate[, options]) – It will search in all the browser contexts and wait for the target.

await pageChrome.evaluate(() => window.open(‘https://lambdageeks.com/’));
const newWindowTarget = await browser.waitForTarget(target => target.url() === ‘https://lambdageeks.com/’);

  • browser.wsEndpoint() – It returns the web socket url of the browser.

const wsUrl = await browser.wsEndPoint();

Reference: Click here to learn more on Browser class events and methods.

Puppeteer BrowserContext Class

The BrowserContext class helps to operate multiple browser instances. After launching a browser instance, by default, a single BrowserContext is used. The browserChrome.newPage() method creates a page in the default BrowserContext class object. If a web page invokes another page, then the new page should belong to the browsercontext of the parent page. Here, the new page can be created using the window.open() method. 

In the below example, Puppeteer has the ability to create a browser context in ‘incognito’ mode. The ‘incognito’ browser context does not write any data in the storage.

// Incognito browser context creation
const contextIncognito = await browserChrome.createIncognitoBrowserContext();
// New page creation through the browser context.
const pageChrome = await contextIncognito.newPage();
await pageChrome.goto('https://www.google.com');
//close context after use
await contextIncognito.close();

The frequently used events and methods of BrowserContext class are explained in the next section.

Puppeteer BrowserContext Class – Events:

Below events are available in browsercontext class,

  • browserContext.on(targetchanged) – This event is triggered when the url of the target within the browser context has changed.
  • browserContext.on(targetcreated) – This event is triggered after creation of  inside the browser context. The methods window.open and browserContext.newPage are responsible for this event.
  • browserContext.on(‘targetdestroyed’) – This event is triggered when the target is destroyed within the browser context.

Puppeteer BrowserContext Class – Methods:

Below methods are available in browsercontext class,

  • browserContext.browser() – This method returns the browser object which is available within the browser context.
  • browserContext.clearPermissionOverrides() – This method removes all permission overrides from the browser context. The below example shows how to use this method – 

const browserContext = browser.defaultBrowserContext();
browserContext.overridePermissions(‘https://www.google.com’, [‘clipboard-read’]);
browserContext.clearPermissionOverrides();

  • browserContext.close() – This method is used to close or destroy the browser context. All the browsers available within the browser context will be closed.

browserContext.close();

  • browserContext.isIncognito() – This method is used to check if the browser has been created in ‘incognito’ mode or not. It returns a boolean value(true – incognito mode or false – non-incognito mode) based on the browser mode. By default, any browser is invoked in ‘non-incognito’ mode.

const boolIsIncognito = browserContext.isIncognito();

  • browserContext.newPage() – This method is used to create a new page in the same browsercontext.

browserContext.newPage();

  • browserContext.overridePermissions(origin, permission) – This method is used to grant the specified permission to the origin, i.e., the target url. The different permissions which are available to grant are –
  • ‘geolocation’
  • ‘midi-sysex’ (system-exclusive midi)
  • ‘midi’
  • ‘push’
  • ‘camera’
  • ‘notifications’
  • ‘microphone’
  • ‘ambient-light-sensor’
  • ‘accelerometer’
  • ‘background-sync’
  • ‘gyroscope’
  • ‘accessibility-events’
  • ‘clipboard-read’
  • ‘magnetometer’
  • ‘clipboard-write’
  • ‘payment-handler’

The below example shows how to grant permission –

const browserContext = browser.defaultBrowserContext();
await browserContext.overridePermissions(‘https://www.google.com’, [‘geolocation’]);

  • browserContext.pages() – This method returns the list of all the open pages available in the browser context. Any non-visible page will not be listed here.

const openPageList = browserContext.pages();

  • browserContext.targets() – This method returns the list of all the active targets available in the browser context. Any non-visible page will not be listed here.

const activeTargetList = browserContext.targets();

  • browserContext.waitForTarget(predicate[, options]) – This method is used to wait for a target to have appeared and returned the target object. The argument, ‘predicate’ is basically a function call for each of the targets. Also, optionally, we can pass some configuration values such as timeout as a second argument.
await pageChrome.evaluate(() => window.open('https://www.google.com/'));
const newWindowTarget = await browserContext.waitForTarget(target => target.url() === 'https://www.google.com/');

Reference: Click here to read more on BrowserContext class events and methods.

Conclusion:

In this “Puppeteer Browser Class” tutorial, we have explained the BrowserFetcher class, BrowserContext class, and Browser class which includes the important namespaces(if any), events(if any), and methods that are frequently used in Puppeteer web scraping techniques with examples. In the next article, we will explain Page, Frame, and Dialog class.

Great Learning Guide of Puppeteer Class (Tutorial 7)

Puppeteer which is an open-source node js library, can be used as a web scraping tool. Understanding of command line, Javascript, and HTML DOM structure should be good to start with this puppeteer tutorial. The Series of Puppeteer tutorial is distributed among below Sub section to get a good hold on Puppeteer. 

Puppeteer Tutorial

Puppeteer Tutorial #1: Puppeteer Overview

Puppeteer Tutorial #2: Puppeteer Environment Variables

Puppeteer Tutorial #3: Puppeteer Web Scraping and Puppeteer Test Automation Overview

Puppeteer Tutorial #4: Install Puppeteer

Puppeteer Tutorial #5: Sample Puppeteer Project

Puppeteer Tutorial #6: Puppeteer Automation Testing

Puppeteer Tutorial #7: Puppeteer Class

Puppeteer Tutorial #8: Puppeteer Browser Class

Puppeteer Tutorial #9: Puppeteer Page Class

In this “Puppeteer Class” tutorial, we will explain the below classes which include the important namespaces(if any), events(if any), and methods which are frequently used in Puppeteer web scraping techniques. 

We will explain important components with examples throughout this article.  

Puppeteer Class

Conceptually, the class is a blueprint of an object which defines a set of instructions( variables and methods). Here, the Puppeteer class is defined using javascript to perform different actions to perform web scraping. Let’s check the below example, the Puppeteer class module has been used to launch a Chromium web instance.

const puppeteer = require('puppeteer');
(async () => {
  const browserChrome = await puppeteer.launch();
  const pageChrome = await browserChrome.newPage();
  await pageChrome.goto('https://www.google.com');
  // We can write steps here
  await browserChrome.close();
})();

Puppeteer class also provides multiple Namespaces and Methods, which supports the web scraping process. The frequently used Namespaces and Methods are explained next sections.

Puppeteer Class – Namespaces:

It’s a container that defines multiple identifiers, methods, variables, etc., in javascript. It’s a way to group the code in a logical and organized way. Below namespaces are provided by the Puppeteer class.

puppeteer.devices: It returns a list of devices that can be used by the method page.emulate(options) to perform scraping in mobile devices. 

Example – Open and close google web page on a mobile device –

const puppeteer = require('puppeteer');
const samsung = puppeteer.devices['Samsung J5'];
(async () => {
  const browserChrome = await puppeteer.launch();
  const pageChrome = await browserChrome.newPage();
  await pageChrome.emulate(samsung);
  await pageChrome.goto('https://www.google.com'); 
  await browserChrome.close();
})();

puppeteer.errors: While working with different puppeteer methods, there is a chance of exceptions. Mostly, if the methods are unable to fulfill the requests, it throws errors. There are different classes defined to handle errors through the ‘puppeteer.errors’ namespace.

Example – for method page.waitForSelector, if the web element does not appear within the specified time, then the timeout error will appear. Please go through the below example, which shows an approach to handle timeout,

try {
  await page.waitForSelector('<web-element>');
} catch (err) {
  if (err instanceof puppeteer.errors.TimeoutError) {
    // Write code to handle the timeout error.
  }
} 

puppeteer.networkConditions: It returns a list of network conditions that can be used on the method page.emulateNetworkConditions(networkConditions). The complete list of network conditions is defined here.

Example – Through this code sample, we will open the google web page using a pre-defined network condition.

const puppeteer = require('puppeteer');
const net = puppeteer.networkConditions['Fast 3G'];
(async () => {
  const browserChrome = await puppeteer.launch();
  const pageChrome = await browserChrome.newPage();
  await pageChrome.emulateNetworkConditions(net);
  await pageChrome.goto('https://www.google.com');
  await browserChrome.close();
})();

puppeteer.product: It returns the name of the browser, which will be used for automation(Chrome or Firefox). The product for the browser is set by either environment variable PUPPETEER_PRODUCT or the product option available in puppeteer class method puppeteer.launch([options]). The default value is Chrome.

Reference: Click here to learn more on Puppeteer Class namespaces.

Puppeteer Class – Methods:

Methods contain statements to perform the specific action. The puppeteer class have below methods,

puppeteer.clearCustomQueryHandlers() – It clears all registered handlers.

puppeteer.connect(options) – This method is used to connect puppeteer with any existing browsers. It returns an object of type promise which indicates the status of this asynchronous process. Example – In the below example, puppeteer disconnect from the current browser and reconnect,

const puppeteer = require('puppeteer');
(async () => {
  const browserChrome = await puppeteer.launch();
  // Copy the endpoint reference which will be reconnected later
  const endpoint = browserChrome.wsEndpoint();
  // Disconnect puppeteer
  browserChrome.disconnect();
  // Use the endpoint to re-connect
  const browserChrome2 = await puppeteer.connect({endpoint});
  // Close second instance of Chromium
  await browserChrome2.close();
})();

puppeteer.createBrowserFetcher([options]) – It creates a browser fetcher object to download and manage the different versions of browsers (Chrome and Firefox).

const browserFetcher = puppeteer.createBrowserFetcher();

puppeteer.customQueryHandlerNames() – It returns an array of all the registered custom query handlers.

puppeteer.defaultArgs([options]) – It returns the default configuration options of chrome browser as an array while launching. Also, we can set the configurable options of a browser using the optional argument option.

const args = puppeteer.defaultArgs();

puppeteer.executablePath() – It returns the path is expected by the puppeteer for the bundled browser instance. The path that would not be available in the download was skipped by the environment variable PUPPETEER_SKIP_DOWNLOAD. Also, we can use the environment variables PUPPETEER_EXECUTABLE_PATH and PUPPETEER_CHROMIUM_REVISION to change the path.

const args = puppeteer.executablePath();

puppeteer.launch([options]) – This puppeteer class method is used to launch the web browser. Through the optional argument, we can pass the different configurations of the browser, such as product(browser name), headless, devtools, etc. This method returns the promise object, which holds the reference of the launched browser.

const browser = await puppeteer.launch();

puppeteer.registerCustomQueryHandler(name, queryHandler) – It’s used to register a custom query handler. Here “name” provides the name of the query handler, and “queryHandler” defines the actual custom query handler.

puppeteer.unregisterCustomQueryHandler(name) – It’s used to unregister any custom query handler.

Reference: Click here to read more on Puppeteer Class methods.

Target Class

The target class provides methods to work with targets. The most frequently used methods which are available with target class are explained in the next section.

Target Class – Methods:

Below methods are available in targets class –

  • Target.browser() – It returns the browser object which is linked to the target.
  • Target.browserContext() – It returns an object of type browserContext which is linked to the target.
  • Target.createCDPSession() – It creates and returns the devtool protocol session of the chrome, which is attached to the target.
  • Target.opener() – It returns the target which opens this target. Basically, this method is used to get the parent target. It returns null for the top-level target.
  • Target.page() – It returns the page object of the target. If the type of the target is not a page, it returns a null value.
  • Target.type() – It’s used to get the type of the target. The return value can be either of the options – ’background_page’ , ‘page’ ,’shared_worker’,’service_worker’,’browser’ or ‘other’.
  • Target.url() – It returns the url of the target.
  • Target.worker() – It returns the webworker object. The return value is null if the target is neither ‘service_worker’ nor ‘shared_worker’.

Reference: Click here to read more on Target class methods.

ConsoleMessage Class

The ConsoleMessage class objects are dispatched by page through the console event. The frequently used methods of the consoleMessage class are explained in the next section.

ConsoleMessage Class – Methods:

Below methods are available in ConsoleMessage class –

  • consoleMessage.args() – It returns a array of JSHandler object. The JSHandler prevents the linked JS object from being garbage collected until the handle is disposed of. It’s automatically destroyed when the parent browser context is destroyed.
  • consoleMessage.location() – It returns an object of the resource, which includes the below parameters.
  • url – It denotes the URL of the known resource. If not known, it will keep an undefined value.
  • LineNumber – It’s the 0-based line number that is available in the resource. If not available, it will keep an undefined value.
  • columNumber – It’s the 0-based column number that is available in the resource. If not available, it will keep an undefined value.
  • consoleMessage.stackTrace() – It returns a list of objects(each object refers a resource) which includes below parameters.
  • url – It denotes the URL of the known resource. If not known, it will keep an undefined value.
  • LineNumber – It’s the 0-based line number that is available in the resource. If not available, it will keep an undefined value.
  • columNumber – It’s the 0-based column number that is available in the resource. If not available, it will keep an undefined value.
  • consoleMessage.text() – It returns the text of the console.
  •  consoleMessage.type() – It returns the string as the type of console message. The type can be either of the values – log, debug, info, error, warning, dir, dirxml, table, trace, clear, startGroup, startGroupCollapsed, endGroup, assert, profile, profileEnd, count, timeEnd.

Reference: Click here to learn more on consoleMessage class methods.

TimeoutError Class

While working with different puppeteer, there is a chance of exceptions. Mostly, if the methods are unable to fulfill the requests, it throws errors. The TimeoutError class is used to handle this kind of exception.

Example of TimeoutError Class – for method page.waitForSelector, if the web element does not appear within the specified time, then the timeout error will appear. Please go through the below example, which shows an approach to handle timeout,

try {
  await page.waitForSelector('<element>');
} catch (e) {
  if (e instanceof puppeteer.errors.TimeoutError) {
    // Write code to handle the error.
  }
} 

FileChooser Class

The file chooser class object is created using the method page.waitForFileChooser. The FileChooser class is used to interact with files. The frequently used methods of the FileChooser class are explained in the next section.

FileChooser Class – Methods:

Below methods are available for FileChooser class –

  • fileChooser.accept(file_with_path) – This method is used to upload any file (for which path is provided as an argument).
  • fileChooser.cancel() – This method is used to cancel the file upload process.
  • fileChooser.isMultiple() – This method checks if the fileChooser allows to select multiple values. It returns a boolean expression(true or false).

An example of FileChooser class –

const [fileChooser] = await Promise.all([
  page.waitForFileChooser(),
  page.click('#attach-button'), 
]);
await fileChooser.accept(['/puppeteer_proj/data/sample_file.pdf']);

Conclusion:

In this “Puppeteer Class” tutorial, we have explained the Puppeteer class, Target class, MessageConsole class and TimeoutError class which includes the important namespaces(if any), events(if any), and methods that are frequently used in Puppeteer web scraping techniques with examples. In the next article, we will explain BrowserContext, Browser, and BrowserContext Class.

Tosca Automation Tool: An Excellent Learning Guide

Tosca Automation Tool Tosca Commander 300x179 1

Tosca Tutorial – Table of Content

Tosca Tutorial #1: Tosca Overview

Tosca Tutorial #2: Tosca Automation Overview

Tosca Tutorial #3: Tricentis Tosca Setup – Install, Uninstall and License Configuration

Tosca Tutorial #4: Tosca Workspace Creation

Tosca Tutorial #5: Understanding of TOSCA Commander and Tosca User Management

Tosca Tutorial #6: Tosca Scanning – An Introduction to Modules

Tosca Tutorial #7: Tosca Test Case Creation

Tosca Tutorial #8: Tosca Parameters and Library– Buffer, Business Parameter, TCP

Tosca Tutorial #9:Tosca Test Execution, Reports, and Bug management

Tosca Tutorial #10: Test Case Design – An approach to test data management 

Tosca Tutorial #11: Tosca Test Data Management.

Tosca Tutorial #12: API Testing in Tosca

Tosca Tutorial #13: Tosca Interview Questions and Answers

In this Tosca Tutorial, we will learn about overview of Tosca Automation Tool which includes –

  • Tosca Automation Tool
  • Tosca Workspace
  • Tosca Commander
  • Tosca Automation

Tosca Automation Tool

Being a test tool, Tosca has the ability to automate the functional and regression testing scenarios. It is also capable of mobile and API testing, which is now mandatory for any product delivery in AGILE mode. Tosca supports scripts less automation i.e., scripts and coding is not required to automate any scenario. So, anyone can learn the tool easily and start developing test cases.TOSCA supports its users to build efficient test cases in a methodologically way and provide detailed reports for management.

Tosca Key Features Are:

  • Model-Based Testing Approach: It’s one of the significant features of Tosca as a test automation tool. It helps Tosca to gain leverage over other automation tools. Tosca creates a model of AUT(application under test) to create the test case with out using of scripts.
  • Risk-Based Testing Approach: As per the name explains, this feature helps users to assess the risk with respect to test cases and allows them to identify the right set of test scripts to minimize the risks. Following different black box testing approaches such as boundary testing, equivalence partitioning, decision box, linear expansion, etc. are utilized to reduce the test script count by ensuring the functional risk coverage. After completion of test execution, risks are measured based on the test results and risk coverage.
  • Scriptless test cases: Tosca allows script less automation. It means test cases are created based on the modules which are added by drag and drop method, test data parameters, etc. after carefully incorporating the checkpoints. So, anybody can develop the test suite with minimum programming knowledge.
  • Dynamic test data: Test data can be stored separately in a central repository.
  • Easy to the maintenance of test cases:  In case of a change in application or data, it can be easily incorporated in the test suite by updating the centrally stored modules, library, and data.
  • Distribute Execution: Tosca also provides a great feature to schedule and execute the test cases in different distributed systems in an unattended mode. It reduces the human efforts for testing.
  • API Testing: Due to these features, we can test the applications which are partially developed through the API.
  • Test Recording: Linear test cases can be developed through recording mode with checkpoints to save time.
  • Detailed Reporting and execution logs: Tosca generates a detailed report with screenshots. Also, the report can be customized based on the requirements.
  • Mobile Testing: Tosca is also capable of mobile(android and ios) test automation without using any third-party tools.
  • Supports different kinds of applications: Tosca as a test automation tool, has the ability to automate most of the major applications such as Web, Salesforce, SAP, Powerbuilder, DotNet, android/ios devices, etc.
  • Ability to integrate with third-party tools: It also allows us to integrate with any third-party tools like ALM, Perfecto, Selenium, Azure, etc.

Tosca Commander

The Tosca commander is the primary component of Tricentis Tosca Automation tool. It has the capability to manage all the activities which are involved with test automation. It has five primary sections – 

1. Module Sections – This section contains all the standard and user-defined modules which are required to build the automated test cases.

2. Testcase Section – Technical components of test cases are stored here.

3. TestCaseDesign Section – Dynamic test data are stored here, which are used by the test cases.

4. Execution Section – All the test executions are performed from this section through execution lists. After the execution, detailed logs are kept here.

5. Requirements Section – Requirements related information are stored here.

The primary functions of the Tosca Commander are mentioned below – 

  • Tosca User management
  • Scan applications to create modules
  • Create a library
  • Create a test case
  • Test data parameterization using TCP, TCD, TDM, TDS
  • Maintenance of test cases
  • Test execution
Tosca Automation Tool - Tosca Commander
Tosca Automation Tool – Tosca Commander

Click here to read more on Tosca Commander.

Tosca Workspace

Tosca workspace is a place where any user can perform different activities such as test building, maintenance, execution etc. which are related to Tosca test automation. Workspace is created in the local drive. But it can also be created in a shared network drive or different databases as a central repository based on the business requirement. It is recommended that only one user should be assigned to a single workspace. 

For a multiuser environment, the workspace should be created in a central place which can be accessed by each of the users. 

In a Singleuser Workspace, only one user has access to the workspace. So, the managing of the data and sources is not required.

The Multiuser Workspace manages the data administration more simple as all data of a project are kept in a central location which is called Common Repository. So, in the multiuser workspace, the user has to check out(lock) the different components before modifying it to avoid any data loss. After finishing the update, the user has to check-in(unlock) the components to save the same in the common repository so that any other user can access it.

Pleas click here to learn Tosca Workspace in detailed exlanations.

Tosca Automation Tool - Tosca Workspace
Tosca Automation Tool – Tosca Workspace

Tosca Automation

We have to learn about below topics to understand the overview of Tosca Automation.

Tosca Modules:

The technical information of controls are stored in Tosca modules. The purpose of the technical information to steer the test objects.

To develop the test cases in Tosca, the first step is to scan the application and created the modules. We has to scan and create modules for all the required controls from each of the pages/screens of the test application. Each of the test objects which are available in application pages/ screens, are treated as “control” in Tosca. The controls which are required during test execution, has to be added as module’s attribute.

Two types of modules are available in Tricentis Tosca. Those are –

·        Classic Modules – It uses classic engines to steer the test objects.

·        XModules – On the other side, It uses TBox framework based Tosca XEngines.

Tosca Automation Tool - Tosca Modules
Tosca Automation Tool – Tosca Modules

Click here to learn more on Tosca Modules.

Tosca Test Case:

Test Case is a group of logical steps/ blocks of instructions to verify the specific functionality of an application under test(AUT). The Test Case can be either manual or automated. Through this article, we will explain about the automated Tosca test cases. Tosca Test Case is basically a combination of standard and user-defined modules with verification points.

Classification of Tosca Test Cases:

  • Technical Test Cases
  • Business Test Case

Technical Test Cases:

These are the physical Test Cases that are used to verify the test scenarios. It can be created after right-clicking on any folder available in the Test Cases section and selecting a circular arrow icon with blue color. There is a short cut keys are available to create Tosca test cases using the key combinations of “Ctrl+N” and “Ctrl+T.”  

Test Step: The test steps can be created by inserting (or drag -drop) the modules into the Test Cases. So, after adding the modules with actions and data in test case, are represented as test steps. After selecting the module or test step from the left panel, in the right side details section has appeared. Tosca Test Cases are supported below operations –

  • If-Else Condition
  • Condition
  • Looping Statements
  • Storage

Business Test Case:

Business Test Cases are used to create logical groups to define functional coverage. One business Test Case is a group of one or more technical Test Cases. We cannot execute it directly. It’s used only for monitoring the functional coverage of testing during the testing cycle.

Tosca Automation Tool - Tosca Test Case
Tosca Automation Tool – Tosca Test Case

Click here to learn more on test cases as a part to Tosca Automation.

Tosca Parameters:

Parameterization is an approach to feed test data through parameters or variables into the Test Cases. In this article, we will discuss parameters such as buffer and test configuration parameters.

Buffer – We can consider a variable as a Buffer in Tosca to store the data. The buffer scope is restricted to the local workspace. So, the buffer can not be accessed by any other test system as the buffer values are not updated to common repository.

Test Configuration Parameters – The shorter form of Test Configuration Parameters is TCP, which can be defined in the Test Case folder, Test Case, and execution list level. When the TCPs are defined in folder level, it can be access from all the child folders and test cases. The syntax for TCP to access the value is {CP[<logical name>]}. We can create, modify or view the TCPs from the Test Configuration section of any test case, folder, or execution list.

The configuration or test environment related data, which are unique for entire test suites, should be kept in test configuration parameters (TCPs) . The examples of the advisable TCP parameters are such as path of the application, URL, environment name, user details, reporting path, etc.

Tosca Library:

Test Step Block – It is a collection of test steps which is required to automate a small functionalities. Conceptually, it is the same as function or method. The logical grouping is done through Test Case level folders. The purpose of creating a test step block is for better readability and understanding of Test Cases.

For example, application login functionality is involved with steps – invoke browser, enter credential, and login verification. In this particular example, we need to create a folder within the test case which will be represented as test step block. Then, we will rename it to ApplicationLogin  and create three steps.

Test Step Library – It’s a location to create our reusable test step components. The Library can be created under any folder available in the Test Cases section. There is a limitation that we can not create more than one Library within a root folder.

Library creation – First, need to right-click on any folder available in TestCase section and select the “create teststep library” folder icon with L symbol. The shortcut keys to create library folder are the combination of  “Ctrl+N” and “Ctrl+L”.

Tosca Automation Tool - Tosca Library
Tosca Automation Tool – Tosca Library

Tosca Execution:

Once we have created test cases in the TestCases section of Tosca Commander, we can proceed with one of the following options for test execution –

· Execution in Tosca ScratchBook

· Execution in Tosca ExecutionList

Execution in ScratchBook: It is advisable to execute test cases in ScratchBook to ensure the test case completeness during the test development and maintenance phase. The execution log created in scratchbook will not available for future reference as it’s a kind of temporary log. We can also drill down and execute individual TestSteps as well.

Execution in ExecutionList: The actual test execution cycle has to be done from ExecutionList which are created for the particular cycle. The result logs which are created in ExecutionList can be used for future reference. This logs are saved in common repository. We can integrate the execution list with external system for continuous testing.

Get more details on Tosca execution, please click here.

Conclusion:

Through this article, we have learned about the overview of different Tosca Automation activities such as, Tosca Automation Tool, Tosca Workspace, Tosca Commander and Tosca Automation. Also, please click here to understand more from Tricentie Support portal.

Puppeteer Automation Testing: Tutorial 6

Puppeteer Automation Testing Open Chrome Developer tool 300x169 1

The Puppeteer is a node js library based framework which is available as open-source. It can be used for web scraping tools. It’s also used for test automation tools as well. Now-a-days, the usage of Puppeteer is getting increased rapidly in the automated software testing space. Basic knowledge of command line, Javascript, and HTML DOM structure is required to understand puppeteer tutorial. The entire tutorial is segregated into the below articles. 

Puppeteer Tutorial

Tosca Tutorial #1: Puppeteer Overview

Tosca Tutorial #2: Puppeteer Environment Variables

Tosca Tutorial #3: Puppeteer Web Scraping and Puppeteer Test Automation Overview

Tosca Tutorial #4: Install Puppeteer

Tosca Tutorial #5: Sample Puppeteer Project

Tosca Tutorial #6: Puppeteer Automation Testing

In this “Puppeteer Automation Testing” tutorial, we will explain the detailed steps for Puppeteer Automation from the beginning. Below features will be explained to understand Puppeteer Automation testing from scratch –

· Install Puppeteer

· Launch Web Application

· Identify object properties from the Chrome Browser

· Form Submission steps – Enter text, Click event, Verification

· Screenshot capture

· Execute scripts for Puppeteer Automation

Puppeteer Automation

Testing is required to ensure the quality of software products. There are multiple levels of testing defined in the software development processes. To test the functionalities of a software, can be done manually or through automated process. The main purposes of automated software testing are –

  • Fast test execution cycle.
  • Avoid the chances of human errors.
  • Reduce the test execution timing.
  • Reduce the release cycle time.
  • Cove more functionality with out compromising with quality.
  • Multiple execution can be done parallelly.

 Puppeteer is a javascript based Node library that gives a high-level application interface(API) to control the Chrome web browser over the Chrome DevTools protocol. Most of the manual operations performed in the Chrome browser can be automated using Puppeteer. So, the Puppeteer is a good choice for unit testing on web applications fast and easier way. 

Puppeteer Automation Testing Approach:

The steps involved with Puppeteer Automation Testing are explained below – 

Step1# Identify Functional Test Scenario:

We will show the step by step approach to performing Puppeteer automation for the below scenario – 

· Launch the Web Browser.

· Invoke Amazon Web application.

  • Search for the book “Testing Book”.
  • Add the book into the cart from the result.
  • Open cart and check if the book is available in the cart.
  • Capture screen and close the browser.

Step2# Install Puppeteer and Create Test Case:

Create an empty javascript file as “sample_script.js” in a specific folder. Here, we will consider the root folder as SampleProject. To install Puppeteer, we will use the command – “npm install puppeteer”. The installation procedure takes some time based on the network speed. It will download approximately 350MBs of data. After installation, the node_modules folder, which contains different puppeteer components and package-lock.json file, will be created to the sample Puppeteer project root folder.

Step3# Capture Identification Properties of the Test Object:

We can capture the identification properties using the Developers Tool of Chrome web browser. Analyzing the different properties such as, id, name, XPath, etc., we will pick the correct one which can be used in the scripting to perform any operations. In this “Puppeteer Automation Testing” tutorial, we will use the XPath in the script. Below steps to follow to get the XPATH or any other properties,

1. Open Developer Tools which available under “Menu -> More tools”, and go to Elements tab.

2. Using the Finder tool (clicking on arrow icon available in the left top corner of the Elements tab), highlight the test object from the application. Here, we will inspect the search box.

Puppeteer Automation Testing - Open Chrome Developer tool
Puppeteer Automation Testing – Open Chrome Developer tool

3. Analyze the highlighted source code to identify desire properties. To get the XPATH property of the test object, right-click on the highlighted section and click on “Copy-> Copy Xpath” to copy the XPATH property in the clipboard.

Puppeteer Automation Testing - Copy XPath
Puppeteer Automation Testing – Copy XPath

4. Now, paste the Xpath in the finder textbox and press enter to check if the Xpath is identifying the object uniquely.

Puppeteer Automation Testing - Check XPath
Puppeteer Automation Testing – Check XPath

5. Similarly, we need to capture the identification properties for another test object as well.

Step4# Puppeteer Automation Development Steps:

In order to complete the test case, we need to perform certain operations on web pages. For each of the operation, there are different methods available. The methods which are used in our scenario for “Puppeteer Automation Testing” are explained here.

Launch Application – After including the puppeteer, we need to launch the browser using the puppeteer—launch method. An object reference can be passed to this method to define for headless or headful browser. Then we need to create the instance of the web browser which is required to navigate the URL. Here, the async function is used to use the await keyword to handle the web synchronizer.

//Include the puppeteer package
const puppeteer = require('puppeteer'); 
 (async () => {
    //launching the headless browser
    const browser = await puppeteer.launch({ headless: true });
   //Create instance of the browser
    const page = await browser.newPage();
   //Navigate to the url
    await page.goto('https://www.amazon.in/');
  })()

The entire testing will be done in a headless browser. If we want to open the headful browser, we need to pass the object to the launch method as “{headless: false}”.

Check the existence – We need to use the method page.waitForXpath which will check the existence of the Xpath and return the reference of the test object. By testing the return reference, we can add a verification point in the test case.

\tlet searchBox = await page.waitForXPath("//*[@id='twotabsearchtextbox']",{ visible: true });
\tif (searchBox === null) //Verification of the test object
\t{
\t\tconsole.log('Amazon screen is not displayed');
\t}

Enter Data – Using the type method of that object reference, we can enter the text.

await searchBox.type("Testing Book");

Click on Element  – Similarly, using the click method of any object reference, we can perform click operations.

let btnSearch = await page.waitForXPath("//*/input[@id='nav-search-submit-button']",{visible:true });
btnSearch.click();

Print message in the console  – Using the method console.log, we can print any message in the console as output.

console.log(‘Console lag has been generated’);

Refer to the new tab – Using the methods page.target and browser.waitforTarget, we can check and store the reference about new tab into a variable.

\tconst pageTarget = page.target();
\tconst newTarget = await browser.waitForTarget(target => target.opener() === pageTarget);
\t//get the new page object:
\tconst page2 = await newTarget.page();

Capture Screenshot – Using the method page. Screenshot, a snapshot of the particular page has been taken and save as per the file name provided as an argument.

await page.screenshot({ path: ‘screenshot1.png’ });

Close Page and Browser – Using the method close, we can close both the web page and the browser.

\tawait page.close();
\tawait browser.close();

Wait Time – In certain cases, there is a requirement to wait for page loading or finishing of any dependant task; we need to pause the execution for a pre-defined time. To perform this, we can use the page.waitForTimeout method which can pause the execution based on the value (in mili-seconds) passed through the argument.

await page.waitForTimeout(2000);

Now we have learned about the basic technical steps to automate our functional scenario. Based on the knowledge, we can go through the Puppeteer Automation test case below. The detailed overview of the most frequently used classes and methods will be explained in subsequent posts.

/**
 * @name Amazon search
 */
const puppeteer = require('puppeteer');
const reportPath = 'C:\\\\LambdaGeeks\\\\puppteer_proj_sample\\\\output\\\\';
const screenshot = 'screen1.png';
// Used to export the file into a .docx file
try {
  (async () => {
    const browser = await puppeteer.launch({ headless: false });
    const pageNew = await browser.newPage()
    await pageNew.setViewport({ width: 1280, height: 800 });
    await pageNew.goto('https://www.amazon.in/');
\t//Enter Search criteria
\tlet searchBox = await page.waitForXPath("//*[@id='twotabsearchtextbox']",{ visible: true });
\tif (searchBox === null)
\t{
\t\tconsole.log('Amazon screen is not displayed');
\t}
\telse{\t\t
\t\tawait searchBox.type("Testing Book");
\t\tconsole.log('Search criteria has been entered');
\t} \t\t
\t//Clicked on search button
\tlet btnSearch = await pageNew.waitForXPath("//*/input[@id='nav-search-submit-button']",{ visible: true });
\tif (btnSearch === null)
\t{
\t\tconsole.log('Search button is not showing');
\t}
\telse{
\t\tawait btnSearch.click();
\t\tconsole.log('Clicked on search button');
\t}\t
\t//Click on specific search result
\tlet myBook = await pageNew.waitForXPath("//*[contains(text(),'Selenium Testing Tools Cookbook Second Edition')]",{ visible: true })
\tif (myBook === null)
\t{
\t\tconsole.log('Book is not available');
\t}
\telse{
\t\tawait myBook.click();
\t\tconsole.log('Click on specific book to order');
\t} \t
\t// Identify if the new tab has opened
\tconst pageTarget = pageNew.target();
\tconst newTarget = await browser.waitForTarget(target => target.opener() === pageTarget);
\t//get the new page object:
\tconst page2 = await newTarget.pageNew();\t
\tawait page2.setViewport({ width: 1280, height: 800 });
\t
\t//Add to cart
\tlet addToCart = await page2.waitForXPath("//*/input[@id='add-to-cart-button']",{ visible: true });
\tif (addToCart === null)
\t{
\t\tconsole.log('Add to cart button is not available');
\t}
\telse{
\t\tconsole.log('Click on add to Cart button');
\t\tawait addToCart.click();\t\t
\t} \t\t
\t//Verify add to cart process\t
\tlet successMessage = await page2.waitForXPath("//*[contains(text(),'Added to Cart')]",{ visible: true });
\tif (successMessage === null)
\t{
\t\tconsole.log('Item is not added to cart');
\t}
\telse{
\t\tconsole.log('Item is added to cart successfully');\t\t
\t} \t\t
\t// Capture no of cart
\tlet cartCount = await page2.waitForXPath("//*/span[@id='nav-cart-count']",{ visible: true});
\tlet value = await page2.evaluate(el => el.textContent, cartCount)
\tconsole.log('Cart count: ' + value);
\tcartCount.focus();
\tawait page2.screenshot({ path: screenshot });
\t
\tawait pageNew.waitForTimeout(2000);    
\tawait page2.close();
\tawait pageNew.close();
    await browser.close();
  })()
} catch (err) {
  console.error(err)
}

Step5# Puppeteer Automation Test Execution:

We can initiate the execution using the command node sample_script.js through the command prompt. During the execution, Chromium browser will be opened and automatically performed the functional steps and store the screenshot of the final page. The screenshot and the console output will look like below.

Puppeteer Automation Testing - Console Output
Puppeteer Automation Testing – Console Output
Puppeteer Automation Testing - Captured Screen
Puppeteer Automation Testing – Captured Screen

Conclusion:

Throughout this Puppeteer Automation Testing Tutorial, we have learned about the detailed steps on Puppeteer Automation Testing. In the next Puppeteer tutorial, we will learn about the detailed overview of the most frequently used puppeteer classes and methods. Please click here to visit the reference portal for this Puppeteer Tutorial. 

Install Puppeteer – An Excellent Learning Guide of Puppeteer Tutorial 4 & 5

Puppeteer tutorial Install NodeJs

Puppeteer is an open-source node js library that can be used for web scraping tools. It can also be used to perform test automation in web applications. Now-a-days, the usage of Puppeteer is getting increased rapidly in the automated software testing space. Basic knowledge of command line, Javascript, and HTML DOM structure is required to understand puppeteer tutorial. The entire tutorial is segregated into the below articles. 

Puppeteer Tutorial

Tosca Tutorial #1: Puppeteer Overview

Tosca Tutorial #2: Puppeteer Environment Variables

Tosca Tutorial #3: Puppeteer Web Scraping and Puppeteer Test Automation Overview

Tosca Tutorial #4: Install Puppeteer

Tosca Tutorial #5: Sample Puppeteer Project

In this Puppeteer Tutorial, we will learn about the steps to install Puppeteer with its dependencies such as install NodeJs, install editor for Puppeteer, etc. Also, after installation, we will create and execute one sample Puppeteer project.

Install Puppeteer

To start the development of Puppeteer scripts, we need to install and configure the below components – 

1. Install NodeJS

2. Install Editor

3. Install Puppeteer

Install NodeJS:

NodeJs is a free open source server environment which can be run in different platforms. It uses javascript in the server side. The Puppeteer is one kind of NodeJS application. So the first step of Puppeteer setup is to install the NodeJS framework. The NodeJS framework is available for multiple platforms, including Windows, Ubuntu, macOS, etc. In this context, we will work on the version for 64 bit Windows operating system. The steps to install NodeJS are –

Step1# Download NodeJS: Click here to navigate the NodeJS download link. Here, we will download the 64 bit windows installer (.mts). 

Puppeteer tutorial - Install NodeJs
Puppeteer tutorial – Install NodeJs

Step2# Install NodeJS: After completion of the download, we need to install NodeJs by double-clicking on the installer(.msi) file. During the installation, we need to proceed according to instructions.

Step3# Verify NodeJS: After the completion of the installation, we need to open the command prompt and enter the command as “node”. If the below details are appearing, the installation is correct. In case, if there is any error appears, that means installation is not correct.

Puppeteer tutorial - Verify NodeJs
Puppeteer tutorial – Verify NodeJs

Install Editor for Puppeteer:

An editor is nothing but a tool that helps us to write, compile and run our Puppeteer codes. There many tools are available which can be used as a java code editor which includes Visual Studio Code, Note Pad ++, Edit Plus, etc. Even we can write puppeteer code in the default “Note Pad” application as well. In this “Install Puppeteer” tutorial, we will use VSCode as it’s free and easily compatible with NodeJS Application. VSCode is nothing but one component of visual studio, which is available for free. Steps to install VSCode are – 

Step1# Downloadd VSCode: Click here to open the download link and download the desire version of VSCode Installer as per the operating system.

Step2# Install VSCode: Install VSCode from the installer file in the system just like any other software. During the installation, proceed with recommended setting only.

Step2# Verify VSCode: After the completion of the installation, open the application to check whether it’s installed correctly.

Puppeteer tutorial - Editor for Puppeteer
Puppeteer tutorial – Editor for Puppeteer

Install Puppeteer Packages:

From the version v1.7.0 of puppeteer, every release contains below two packages –

  • puppeteer-core package
  • puppeteer package

Both the versions of Puppeteer can be installed using the console commands. The commands to install Puppeteer are – 

Install Puppeteer-core Package: It’s a collection of Node JS library which is developed in Java. It has the ability to work on devtools protocol. The Chromium browser is not getting downloaded while installing the puppeteer-core package. The programmatic interface of Puppeteer completely drives the puppeteer-core library. Another important limitation is that the puppeteer-core features can’t be altered by changing any of the PUPPETEER_* environment variables. 

Installation Command: npm install puppeteer-core

Note: The Node JS tool need to be installed before installing the puppeteer-core package.

Install Puppeteer Product Package: Puppeteer is the complete product which is developed by Google to controls the Chrome browsers. Being the complete Puppeteer product package, the latest versions of chromium browser is getting downloaded during the installation. After that the installation is driven by puppeteer-core. It’s possible to customize the Puppeteer features by changing the PUPPETEER_* environment variables. 

Installation Command: npm install puppeteer

In this “Install Puppeteer” tutorial, we will work on the Puppeteer package installation as there are not many differences between these two versions.

Sample Puppeteer Project

The Puppeteer is compatible with both headful (non-headless) and headless chrome browsers. In case of headless, the browser activities are performed in the background i.e. the browser UI is not visible to us.  It make the thing (controlling the browser) simpler and easier in single step. It means, same thing(controlling the browsers) can be done with multiple complex steps.

The steps involved in setup sample Puppeteer project are shown below – 

Step1# Create a folder structure for Sample Puppeteer Project: Create a sample root directory with the name “SampleProject” in a pre-defined path. This root directory will be acted as a Sample Puppeteer Project. Next, after opening the command prompt, we need to navigate to this root directory.

Step2# Install Puppeteer: Using the below command, we can install the full package of Puppeteer in the root directory. This command basically downloads all the open-source NodeJS libraries in the sample project folder. The installation procedure takes some time based on the network speed. It will download approximately 350MBs of data. After installation, the node_modules folder, which contains different puppeteer components and package-lock.json file, will be created to the sample Pupeteer project root folder.

Puppeteer tutorial - Installation Log
Puppeteer tutorial – Installation Log

Step3# Create Sample Puppeteer Script: Now, we will write a sample puppeteer script that invokes the LambdaGeeks website, displays console messages after each step, and capture the screenshot. In this example, a headless chromium-browser will be invoked in the background. The sample Puppeteer Script will be – 

const puppeteer = require('puppeteer'); //include Puppeteer Library
 
puppeteer.launch({headless:true}).then(async browser => {
     const pageNew = await browser.newPage(); // Launch browser
     console.log('Step1 - Open Browser'); //Display message
     await pageNew .setViewport({ width: 1280, height: 800 })
     await pageNew .goto('https://lambdageeks.com/'); //Open LambdaGeeks
     //Capture Screenshot
     await pageNew .screenshot({ path: 'screenshot_lambda.png' });
     console.log('Step2 - Navigate LambdaGeeks and take screenshot');
     await browser.close();
     console.log('Step3 - Browser Closed');
 });

This code needs to be stored in the root directory of the Sample puppeteer project with the file name sample_script.js. Incase of Puppeteer-core, we need to include ‘puppeteer-core’ instead of ‘puppeteer’ at the very beginning of the script. For headful browser, we need to replace code “{headless:true}” with “{headless:false}”.

Step4# Execute Sample Puppeteer Script: The sample script can be executed from the command prompt using the below command –

npm node sample_script.js

After the execution, the screenshot will be capture and store in the root directory as “’screenshot_lambda.png”.

Puppeteer tutorial - Sample Puppeteer Project
Puppeteer tutorial – Sample Puppeteer Project

Now we will shown another sample Puppeteer script on amazon web application. This script will perform below steps along with verifications in each steps –

  • Invoke Amazon application.
  • Search a predefined book.
  • Add the searched book into cart.
  • Open cart and check if the book is available in cart.
  • Capture screen and close the browser.

We will only walk through the below script. We will learn in details about different steps to perform in next article. The sample script is shown below –

/**
 * @name Search in Amazon
*/
const puppeteer = require('puppeteer');
const reportPathDir = 'C:\\\\LambdaGeeks\\\\puppteer_proj_sample\\\\output\\\\';
const screenshotFile = 'screen1.png';
try {
  (async () => {
    
\t//Create browser and page object instance and navigate to the URL
    const browserWeb = await puppeteer.launch({ headless: false });
    const pageWeb = await browserWeb.newPage()
    await pageWeb.setViewport({ width: 1280, height: 800 });
    await pageWeb.goto('https://www.amazon.in/');
\t
\t//Enter the amazon Search criteria
\tlet searchBoxAmazon = await pageWeb.waitForXPath("//*/input[@id='twotabsearchtextbox']",{ visible: true });
\tif (searchBoxAmazon === null)
\t{
\t\tconsole.log('Amazon screen is not displayed');
\t}
\telse{\t\t
\t\tawait searchBoxAmazon.type("Testing Book");
\t\tconsole.log('Search criteria has been entered');
\t} \t\t
\t
\t//Clicked on search button
\tlet btnSearchAmazon = await pageWeb.waitForXPath("//*/input[@id='nav-search-submit-button']",{ visible: true });
\tif (btnSearchAmazon === null)
\t{
\t\tconsole.log('Search button is not showing');
\t}
\telse{
\t\tawait btnSearchAmazon.click();
\t\tconsole.log('Clicked on search button');
\t}\t
\t
\t//Click on specific search result
\tlet myBookAmazon = await pageWeb.waitForXPath("//*[contains(text(),'Selenium Testing Tools Cookbook Second Edition')]",{ visible: true })
\tif (myBookAmazon === null)
\t{
\t\tconsole.log('Book is not available');
\t}
\telse{
\t\tawait myBookAmazon.click();
\t\tconsole.log('Click on specific book to order');
\t} \t
\t
\t// Identify if the new tab has opened
\tconst pageTarget = pageWeb.target();
\tconst newTarget = await browserWeb.waitForTarget(target => target.opener() === pageTarget);
\t//get the new page object:
\tconst page2 = await newTarget.page();\t
\tawait page2.setViewport({ width: 1280, height: 800 });
\t
\t//Add to cart
\tlet addToCartAmazon = await page2.waitForXPath("//*/input[@id='add-to-cart-button']",{ visible: true });
\tif (addToCartAmazon === null)
\t{
\t\tconsole.log('Add to cart button is not available');
\t}
\telse{
\t\tconsole.log('Click on add to Cart button');
\t\tawait addToCartAmazon.click();\t\t
\t} \t\t
\t//Verify add to cart process\t
\tlet successMessageAmazon = await page2.waitForXPath("//*[contains(text(),'Added to Cart')]",{ visible: true });
\tif (successMessageAmazon === null)
\t{
\t\tconsole.log('Item is not added to cart');
\t}
\telse{
\t\tconsole.log('Item is added to cart successfully');\t\t
\t} \t
\t
\t// Capture no of cart
\tlet cartCountAmazon = await page2.waitForXPath("//*/span[@id='nav-cart-count']",{ visible: true});
\tlet valueCount = await page2.evaluate(el => el.textContent, cartCountAmazon)
\tconsole.log('Cart count: ' + valueCount);
\tcartCountAmazon.focus();
\tawait page2.screenshot({ path: screenshotFile });
\t
\tawait pageWeb.waitForTimeout(3000);    
\tawait page2.close();
\tawait pageWeb.close();
    await browserWeb.close();
  })()
} catch (e) {
  console.log(e)
}

Note: We will explain the details steps to write scripts in next articles.

Conclusion:

In this introductory article about “Install Puppeteer” from the “Puppeteer Tutorial”, we have explained about the detailed steps to install different Puppeteer packages from the scratch. The puppeteer setup includes different component installations such as, install NodeJs, install VSCode, install Puppeteer, create and execute Puppeteer sample project. In the next Puppeteer tutorial, we will explain detailed steps to use the Puppeteer as a web scraping tool. Please click  here to read from reference portal.

Puppeteer Web Scraping and Test Automation – An Excellent Learning Guide of Puppeteer Tutorial 3

Puppeteer Tutorial Puppeteer Web Scraping 300x139 1

Now-a-days, the Puppeteer is getting more attention as a web scraping tool. Due to the simplicity , the availability as a open-source tool and ability to develop single page application, Puppeteer is getting the popularity. Prior to start learning on Puppeteer web scraping tool, we should have basic understanding of command line, Javascript, and HTML DOM structure. The Puppeteer tutorial has been broken into few articles which are specified in below table of content.

Puppeteer Tutorial

Tosca Tutorial #1: Puppeteer Overview

Tosca Tutorial #2: Puppeteer Environment Variables

Tosca Tutorial #3: Puppeteer Web Scraping and Puppeteer Test Automation Overview

Tosca Tutorial #4: Install Puppeteer 

In this article of Puppeteer Tutorial, we will discuss Puppeteer Web Scraping with an example and Puppeteer Test automation overview. 

Puppeteer Web Scraping

The process of data extraction from any web pages is called web scraping. Web scraping has two steps. Firstly, it fetches the web page and then extracts the data. After data extraction, we can use it for any API or store it in a CSV file. 

Puppeteer is one of the best tools to support web scraping for Google Chrome or Chromium browser. The puppeteer web scraping is explained in details with the below example – 

Basic Puppeteer Web Scraping Example:

Step1# The Puppeteer works on Node JS library. So, the first step is to include the puppeteer library before writing the script for web scraping.

const puppeteerObj = require("puppeteer");

Step2# After including the Puppeteer class, we need to write an async function by using await keyword. It’s required as Puppeteer uses promises. Then call the Puppeteer.launch() method to invoke the browser and call newPage() method to create web page instance.

const browserWeb = await puppeteerObj.launch();
const pageWeb = await browserWeb.newPage();

Step3# Now call the page.goto() method to provide the URL of the desired website.

await pageWeb.goto("https://lambdageeks.com/");

Step4# Use the method page.evaluate() to capture the text of any particular element (in this example, we will capture the header text). 

const data = await pageWeb.evaluate(() => {   
const header = document.querySelector(".uabb-heading-text").innerText;
return { header };

We will discuss how to identify any object from the web screen in the upcoming tutorial.

Puppeteer Tutorial - Puppeteer Web Scraping
Puppeteer Tutorial – Puppeteer Web Scraping

Step5# In this last step, we need to process the data and then close the web page. The complete Puppeteer Web Scraping code will be looks like below –

const puppeteer = require("puppeteer");

async function scrap() {
  // Launch the browser
  const browserApp = await puppeteer.launch();
  // Create a page instance
  const pageApp = await browserApp.newPage();
  // invoke the web page for scraping
  await pageApp.goto("https://lambdageeks.com/");

  // Select any web element
const data = await pageApp.evaluate(() => {   
const header = document.querySelector(".uabb-heading-text").innerText;
return { header };

// Here we can do anything with this data. Here displaying the data
console.log(header);

 //We close the browser
  await browserApp.close();
}

Scrap();

Step6# Now, we can execute this puppeteer web scraping code using the command:  node index.js

Note: In the next article, “Install Puppeteer,” we will discuss the installation setup of Puppeteer and execute the above Puppeteer Web Scraping code.

Puppeteer Test Automation Overview

Apart from web scraping, the Puppeteer has the features to perform the below activities as well,

  • Capture the screenshots of web pages.
  • We can save the screen of web page as a pdf file.
  • Automation of manual steps can be achieved to perform UI testing.

So, combining all the above features, we can use the Puppeteer for test automation. To understand the Puppeteer Test Automation, first, we need to familiar with software testing.

Testing overview:

Testing is required to ensure all the software requirements are fulfilled with out any issues. Different types of testing cycles are available from the beginning of the software development process. Software can be tested manually or through the automated approach.

Purposes of software testing are –

  • Verify the quality of the products.
  • Find the bugs of the product before the production deployment.
  • Checking of requirements are satisfied.
  • Testing the product’s performances.

The types of testing are explained here –

Unit Testing – The developers are the responsible to perform unit testing during the code development phase.

Integration Testing – This testing is required after integrating the different components of the software product. The main purpose is to ensure that all the interfaces are working smoothly.

System Testing – It’s a detailed testing which has to be done after the integration to ensure about all the requirements are fulfilled.

User Acceptance Testing – It’s also a detailed testing which has to be done by the end user of the product to ensure the quality.

Regressing Testing – It’s required to ensure the core business process are working smoothly during any software enhancements.

Advantages of Test Automation:

  • Reduce the execution cycle.
  • Avoid the chances of human errors.
  • Minimize the test execution efforts.
  • Fast software release.
  • Increase the testing coverage to reduce the risk.
  • Ability to perform parallel execution.

Why Puppeteer?

Most of the manual operations performed in the Chrome browser can be automated using Puppeteer. So, the Puppeteer is a good choice for unit testing on web applications fast and easier way. 

The limitations of Puppeteer as an automation testing tool are –

  • Only supports Chrome and Chromium browser.
  • Coss-browser testing is not possible.
  • Mobile testing can not be done.

Headless Chrome Testing:

The headless browser means the Puppeteer is interacting with a chrome browser as a background application, which means that the chrome UI is not visible on the screen. So, the headless chrome testing means the automation testing is to be performed in a hidden browser. Also, after the headless chrome testing, the Puppeteer is able to capture the web screen properly.

Puppeteer vs Selenium

The comparison between Puppeteer and Selenium as an automation testing tool are explained below –

  • Programming language support – Puppeteer supports only JavaScript, where Selenium support Java, Python, Node.js, and C# languages.
  • Browser Support – Puppeteer is applicable only for Chrome or Chromium browser, but Selenium supports Chrome, Mozilla, Safari, IE, Opera browsers as well.
  • Community Support – Community support restricted to Google Groups, GitHub, and Stack Overflow for the Puppeteer. But for Selenium, wide community support over multiple forums is available.
  • Execution Speed – Execution of Puppeteer script is faster than Selenium.
  • Installation and Setup – Puppeteer installation and setup is a more easy and simple process.
  • Cross-Platform Support – Puppeteer does not support it, but Selenium can.
  • Recording – Recording features are not available in Puppeteer. But this feature is available for Selenium IDE.
  • Screenshots – Puppeteer has the capability to take a screenshot as an image or pdf format, where Selenium can support only image format.
  • Testing Platform Support – Puppeteer only supports web browsers, but Selenium can automate web and mobile with Appium.
  • Coding Skills – It is required for Puppeteer Selenium Web driver but not for Selenium IDE.

Based on the above comparison, we can conclude that Puppeteer will make the best choice when we have to perform unit level testing for any web application where a fast and flexible solution is required. The other tool, Selenium will be the better choice when there is a need for mobile application and cross-platform application testing. Click here to learn Selenium from LambdaGeeks.

Conclusion:

In this introductory article on Puppeteer Tutorial, we have learned about Puppeteer Web Scraping and Puppeteer Test Automation overview. We will learn about the step by step guide to install Puppeteer and execute a small script in the next Puppeteer article. Please click here to visit the reference portal for this Puppeteer Tutorial.

Puppeteer Tutorial– An Excellent Learning Guide of Puppeteer Tutorial 1 & 2

Puppeteer Tutorial Puppeteer 209x300 1

The Puppeteer is an open-sourced java framework which is developed with node-js library. The Puppeteer has the ability to work as a web scraping tool. It can be also used as a test automation for web based applications just like selenium web driver. The popularity of Puppeteer is getting increased rapidly for test automation. The pre-requisites to walk through the Puppeteer Tutorial, are basic knowledge of command line, JavaScript, OOPs concept and HTML DOM structure. The complete Puppeteer tutorial is distributed into topics which are mentioned in the below table of content. 

Puppeteer Tutorial

Tosca Tutorial #1: Puppeteer Overview

Tosca Tutorial #2: Puppeteer Environment Variables

Tosca Tutorial #3: Puppeteer Web Scraping and Puppeteer Test Automation Overview

Tosca Tutorial #4: Install Puppeteer 

In this article of Puppeteer Tutorial, we will explain about Puppeteer Overview and Puppeteer Environment Variables. 

Puppeteer Overview

The Puppeteer is an open-sourced java framework which is developed with node-js library. Puppeteer is able to control Chrome browser over the devtool protocol with the help of the high-level application interface(API). The Puppeteer is able to control both headful and headless chrome browsers. 

The Puppeteer framework is introduced by Google. As per the functionality, it’s not a new concept. But it make the work easier. Fundamentally, it summaries a list of activities through a compacted package.

Puppeteer Tutorial - Puppeteer
Puppeteer Tutorial – Puppeteer

How do Puppeteers work?

  • Puppeteer uses the Node JS library.
  • The Node JS allows to use the high-level APIs.
  • The APIs are capable of controlling the Chrome browser over devtool protocol.
  • By default, Puppeteer works with headless Chrome browsers but it can interact with headful Chrome browsers as well by changing the default configuration.

Chrome DevTools Protocol:

Using the Chrome DevTools Protocol, tools like Puppeteer are able to instrument, inspect, debug and profile the blink-based browsers such as Chromium, Chrome, etc.

Here, the instrumentation of the browser is divided into a number of domains such as DOM, Debugger, Network, etc. The every domain explains all the different supported commands and the generated events.

Features of Puppeteer:

  • The manual processes through the Chrome browser can be automated.
  • It can captures screenshot of any web page and generates the image or pdf file of the screenshot.
  • A single page application can be developed of server side rendering using the Puppeteer.
  • It can automate the web form submission, UI testing, keyboard input, etc., with checkpoints.
  • It provides more control over the Chrome browser.
  • The default headless mode is very fast.
  • It supports web scraping.
  • Ability to measures rendering and load timing using Chrome performance analysis tools.

Puppeteer vs Puppeteer-core:

Since Puppeteer version v1.7.0, below two packages, are available in every release –

  • puppeteer-core package
  • puppeteer package

Puppeteer-core Package:

Puppeteer-core is a java-base Node library that is able to perform any operation that supports the DevTools protocol. The Puppeteer-core doesn’t download Chromium during the installation. As a library, Puppeteer-core is completely driven through its programmatic interface. Also, the features of Puppeteer-core can’t be customized by all PUPPETEER_* env variables. The basic command to install Puppeteer-core – 

npm install puppeteer-core
# or "yarn add puppeteer-core"

When using puppeteer-core, include statements will be looks like below –

const puppeteer = require('puppeteer-core')

When to use Puppeteer-Core:

  • To develop Puppeteer project to use existing Chrome browser over the DevTools protocol where additional chromium download is not required.
  • To develop another end-user product or library on top of DevTools protocol. For example, one project may build a screenshot generator using puppeteer-core and write a custom setup.js script that downloads headless_shell instead of Chromium to save storage.

Puppeteer Package:

Puppeteer is a complete product for Chrome or Chromium browser automation. During the installation, it downloads the latest version of Chromium, and after that, it was driven by puppeteer-core. As an end-user product, Puppeteer supports all the PUPPETEER_* env variables to customize its behavior. The basic command to install Puppeteer – 

npm install puppeteer
# or "yarn add puppeteer"

When using Puppeteer, include statements that will be looks like below –

puppeteer = require(‘puppeteer’)

Difference between Puppeteer and Puppeteer-core:

  • Puppeteer-core doesn’t download the Chromium browser automatically during installation.
  • Puppeteer-core does not consider all PUPPETEER_* env variables.
  • In most projects, we are using the Puppeteer product package.

Headless Chrome:

Headless chrome means the Puppeteer is interacting with a chrome browser as a background application, which means that the chrome UI is not visible on the screen. By default, Puppeteer launches the application as headless chrome. Code sample to launch Headless Chrome – 

In this example, we are opening the headless chrome, i.e., the Chrome UI will not be visible. It can be done by passing the headless flag as true to the Puppeteer.launch method().

const puppeteer = require('puppeteer');

(async () => {
  const browser = await puppeteer.launch({ headless: true });
  // Specify statements for Headless Chrome operations  
  await browser.close();
})();

Headful Chrome:

Headful chrome means the Puppeteer is interacting with a chrome browser for which chrome UI is visible on the screen. By default, Puppeteer launches the application as headless chrome. Code sample to launch Headful Chrome – 

In this example, we are opening the chrome, which is visible to us. It can be done by passing the headless flag as false to the Puppeteer.launch() method.

const puppeteer = require('puppeteer');

(async () => {
  const browser = await puppeteer.launch({ headless: false});
  // Specify statements for Headless Chrome operations  
  await browser.close();
})();

Puppeteer Environment Variables

Puppeteer works with predefined environment variables to support its operations. If Puppeteer doesn’t find the environment variables during the installation, a lowercased variant of these variables will be used from the npm config (manages the NPM Configurations file). The environment variables are not considered by the Puppeteer-core package. The most important Puppeteer environment variables are – 

  • PUPPETEER_SKIP_CHROMIUM_DOWNLOAD: It instructs not to download bundled Chromium during the installation step.
  • PUPPETEER_DOWNLOAD_HOST: It overwrites URL prefix that can be used to download Chromium. 
  • PUPPETEER_DOWNLOAD_PATH: It overwrites the download folder path. Defaults path is – “<root>/.local-chromium/” where <root> is the package root of puppeteer.
  • HTTP_PROXY, HTTPS_PROXY, NO_PROXY: These variables define the proxy settings to download Chromium during the installation.
  • PUPPETEER_CHROMIUM_REVISION: It defines a specific version of Chromium to be used by the Puppeteer.
  • PUPPETEER_EXECUTABLE_PATH: It specifies an executable path to be used in Puppeteer.launch method. 
  • PUPPETEER_PRODUCT: It defines which browser is to be used by Puppeteer. The value has to be either chrome or firefox. 

Conclusion:

In this introductory article on Puppeteer Tutorial, we have learned about Puppeteer overview and Puppeteer Environment Variables. In the next article of the Puppeteer tutorial, we will learn about the Puppeteer Web Scraping and Puppeteer Test Automation overview. Please click here to visit the reference portal for this Puppeteer Tutorial. Also, please click here to learn Selenium from LambdaGeeks.