Thermal Power Station Coal Power Plants: A Comprehensive Guide

thermal power station coal power plants

Thermal power stations that utilize coal as the primary fuel source are a significant contributor to global electricity generation. These power plants operate by burning coal to heat water, producing steam that drives turbines and generates electricity. The efficiency of these power plants is typically measured by their heat rate, which is the ratio of the amount of heat input to the amount of electricity output. The average, annual operating heat rate of U.S. coal-fired power plants is approximately 10,400 Btu/kWh.

Improving Efficiency through Turbine and Boiler Modifications

One way to enhance the efficiency of coal power plants is through major steam turbine modifications. This can involve the replacement of critical components such as rotors, blades, nozzles, seals, and inner and outer casings. These modifications can lead to improved turbine performance, reduced energy losses, and increased overall efficiency.

Additionally, major boiler modifications can also contribute to efficiency improvements. Optimizing the coal transport, conveying, and grinding processes can enhance boiler performance during various load changes, improving overall efficiency and reducing detrimental conditions of stress on the plant.

The heat rate of a facility is typically based on full-load operation with no boiler blowdown. However, most reported heat rates of operating facilities include performance during off-peak loads and include boiler blowdown. As a result, the reported heat rates are usually significantly higher than the design heat rate.

Quantifying CO2 Emissions from Coal Power Plants
thermal power station coal power plants

Coal power plants are a significant source of CO2 emissions, which is a major concern for their environmental impact. Accurately quantifying and verifying CO2 emissions from these power plants is crucial for understanding their environmental footprint and developing strategies to reduce emissions.

One method for quantifying CO2 emissions from coal power plants is the use of portable Fourier transform infrared (FTIR) spectrometers. These instruments can be used to measure CO2 column concentrations in the atmosphere, providing a means to quantify emissions from individual power plants.

Technical Details and Specifications

Turbine Modifications

  • Rotor replacement: Replacing the turbine rotor can improve efficiency by reducing blade tip clearances, minimizing leakage, and enhancing aerodynamic performance. This can lead to a heat rate improvement of up to 1.5%.
  • Blade replacement: Upgrading the turbine blades with more efficient designs can improve the overall turbine efficiency, resulting in a heat rate reduction of approximately 1%.
  • Nozzle modifications: Optimizing the nozzle geometry and flow path can enhance the steam expansion process, leading to a heat rate improvement of up to 0.5%.
  • Seal upgrades: Improving the sealing of the turbine casing can reduce air and steam leakage, resulting in a heat rate reduction of around 0.5%.
  • Casing modifications: Upgrading the inner and outer turbine casings can minimize heat losses and improve the overall turbine efficiency, contributing to a heat rate improvement of up to 0.5%.

Boiler Modifications

  • Coal transport optimization: Enhancing the coal transport, conveying, and grinding processes can improve the coal particle size distribution, leading to better combustion efficiency and a heat rate reduction of approximately 1%.
  • Combustion optimization: Optimizing the combustion process, including air-fuel ratio, burner configuration, and flame stability, can improve boiler efficiency and reduce heat rate by up to 1%.
  • Soot blowing optimization: Improving the soot blowing system can reduce fouling and slag buildup on the boiler heat transfer surfaces, resulting in a heat rate improvement of around 0.5%.
  • Feedwater heater upgrades: Upgrading the feedwater heaters can increase the temperature of the feedwater entering the boiler, leading to a heat rate reduction of up to 0.5%.

CO2 Emission Quantification

  • FTIR spectrometer measurement: Portable FTIR spectrometers can measure the CO2 column concentration in the atmosphere with an accuracy of ±2% and a precision of ±0.5%.
  • Emission calculation: The measured CO2 column concentration can be used to calculate the total CO2 emissions from the power plant using the following equation:

CO2 Emissions (tonnes/hr) = CO2 Column Concentration (ppm) × Atmospheric Pressure (kPa) × Effective Plume Height (m) × 44.01 / (8.314 × 273.15)

Where:
– CO2 Column Concentration: Measured by the FTIR spectrometer
– Atmospheric Pressure: Obtained from local weather data
– Effective Plume Height: Determined based on the power plant’s stack height and atmospheric conditions

Performance Data

  • Average annual operating heat rate of U.S. coal-fired power plants: 10,400 Btu/kWh
  • Potential heat rate improvements from turbine modifications:
  • Rotor replacement: Up to 1.5%
  • Blade replacement: Approximately 1%
  • Nozzle modifications: Up to 0.5%
  • Seal upgrades: Around 0.5%
  • Casing modifications: Up to 0.5%
  • Potential heat rate improvements from boiler modifications:
  • Coal transport optimization: Approximately 1%
  • Combustion optimization: Up to 1%
  • Soot blowing optimization: Around 0.5%
  • Feedwater heater upgrades: Up to 0.5%
  • FTIR spectrometer measurement accuracy: ±2%
  • FTIR spectrometer measurement precision: ±0.5%

By implementing a combination of these turbine and boiler modifications, coal power plants can significantly improve their overall efficiency and reduce their environmental impact. Additionally, the use of portable FTIR spectrometers provides a reliable method for quantifying and verifying the CO2 emissions from these power plants, enabling the development of effective strategies to mitigate their carbon footprint.

References:

  1. Coal-Fired Thermal Power Plant – an overview | ScienceDirect Topics
  2. Coal-Fired Power Plant Heat Rate Reductions
  3. Quantifying CO2 emissions from a thermal power plant based on CO2 column measurements by portable Fourier transform infrared spectrometry

Comprehensive Guide to Quantifying Global Warming: A Deep Dive into the Data

global warming

Global warming, the gradual increase in the Earth’s average surface temperature due to the enhanced greenhouse effect, is one of the most pressing environmental challenges of our time. To understand the magnitude and urgency of this issue, it is crucial to examine the quantifiable data that underpins our understanding of this phenomenon.

Atmospheric Carbon Dioxide Concentrations

The primary driver of global warming is the increase in atmospheric greenhouse gas concentrations, particularly carbon dioxide (CO2). Since the pre-industrial era, the concentration of CO2 in the atmosphere has risen from around 280 parts per million (ppm) to over 410 ppm, representing a nearly 50% increase.

This rise in CO2 can be attributed to the combustion of fossil fuels, such as coal, oil, and natural gas, as well as changes in land use, such as deforestation. The Keeling Curve, a graph of atmospheric CO2 concentrations measured at the Mauna Loa Observatory in Hawaii, has become an iconic representation of this steady increase over time.

The relationship between atmospheric CO2 concentration and global temperature can be quantified using the concept of climate sensitivity, which is the change in global average surface temperature resulting from a doubling of atmospheric CO2 concentration. The Intergovernmental Panel on Climate Change (IPCC) estimates the equilibrium climate sensitivity to be in the range of 2.5°C to 4°C per doubling of CO2 concentration.

Global Average Surface Temperature

global warming

The global average surface temperature is a widely used metric to measure the effects of climate change. Instrumental records, derived from weather stations, ships, and buoys, provide a continuous record of global temperature dating back to the mid-19th century.

Analysis of these temperature records reveals a clear upward trend in global average surface temperature over the past century. The IPCC’s Sixth Assessment Report states that the average global surface temperature for the 2006-2015 decade was approximately 0.87°C (with a range of 0.75°C to 0.99°C) higher than the average for the second half of the 19th century, which is often used as a proxy for pre-industrial levels.

The rate of global temperature increase has also accelerated in recent decades, with the last four decades being the warmest on record. This warming trend is consistent with the observed increase in atmospheric greenhouse gas concentrations and the enhanced greenhouse effect.

Rising Sea Levels

One of the most tangible consequences of global warming is the rise in global sea levels. As the Earth’s temperature increases, the oceans absorb more than 90% of the additional energy trapped in the climate system, leading to thermal expansion of the oceans and the melting of land-based ice sheets and glaciers.

Satellite-based observations have revealed an increase in the rate of global sea-level rise since the early 1990s. The IPCC’s Sixth Assessment Report estimates that the global mean sea level rose by 0.20 m (with a range of 0.15 to 0.25 m) between 1901 and 2018.

The rate of sea-level rise is not uniform across the globe, with some regions experiencing higher rates of increase than others. For example, sea levels around the United Kingdom are rising at a rate of approximately 1.4 mm per year.

Changes in the Cryosphere

The cryosphere, which includes the Earth’s ice sheets, glaciers, sea ice, and permafrost, is a crucial component of the climate system. Observations from satellite and in-situ measurements have revealed significant changes in the cryosphere, which are closely linked to global warming.

Arctic Sea Ice Extent

Satellite-based observations show a clear downward trend in Arctic sea-ice extent in all months of the year. The September Arctic sea-ice extent, which represents the annual minimum, has decreased by approximately 13% per decade since 1979. Additionally, the ice in the Arctic has become both thinner and younger, with the fraction of Arctic sea-ice area that is more than 5-years old decreasing by 90% over the same period.

Ice Sheets and Glaciers

The Greenland and Antarctic ice sheets have experienced significant mass loss, contributing to the observed global sea-level rise. Glaciers around the world have also been shrinking, with the global glacier mass balance (the difference between accumulation and ablation) being predominantly negative in recent decades.

Permafrost

Areas of permafrost, the perennially frozen ground found in high-latitude and high-altitude regions, have also been affected by global warming. Measurements have shown that permafrost temperatures have reached record high levels, with some areas experiencing thawing and degradation.

These changes in the cryosphere have far-reaching implications, including impacts on local ecosystems, sea-level rise, and the global climate system.

Conclusion

The quantifiable data on global warming, including the significant increase in atmospheric carbon dioxide concentrations, the rising trend in global average surface temperature, the accelerating rate of sea-level rise, and the alarming changes in the Earth’s cryosphere, provide a clear and compelling picture of the ongoing climate crisis. These data points underscore the urgent need for comprehensive and coordinated action to mitigate the impacts of climate change and safeguard the future of our planet.

References

  1. Aber, J. (2023). Quantitative Reasoning with Climate Data. [online] Less Heat More Light. Available at: https://lessheatmorelight.substack.com/p/quantitative-reasoning-with-climate.
  2. Quantifying the human cost of global warming. (2023). Nature Sustainability. https://www.nature.com/articles/s41893-023-01132-6
  3. Measuring a warming world – Climate Change Committee. (n.d.). [online] Available at: https://www.theccc.org.uk/what-is-climate-change/measuring-a-warming-world-2/.

Comprehensive Guide to Ozone Generator Ozonator: Mastering the Metrics and Measurements

ozone generator ozonator

Ozone generators, also known as ozonators, are essential devices used in a wide range of applications, from water treatment and air purification to industrial processes. Understanding the various metrics and measurements associated with these devices is crucial for ensuring their proper operation, maintenance, and optimization. In this comprehensive guide, we will delve into the intricacies of ozone generator ozonators, exploring the key data points, calculations, and additional considerations that every physics student should be familiar with.

Ozone Generator Output Units

The output of an ozone generator is typically measured in the following units:

  1. g/hr = grams per hour: This unit measures the weight of ozone produced by the generator in grams per hour. It is the most common and widely used metric for quantifying ozone output.

  2. mg/hr = milligrams per hour: This unit is used to measure the output of smaller ozone generators. 1 g/hr of ozone is equivalent to 1,000 mg/hr.

  3. kg/hr = kilograms per hour: This unit is used to measure the output of very large ozone generators. 1 kg/hr of ozone is equivalent to 1,000 g/hr.

  4. lb/day = pounds per day: This unit is used to measure the output of large ozone generators in English units. 1 lb/day of ozone is equivalent to 18.89 g/hr.

Ozone Concentration Units

ozone generator ozonator

The concentration of ozone produced by the generator can be measured in the following units:

  1. wt% = percent by weight: This unit refers to the percentage of ozone gas in a given volume by weight.

  2. g/m3 = grams per cubic meter: This is the best method to quantify the concentration of ozone produced by the generator. It provides a direct measurement of the ozone density in the output stream.

  3. ug/ml = micrograms per milliliter: This unit is used to measure the concentration of ozone in some applications. 1 ug/ml of ozone is equivalent to 1 g/m3.

  4. ppm = parts per million: This unit is used to measure the concentration of ozone in ambient air. 1 ppm of ozone is equivalent to 1 mg/l in water.

Flow Measurements for Feed-gas (Air or Oxygen)

The flow rate of the feed-gas (air or oxygen) entering the ozone generator is measured in the following units:

  1. LPM = liters per minute: This is the metric measurement of the feed-gas flow rate through the ozone generator.

  2. SCFH = standard cubic feet per hour: This is the English measurement of the feed-gas flow rate through the ozone generator.

  3. m3/hr = cubic meters per hour: This is the metric measurement of the feed-gas flow rate through the ozone generator, primarily used for large-scale flow rates and ozone generators.

Calculations

To determine the ozone output and concentration, you can use the following formulas:

  1. Ozone production calculation:
    [
    mg/hr = (m3/min \times 60) \times (ppm \times 2.14)
    ]
    Example:
    [
    mg/hr = (3 m3/min \times 60) \times (10 ppm \times 2.14) = 3,852 mg/hr
    ]

  2. Ozone output from % by weight:
    [
    Ozone Output (g/hr) = ((lpm \times 0.001) \times 60) \times (14.3 \times % by weight)
    ]
    Example:
    [
    Ozone Output (g/hr) = ((10 lpm \times 0.001) \times 60) \times (14.3 \times 0.26%) = 2 g/hr
    ]

  3. Ozone output from g/m3:
    [
    Ozone Output (g/hr) = ((lpm \times 60) \times 0.001) \times g/m3
    ]
    Example:
    [
    Ozone Output (g/hr) = ((10 lpm \times 60) \times 0.001) \times 1573 ppm = 2 g/hr
    ]

Additional Data Points

To accurately measure and monitor the performance of an ozone generator ozonator, the following additional data points are essential:

  1. Ozone analyzer: This device is used to measure the ozone concentration in the air leaving the ozone generator. Ideally, a UV-based ozone analyzer is used for greater precision and accuracy.

  2. Manometer: This instrument is used to measure the airflow by measuring the velocity of the airflow in the flow tube.

  3. Flow tube: This is a specially constructed tube designed to measure the airflow from the ozone generator, ensuring minimal turbulence to accurately measure the air speed.

By understanding these metrics and measurements, physics students can effectively analyze, troubleshoot, and optimize the performance of ozone generator ozonators in various applications. This knowledge is crucial for designing, maintaining, and improving ozone-based systems, whether in water treatment, air purification, or industrial processes.

References

  1. https://www.oxidationtech.com/ozone/ozone-calculations/ozone-units.html
  2. https://www.oxidationtech.com/blog/how-to-measure-output-of-commercial-ozone-generators/
  3. https://ozonesolutions.com/blog/measuring-o3-output/

The Comprehensive Guide to Binding Energy: A Detailed Exploration

binding energy

Binding energy is a fundamental concept in physics, particularly in the study of atomic and nuclear systems. It is defined as the energy required to hold together the constituents of a system, such as the particles within an atomic nucleus or the electrons surrounding an atomic nucleus. Understanding binding energy is crucial for comprehending the stability, structure, and behavior of atoms, molecules, and nuclei.

Binding Energy Formula

The formula for calculating the binding energy (BE) of a nucleus is given by:

[BE = [Z \times m_p + (A – Z) \times m_n – m] \times c^2]

where:
– (Z) is the number of protons
– (m_p) is the mass of a proton
– (A) is the atomic mass number (sum of protons and neutrons)
– (m_n) is the mass of a neutron
– (m) is the measured mass of the nucleus
– (c) is the speed of light

Example Calculations

binding energy

Carbon-12 Nucleus

  • (Z = 6) (number of protons)
  • (N = 6) (number of neutrons)
  • (A = 12)
  • (m_p = 1.00728) amu (atomic mass units)
  • (m_n = 1.00867) amu
  • (m = 12.00000) amu

[BE = (6 \times 1.00728 + 6 \times 1.00867 – 12.00000) \times (3.00 \times 10^8)^2]
[BE \approx 8.610 \times 10^{15}] Joules

Uranium-235 Fission

  • (Z = 92) (number of protons)
  • (N = 143) (number of neutrons)
  • (A = 235)
  • (m_p = 1.00728) amu
  • (m_n = 1.00867) amu
  • (m = 235.00000) amu

[BE = (92 \times 1.00728 + 143 \times 1.00867 – 235.00000) \times (3.00 \times 10^8)^2]
[BE \approx 1.83 \times 10^{17}] Joules

Binding Energy Graphs and Comparisons

Proton-Proton Chain vs. Uranium-235 Fission

  • Proton-proton chain: 7.1 MeV per nucleon
  • Uranium-235 fission: 7.6 MeV per nucleon
  • Energy released per nucleon: 6.2 MeV more in proton-proton chain

Fusion of H-1 and H-2 into He-3

  • Binding energy per nucleon of reactants (H-1 and H-2): 1.1 MeV
  • Binding energy of product (He-3): 2.9 MeV
  • Energy released: 1.8 MeV (2.9 MeV – 1.1 MeV)

Mass Defect and Binding Energy

Mass Defect

  • The difference between the sum of the masses of individual nucleons and the measured mass of the nucleus
  • (\Delta m = m_p + m_n – m)
  • (\Delta m = \frac{BE}{c^2})

Example: Deuterium

  • (m_p = 938) MeV/(c^2)
  • (m_n = 939.5654133(58)) MeV/(c^2)
  • (m_D = 1875.612794(47)) MeV/(c^2)
  • (\Delta m = 2.224) MeV/(c^2)
  • (BE = \Delta m \times c^2 = 2.224 \times (3.00 \times 10^8)^2 \approx 2.224 \times 10^{17}) Joules

Additional Details and Insights

  1. Binding Energy and Nuclear Stability: The binding energy of a nucleus is directly related to its stability. Nuclei with higher binding energies per nucleon are more stable and less likely to undergo radioactive decay or fission.

  2. Binding Energy and Nuclear Reactions: The release or absorption of energy in nuclear reactions is directly related to the change in binding energy. Exothermic reactions, such as nuclear fusion, release energy, while endothermic reactions, such as nuclear fission, absorb energy.

  3. Binding Energy and Nuclear Fission: In the process of nuclear fission, the binding energy of the resulting lighter nuclei is higher than the binding energy of the original heavy nucleus, leading to the release of a significant amount of energy.

  4. Binding Energy and Nuclear Fusion: In the process of nuclear fusion, the binding energy of the resulting heavier nucleus is higher than the binding energy of the original lighter nuclei, also leading to the release of a significant amount of energy.

  5. Binding Energy and Atomic Structure: The binding energy of electrons in an atom is also an important concept, as it determines the energy required to remove an electron from the atom, known as the ionization energy.

  6. Binding Energy and Atomic Spectra: The binding energy of electrons in an atom is also related to the energy levels and the corresponding wavelengths of the emitted or absorbed photons in atomic spectra.

  7. Binding Energy and Nuclear Astrophysics: The study of binding energy is crucial in understanding the processes that occur in stars, such as nucleosynthesis, where heavier elements are formed through nuclear fusion reactions.

  8. Binding Energy and Nuclear Medicine: The understanding of binding energy is essential in the field of nuclear medicine, where radioactive isotopes are used for diagnostic and therapeutic purposes, such as in positron emission tomography (PET) and targeted cancer treatments.

  9. Binding Energy and Nuclear Weapons: The release of binding energy in nuclear fission and fusion reactions is the basis for the tremendous destructive power of nuclear weapons, making the understanding of binding energy a critical aspect of nuclear nonproliferation efforts.

  10. Binding Energy and Nuclear Energy: The controlled release of binding energy in nuclear reactors is the foundation of nuclear power generation, which is an important source of clean and efficient energy in the modern world.

Reference:

  1. https://www.geeksforgeeks.org/binding-energy/
  2. https://www.scienceflip.com.au/subjects/physics/fromtheuniversetotheatom/learn13/
  3. http://www.phys.unsw.edu.au/einsteinlight/jw/module5_binding.htm
  4. https://en.wikipedia.org/wiki/Nuclear_binding_energy

The Comprehensive Guide to Acid Rain Effects: A Detailed Exploration

acid rain effects

Acid rain is a significant environmental issue that has far-reaching consequences on various aspects of our ecosystem. From degrading water quality to damaging soil health and ecosystems, the effects of acid rain are both measurable and quantifiable. This comprehensive guide delves into the intricate details of how acid rain impacts our world, providing a valuable resource for science students and enthusiasts alike.

The Impact of Acid Rain on Water Quality

Acid rain can dramatically alter the pH levels of lakes, streams, and other water bodies, making them more acidic. This increase in acidity can have severe consequences for aquatic life. Let’s explore the specific data points and quantifiable effects:

  1. pH Levels: A study conducted in the Adirondack Mountains of New York found that the pH of some lakes had dropped from a neutral 6.5 to a highly acidic 4.5 due to the influence of acid rain. This dramatic shift in pH can be calculated using the pH scale, which is a logarithmic scale that measures the concentration of hydrogen ions (H+) in a solution.

  2. Fish and Aquatic Life: The increased acidity caused by acid rain can be detrimental to fish and other aquatic organisms. A study in Norway revealed that 17% of lakes with a pH below 5 had no fish present, compared to only 2% of lakes with a pH above 5. This highlights the direct correlation between the pH level and the survival of aquatic life.

  3. Aquatic Ecosystem Disruption: The changes in pH levels due to acid rain can disrupt the delicate balance of aquatic ecosystems. For example, the release of aluminum from the soil, which can occur due to acid rain, can be toxic to aquatic plants and animals. This can lead to a cascading effect, where the loss of one species can impact the entire food web.

  4. Quantifying Acid Rain’s Impact: Researchers have developed mathematical models and equations to quantify the relationship between acid rain and water quality. One such equation is the Acid Neutralizing Capacity (ANC), which measures the ability of a water body to resist changes in pH. A lower ANC value indicates a higher susceptibility to the effects of acid rain.

The Impact of Acid Rain on Soil Health

acid rain effects

Acid rain can have a significant impact on the health and fertility of soils, which are essential for plant growth and ecosystem balance. Let’s dive into the specific data points and quantifiable effects:

  1. Nutrient Depletion: Acid rain can leach important nutrients, such as calcium and magnesium, from the soil. A study in the United Kingdom found that acid rain had reduced the concentration of calcium in the soil by up to 50%. This depletion of essential nutrients can lead to reduced plant growth and increased susceptibility to disease.

  2. Soil pH Changes: The acidity of acid rain can alter the pH of the soil, making it more acidic. This change in pH can affect the availability and uptake of essential nutrients by plants. The relationship between soil pH and nutrient availability can be described by the Liebig’s Law of the Minimum, which states that plant growth is limited by the nutrient that is in the shortest supply.

  3. Aluminum Toxicity: Acid rain can release aluminum from the soil, which can be toxic to plants and other organisms. Aluminum toxicity can inhibit root growth, reduce nutrient uptake, and ultimately lead to the decline of plant health. The specific effects of aluminum toxicity can be quantified using various physiological and biochemical parameters, such as root length, chlorophyll content, and enzyme activity.

  4. Soil Erosion: Acid rain can also contribute to soil erosion by weakening the soil structure and making it more susceptible to weathering and runoff. This can lead to the loss of valuable topsoil, which is essential for plant growth. The rate of soil erosion can be measured using techniques such as sediment trapping and erosion modeling.

The Impact of Acid Rain on Ecosystems

Acid rain can have far-reaching consequences on the delicate balance of ecosystems, affecting both plant and animal life. Let’s explore the specific data points and quantifiable effects:

  1. Forest Decline: Acid rain can damage the leaves and needles of trees, making them more susceptible to disease and pests. A study in Germany found that acid rain had reduced the growth of spruce trees by up to 40%. This decline in tree health can lead to the degradation of entire forest ecosystems.

  2. Biodiversity Loss: The changes in soil and water quality caused by acid rain can lead to the loss of sensitive species, both in terrestrial and aquatic environments. This can disrupt the food web and lead to a decrease in overall biodiversity. Researchers can quantify biodiversity using metrics such as species richness, Shannon-Weiner diversity index, and Jaccard similarity index.

  3. Ecosystem Resilience: Acid rain can reduce the resilience of ecosystems, making them more vulnerable to other environmental stressors. This can be measured by studying the recovery rates of ecosystems after disturbances, as well as the ability of the ecosystem to maintain its essential functions and services.

  4. Bioaccumulation and Biomagnification: Acid rain can lead to the release of toxic substances, such as heavy metals, which can bioaccumulate in the tissues of organisms and biomagnify up the food chain. This can have severe consequences for the health of both wildlife and human populations. The extent of bioaccumulation and biomagnification can be quantified using techniques like tissue analysis and food web modeling.

The Impact of Acid Rain on Materials

Acid rain can also have a significant impact on the built environment, causing damage to buildings, statues, and other materials. Let’s explore the specific data points and quantifiable effects:

  1. Corrosion of Metals: Acid rain can corrode metal surfaces, leading to the degradation of structures and the need for costly repairs. A study in the United States found that acid rain had caused $5 billion in damage to buildings and monuments over a 30-year period. The rate of metal corrosion can be quantified using electrochemical techniques, such as potentiodynamic polarization and electrochemical impedance spectroscopy.

  2. Deterioration of Stone and Masonry: Acid rain can also break down stone and masonry, leading to the erosion and weathering of buildings, statues, and other structures. This can be quantified by measuring the rate of material loss, the changes in surface roughness, and the mechanical properties of the affected materials.

  3. Economic Impacts: The damage caused by acid rain to buildings, monuments, and other materials can have significant economic consequences. Researchers have estimated the costs associated with the repair and maintenance of these structures, as well as the potential loss of cultural and historical heritage.

  4. Mitigation Strategies: To address the impact of acid rain on materials, various mitigation strategies have been developed, such as the use of protective coatings, the selection of more acid-resistant materials, and the implementation of air pollution control measures. The effectiveness of these strategies can be quantified by measuring the reduction in the rate of material degradation and the associated cost savings.

Conclusion

Acid rain is a complex and multifaceted environmental issue that has far-reaching consequences on various aspects of our world. By understanding the specific data points and quantifiable effects of acid rain on water quality, soil health, ecosystems, and materials, we can better appreciate the urgency of addressing this problem and develop effective strategies for mitigation and prevention.

References:

  1. “Acid Rain in the Adirondacks: A Summary of the Science.” Adirondack Council, 2019, www.adirondackcouncil.org/resources/acid-rain-in-the-adirondacks-a-summary-of-the-science/.
  2. “Acid Rain in Norway.” Acid Rain Program, EPA, www.epa.gov/acidrain/effects/norway.html.
  3. “Effects of Acid Rain on Soil.” Acid Rain Program, EPA, www.epa.gov/acidrain/effects/soil.html.
  4. “Acid Rain and Forests.” Acid Rain Program, EPA, www.epa.gov/acidrain/effects/forests.html.
  5. “The Costs of Acid Rain.” Acid Rain Program, EPA, www.epa.gov/acidrain/effects/costs.html.
  6. “Liebig’s Law of the Minimum.” Encyclopedia Britannica, www.britannica.com/science/Liebigs-law-of-the-minimum.
  7. “Biodiversity Metrics.” National Park Service, www.nps.gov/articles/000/biodiversity-metrics.htm.
  8. “Electrochemical Techniques for Corrosion Monitoring and Testing.” NACE International, www.nace.org/resources/general-resources/corrosion-basics/electrochemical-techniques.
  9. “Acid Rain Damage to Buildings and Monuments.” National Park Service, www.nps.gov/articles/000/acid-rain-damage-to-buildings-and-monuments.htm.

The Profound Impact of Ozone Layer Depletion: A Comprehensive Exploration

ozone layer depletion effects

The ozone layer, a crucial component of the Earth’s atmosphere, plays a vital role in shielding us from the sun’s harmful ultraviolet (UV) radiation. However, the depletion of this protective layer has far-reaching consequences that extend beyond the immediate effects on human health. This comprehensive blog post delves into the measurable and quantifiable impacts of ozone layer depletion on human health, the environment, and biogeochemical cycles, providing a detailed and technical exploration for science students.

Human Health Implications

Ozone layer depletion leads to an increase in UVB radiation reaching the Earth’s surface, which can have severe consequences for human health. According to the Atmospheric and Health Effects Framework model used by the EPA, this increased UVB exposure can:

  1. Non-Melanoma Skin Cancer: UVB radiation is a known carcinogen and a major contributor to the development of non-melanoma skin cancers, such as basal cell carcinoma and squamous cell carcinoma. Studies have shown a direct correlation between increased UVB exposure and the incidence of these skin cancers.

  2. Malignant Melanoma: UVB radiation also plays a significant role in the development of malignant melanoma, the most serious form of skin cancer. The International Agency for Research on Cancer (IARC) has classified UVB radiation as a Group 1 carcinogen, meaning it is a proven cause of human cancer.

  3. Cataracts: Exposure to UVB radiation has been linked to the development of cataracts, a leading cause of vision impairment and blindness worldwide. The World Health Organization (WHO) estimates that a 1% decrease in ozone levels could result in an additional 1.6 million cataract cases globally.

To quantify the health benefits of stronger ozone layer protection, the EPA’s Atmospheric and Health Effects Framework model estimates that the Montreal Protocol has prevented millions of skin cancer cases and eye cataracts worldwide.

Plant Responses to Increased UVB Radiation

ozone layer depletion effects

The effects of ozone layer depletion on plants are multifaceted and can have significant implications for ecosystems and biogeochemical cycles. UVB radiation affects the physiological and developmental processes of plants in the following ways:

  1. Direct Effects: UVB radiation can directly impact plant growth, development, and productivity. It can cause damage to DNA, proteins, and cellular structures, leading to reduced photosynthesis, altered plant morphology, and decreased biomass production.

  2. Indirect Effects: UVB radiation can also induce indirect changes in plants, such as alterations in nutrient distribution, developmental phases, and secondary metabolism. These changes can affect plant competitive balance, herbivory, and susceptibility to plant diseases, with cascading effects on the entire ecosystem.

To quantify these effects, researchers have conducted numerous experiments using controlled UV radiation levels. For example, a study published in the Journal of Photochemistry and Photobiology B: Biology found that a 10% increase in UVB radiation can lead to a 3-5% reduction in plant biomass production.

Impacts on Marine Ecosystems

Ozone layer depletion and the resulting increase in UVB radiation also have significant implications for marine ecosystems, particularly for phytoplankton, the foundation of aquatic food webs.

  1. Phytoplankton Survival: Exposure to solar UVB radiation has been shown to reduce the survival rates of phytoplankton. A study published in the journal Marine Biology found that a 10% increase in UVB radiation can lead to a 5-10% decrease in phytoplankton biomass.

  2. Trophic Implications: Reductions in phytoplankton populations can have cascading effects on the entire marine food chain, as these microscopic organisms are the primary producers that support higher trophic levels, such as zooplankton, fish, and marine mammals.

To quantify the impact on marine ecosystems, researchers have developed models that integrate the effects of UVB radiation on phytoplankton and higher trophic levels. For instance, the Biogeochemical Elemental Cycling (BEC) model, used in the Coupled Model Intercomparison Project (CMIP), estimates that a 1% decrease in ozone levels could result in a 0.5-1% reduction in global primary productivity in the oceans.

UVB Radiation and Ozone Layer Depletion

The relationship between ozone layer depletion and increased UVB radiation at the Earth’s surface is well-established. Reduced ozone levels mean less protection from the sun’s harmful rays, leading to higher UVB exposure.

  1. Antarctic Ozone Hole: Studies have shown that in the Antarctic region, the amount of UVB radiation measured at the surface can double during the annual ozone hole event. This dramatic increase in UVB exposure has significant implications for the local ecosystem and human health.

  2. Quantifying UVB Increases: Satellite data from the Total Ozone Mapping Spectrometer (TOMS) has been used to estimate the changes in surface UVB radiation due to ozone depletion. These estimates indicate that a 1% decrease in ozone levels can result in a 2-3% increase in erythemal UVB radiation, which is the type of UVB radiation that causes sunburn and skin damage.

Biogeochemical Cycle Alterations

Ozone layer depletion and the resulting increase in UVB radiation can also have far-reaching consequences for terrestrial and aquatic biogeochemical cycles, affecting both sources and sinks of greenhouse gases.

  1. Terrestrial Biogeochemistry: UVB radiation can alter the decomposition rates of organic matter, the cycling of nutrients, and the production and consumption of greenhouse gases, such as carbon dioxide (CO2) and methane (CH4), in terrestrial ecosystems.

  2. Aquatic Biogeochemistry: In aquatic environments, increased UVB radiation can affect the photochemical and biological processes that govern the cycling of carbon, nitrogen, and other essential elements, with potential impacts on the sequestration and release of greenhouse gases.

To quantify these biogeochemical cycle alterations, researchers have developed models that integrate the effects of UVB radiation on various ecosystem processes. For example, the Terrestrial Ecosystem Model (TEM) estimates that a 10% increase in UVB radiation could lead to a 2-5% change in the net ecosystem exchange of CO2 between the land and the atmosphere.

Aerosols, Pollutants, and Ozone Depletion

The relationship between ozone layer depletion and surface UVB radiation is further complicated by the presence of aerosols and pollutants in the atmosphere. These atmospheric constituents can interact with and modify the effects of UVB radiation.

  1. Satellite Estimates vs. Ground Measurements: Satellite estimates of surface UVB radiation, such as those from the TOMS dataset, have been compared to ground-based measurements. The estimates are generally higher than the ground-based measurements, with differences ranging from 0% at clean sites to 40% at more polluted sites. This suggests that aerosols and pollutants near the ground can significantly influence the amount of UVB radiation reaching the surface.

  2. Aerosol and Pollutant Effects: Aerosols and pollutants can scatter, absorb, or reflect UVB radiation, thereby altering the amount of radiation that reaches the Earth’s surface. The specific effects depend on the type, concentration, and optical properties of the atmospheric constituents.

To better understand these interactions, researchers are developing more sophisticated models that incorporate the effects of aerosols and pollutants on UVB radiation transfer and the subsequent impacts on human health, ecosystems, and biogeochemical cycles.

Hydrofluorocarbons (HFCs) and Ozone Depletion

Surprisingly, a class of widely used chemical coolants known as hydrofluorocarbons (HFCs) has been found to contribute to ozone depletion, albeit in a small but measurable way.

  1. Indirect Ozone Depletion: A recent study by NASA found that HFC emissions can indirectly contribute to ozone depletion by causing increased warming of the stratosphere. This warming speeds up the chemical reactions that destroy ozone molecules, and it also decreases ozone levels in the tropics by accelerating the upward movement of ozone-poor air.

  2. Quantifying HFC Impacts: The study focused on the five types of HFCs expected to contribute the most to global warming in 2050. The researchers found that these HFCs could indirectly account for up to 0.035 parts per million of ozone depletion, a small but significant amount that counters the previous assumption that HFCs were entirely benign to the ozone layer.

This unexpected finding highlights the complex and interconnected nature of atmospheric processes, underscoring the importance of continued research and monitoring to fully understand the impacts of human-made chemicals on the ozone layer and the Earth’s climate system.

References:
Ozone Day: CAMS data helps protect life on Earth
Health and Environmental Effects of Ozone Layer Depletion
Executive Summary of the 2002 Assessment of Ozone Depletion
NASA Study Shows That Common Coolants Contribute to Ozone Depletion

Mobile Cloud Computing And It’s Evolution(You Must Know!)

What is Mobile Computing

Mobile Computing is one of the latest and evolving technologies that allows data transmission in the form voice, images, videos via internet-enabled or rather wireless-enabled devices without physical connection such as computers, IoT devices, etc.

Mobile Computing Components

The significant verticals of components involved in the technology of Mobile Computing or Mobile cloud computing are :

  • hardware components
  • software component
  • Communication layer

Hardware Components

The hardware components have different types, such as device components or mobile devices that provide the service of mobility. They can be classified in various segments like smartphones, portable laptops, IoT devices, tablet Pc’s, etc.

What role the hardware components play :

These hardware devices have a mini component called a receptor capable of sensing, receiving, and sending data signals. It is configured to operate in full-duplex mode, ie, sending and receiving signals at the same point of time.

Receptors operate on an existing established wireless network.

software component

The mobile component is the software application program, runs on the mobile hardware component. It is the operating system of the device.

This component ensures portability and mobility and operates on wireless communications and ensures computation that are distributed locations and not attached to any single physical location.

Mobile Communication Layer :

The communication layer represents the underlying infrastructure to ensures seamless and reliable communication. This consists of factors like protocols, services, bandwidth, and portals required to facilitate and support. This layer is based on the radio wave. The signals are carried through the air and communicate with receptors through software components.

The data format is also defined at this layer to ensures collision-free communication between existing systems that provide the same service.

History Of Mobile Computing

During the period of the 1980s:

In 1981: The Osborne Computer Corporation releases the world’s first consumer laptop, The Osborne 1, even though its main limitation was with its display pf 52 characters per line of texts with a small 5″ screen.

mobile computing

Then in 1982: HX-20 from Epson, a portable computer with a small 120 x 32 resolution monochrome LCD screen.

mobile cloud computing

In 1984: The first touchscreen system was developed on the Gavilan SC, which is the first to be marketed with the term ‘laptop.’

multiplexing in mobile computing

In 1989:The Apple Macintosh portable is one of the first to feature an active matrix 640 x 400 screen. This is Apple’s first contribution to the mobile computing movement.

history of mobile computing

During the period of 1990s:

1990: The Intel announces its 20MHz 386SL processor, and was the first CPU to be explicitly designed with mobile computing in mind, featuring power management features and sleep modes to conserve battery life.

1992: The Windows 3.1.1 is released, and then it becomes the standard operating system for laptops

UUXjFePW3tuK8Pk2dOm p5DS9dYLIoIVxmw1d2slCFu8Ghe6ruONIHTJC3t98ZCx7CTPhBrL4UYN4cR IPud7Maz48kuA4ganfKHooaDb4ih

1993: Personal digital assistant was introduced to the United States by Apple.

cnD3FSH8jQdkJsGKZYCeHmTr0cPyx4o UFtmzFmjn0klt vt8iByEgeGF9EAMwdJ loquPPRgpnpZGGQv70HkVTzzUguiTGAj6Ms1Fhj4frab1B1sQP6b1atwPIEkI52HY4GlQgl

1994: IBM’s Thinkpad 755 introduced the CD-ROM drive.

MDk FWs3z1js6YPyaGALb0n2MK3k8HpE6IVwOREdGPjUAv sAeBRG ce4ptg5TkW7AYfL5renQaTzVauaUSds EQIlm96dHosurC1U5n2MkgTDpDEHpcBRrz2J m5oLuZzbrr2iB

During the period of the 2000s and beyond:

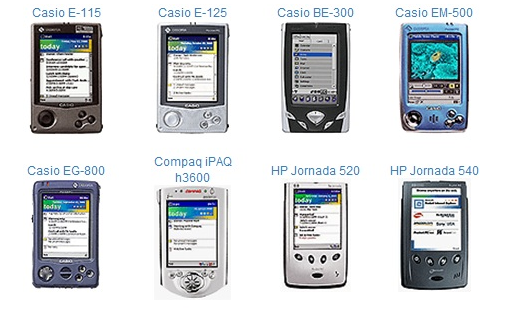
2000: Microsoft unveils a new Operating System, which sparks the beginning of the Pocket PC era. 

image 281

2002: The Research in Motion introduces the first BlackBerry smartphone. 

2007:

  • The Apple launched its first iPhone, which integrated with the best Web-browsing experience and along with the touchscreen display

Also, that time Google unveils Android.

2009: The Motorola introduces the Droid, which was the first Android-based smartphone.

2010:

  • Apple launches the iPad, a line of tablets designed, developed, primarily as a platform for audio-visual media, including books, periodicals, movies, music, games, and web content.
  • Samsung released the Galaxy Tab, an Android-based tablet to compete with the Apple iPad.

With this path, mobile computing evolved, and there were other inventions and contributions that were done from multiple different organizations from the time it started around 1980 and till now. We still see tremendous development is these areas, and this way, mobile computing will continue its path of revolution.

Mobile Computing – Classification

Mobile computing is widely distributed in different sorts of devices that support mobile computing. It is not only limited to computer or mobile phones, as we saw in the history of Mobile computing

We can classify these mobile computing devices in the below segments :

Personal Digital Assistant (PDA)

The Personal Digital Assistant ie, PDA, is an extension or a module of the PC, not a substitute, and mainly used as an electronic organizer. This kind of device is capable of sharing data with computer systems through a process called synchronization.

In this process, both the devices will access and communicate with each other to check for any updates in the individual devices by using Bluetooth or infrared connectivity.

With PDA devices, users can access audio clips, video clips, update office documents, and many more services using internet connectivity.

Smartphones

Smartphones are a combination of PDA and Phone with the camera and other features like the execution of multiple programs concurrently.

The majorly used mobile Operating Systems (OS) are Google’s Android, Apple IOS, Nokia Symbion, RIM’s BlackBerry OS, etc.

Tablet and iPads

This kind of device is larger than a mobile phone or a PDA and also integrates touch screen and is operated using touch-sensitive motions on the net. Eg. iPad, Galaxy Tabs, Blackberry Playbooks, etc.

They provide the same functionality as portable computers and also supports mobile computing in a far superior manner and have the huge processing power.

Multiplexing in mobile computing

  • Multiplexing is a process where multiple simultaneous digital or analog signals are transmitted across a single data link channel.

It can further be distributed into four types. These are:

  • A. Space division multiplexing or SDM
  • Time-division multiplexing or TDM
  • Frequency division multiplexing or FDM
  • Code division multiplexing or CDM

Multiplexing: Frequency division multiplexing (FDM ):

  • In Frequency Division multiplexing, the frequency spectrum is diversified into smaller frequency bands. Through FDM, a number of frequency bands can work simultaneously without any time constraint.

 Advantages of FDM

  • This process is applicable to both analog signals as well as digital signals.
  • The simultaneous dimension of the signal transmission feature.

Disadvantages of FDM

  • The probability of Bandwidth wastage is high and having Less Flexibility.

Multiplexing: Time Division Multiplexing(TDM)

  • The Time Division approach is basically utilizing the whole spectrum for a period.

Advantages of TDM

  • The dedicated user at a certain point in time.
  • Flexible and less complex architecture.

E.g., Integrated Service for Digital Network telephonic service.

Multiplexing : Code Division Multiplexing(CDM)

  • In CDM techniques, a unique code is reserved for every channel so that each of these channels can use the same spectrum simultaneously at the same point in time.

Advantages of CDM

  • Highly Efficient.

Disadvantages of CDM

  • The data transmission rate is less.

Eg. : Cell Phone Spectrum Technology(2G, 3G, etc.).

Multiplexing: Space Division Multiplexing(SDM)

  • Space Division can be considered having both FDM and TDM properties. In SDM, a particular channel will be used against a certain frequency band for a certain amount of time.

Advantages of SDM

  • High Data transmission rate with the optimal Use of Frequency & time bands.

Disadvantages of SDM

  • High inference losses.

E.g., Global Service For Mobile or GSM Technology.

Mobile Cloud Computing

MCC or Mobile cloud computing utilizes cloud computing to deliver and integrate applications to mobile devices.

Using this Mobile Cloud Computing techniques, the mobile apps can be deployed remotely using speed and flexibility and by using the series of development tools.

Mobile cloud applications can be built or updated, and also the addition of a new feature to the exiting application could be achieved in a quick manner and efficiently using cloud services.

These mobile apps can be delivered to as many different devices having different operating systems, computing tasks, and data storage mechanism.

These apps in this approach require lesser device resources because they are cloud-supported architecture, and also the reliability gets improved due to the fact that the data gets backed up and stored over the cloud, which also, in turn, provides more security and robustness.

Advantages of Mobile Cloud computing :

Mobile applications which are being built based on this cloud architecture acquire the following advantages:

  • Data storage capacity and processing power enhancement.
  • Extended battery life
  • Better synchronization of data due to “store in the cloud, access it from anywhere” methodology.
  • Improved reliability and scalability and security due to safe cloud infrastructure and replicas.
  • Easy Integration

Ref: https://www.cs.odu.edu/

Comprehensive Guide to Light Energy: Examples, Uses, and Technical Specifications

light energy light energy examples and uses

Light energy is a fundamental form of electromagnetic radiation that plays a crucial role in various aspects of our daily lives, from illumination and photosynthesis to medical applications and solar power generation. This comprehensive guide delves into the technical details, examples, and practical uses of light energy, providing a valuable resource for physics students and enthusiasts.

Examples of Light Energy

Sunlight

Sunlight is the most abundant natural source of light energy, with an intensity of approximately 1,368 watts per square meter (W/m²) at the Earth’s surface. This energy is the result of nuclear fusion reactions occurring in the Sun, where hydrogen atoms are converted into helium, releasing vast amounts of energy in the form of electromagnetic radiation.

The solar spectrum encompasses a wide range of wavelengths, from ultraviolet (UV) to infrared (IR), with the visible spectrum (380 nm to 740 nm) being the most familiar to the human eye. The intensity and spectral distribution of sunlight can vary depending on factors such as time of day, weather conditions, and atmospheric composition.

Incandescent Lightbulbs

Incandescent lightbulbs are a common example of artificial light energy sources. These bulbs emit light through the heating of a filament, typically made of tungsten, which is heated to high temperatures by an electric current. Incandescent bulbs have a typical power consumption of 60-100 watts and an efficiency of around 2-5 lumens per watt, meaning that a significant portion of the input energy is converted into heat rather than light.

The light produced by incandescent bulbs is characterized by a continuous spectrum, with a warm, yellowish-white color temperature. This type of lighting has been gradually replaced by more energy-efficient alternatives, such as LED and compact fluorescent lamps (CFLs), due to their lower energy consumption and longer lifespan.

Lasers

Lasers are high-intensity light energy sources that produce coherent, monochromatic light through the process of stimulated emission. Laser light is characterized by its high directionality, monochromaticity, and coherence, which make it useful in a wide range of applications, including:

  1. Material processing: Lasers can be used for cutting, welding, and drilling materials with high precision.
  2. Medical procedures: Lasers are employed in various medical treatments, such as laser surgery, photodynamic therapy, and laser hair removal.
  3. Telecommunications: Fiber-optic communication systems rely on laser light to transmit data over long distances with high bandwidth.
  4. Scientific research: Lasers are essential tools in fields like spectroscopy, interferometry, and laser cooling.

The specific characteristics of a laser, such as wavelength, power, and beam quality, are determined by the design and construction of the laser device.

Photovoltaic Cells

Photovoltaic (PV) cells, also known as solar cells, are devices that convert light energy into electrical energy through the photovoltaic effect. When photons from sunlight or other light sources strike the surface of a PV cell, they can excite electrons within the semiconductor material, causing them to flow and generate an electric current.

The efficiency of photovoltaic cells in converting light energy into electrical energy varies depending on the technology used, with typical efficiencies ranging from 15% to 22%. Factors such as the semiconductor material, cell design, and environmental conditions can all influence the performance of PV cells.

Photovoltaic systems, consisting of arrays of PV cells, are widely used for solar power generation, providing a renewable and sustainable source of electricity.

Uses of Light Energy

light energy light energy examples and uses

Illumination

One of the most widespread uses of light energy is for illumination, where it is used to light up homes, offices, streets, and outdoor spaces. The global energy consumption for lighting was estimated to be around 2,900 terawatt-hours (TWh) in 2020, highlighting the significant role of light energy in our daily lives.

The intensity of illumination is measured in lux (lx), which represents the luminous flux per unit area. For example, a typical office environment may have an illuminance of 300-500 lx, while a well-lit street may have an illuminance of 10-30 lx.

Photosynthesis

Light energy plays a crucial role in the process of photosynthesis, where plants and some other organisms use the energy from sunlight to convert carbon dioxide and water into glucose and oxygen. This process is essential for the sustenance of life on Earth, as it provides the primary source of energy for most living organisms.

The estimated amount of light energy absorbed annually for photosynthesis is around 100-150 TWh, highlighting the significant impact of light energy on the global ecosystem.

Photography

Light energy is the fundamental component in the process of photography, where it is used to expose photosensitive materials, such as film or digital sensors, to create images. The interaction between light and the photosensitive material, combined with the optical properties of the camera lens, allows for the capture and recording of visual information.

The wavelength and intensity of the light, as well as the exposure time, are critical factors in determining the quality and characteristics of the resulting photograph.

Solar Power Generation

The conversion of light energy into electrical energy through the use of photovoltaic cells is a rapidly growing field of renewable energy. Solar power generation has seen a significant increase in global installed capacity, reaching over 720 gigawatts (GW) as of 2022.

Photovoltaic systems harness the energy of sunlight to generate electricity, with the efficiency of the conversion process ranging from 15% to 22% depending on the technology used. This renewable energy source has become increasingly important in the global effort to reduce greenhouse gas emissions and mitigate the effects of climate change.

Medical Applications

Light energy has found various applications in the medical field, including:

  1. Laser surgery: High-intensity laser beams are used for precise and minimally invasive surgical procedures, such as eye surgery, tumor removal, and tissue ablation.
  2. Phototherapy: Low-intensity light, often in the red or near-infrared spectrum, is used to treat certain skin conditions, seasonal affective disorder, and other medical conditions.
  3. Cancer treatment: Photodynamic therapy (PDT) uses light-sensitive drugs and light energy to selectively destroy cancer cells.

The unique properties of light, such as its directionality, wavelength, and intensity, make it a valuable tool in modern medical practices.

Technical Specifications and Measurements

Speed of Light

The speed of light in a vacuum is a fundamental constant in physics, with a value of approximately 300,000 kilometers per second (km/s) or 186,282 miles per second (mi/s). This speed is denoted by the symbol “c” and is a crucial parameter in the study of electromagnetic radiation, including light energy.

Luminous Intensity

Luminous intensity is a measure of the amount of light emitted by a source in a particular direction, and it is measured in candelas (cd). One candela is defined as the luminous intensity of a normal candle, which serves as a reference point for this unit.

Illuminance

Illuminance is a measure of the amount of light falling on a surface, and it is measured in lux (lx). One lux is defined as the illuminance of a surface that is one meter away from a light source emitting one candela.

Energy Density

The energy density of light is measured in joules per square meter (J/m²). The energy density of sunlight at the Earth’s surface is approximately 1,368 J/m².

Wavelength

The wavelength of light is the distance between two consecutive peaks or troughs in the electromagnetic wave. The visible spectrum of light ranges from approximately 380 nanometers (nm) for violet light to 740 nm for red light.

Theoretical Explanation

Light energy is a form of electromagnetic radiation that can be described by both wave and particle theories. The wave theory explains the propagation of light through space, while the particle theory (photons) explains the interaction of light with matter.

The energy of light is directly proportional to its frequency and inversely proportional to its wavelength, as described by the equation:

[E = hf = \frac{hc}{\lambda}]

where:
– (E) is the energy of the light
– (h) is Planck’s constant (6.626 × 10^-34 J⋅s)
– (f) is the frequency of the light
– (c) is the speed of light (3 × 10^8 m/s)
– (\lambda) is the wavelength of the light

This equation demonstrates the fundamental relationship between the energy, frequency, and wavelength of light, which is crucial in understanding the behavior and applications of light energy.

References

  1. enDAQ Blog. (n.d.). Light Sensors: Units, Uses, and How They Work. Retrieved from https://blog.endaq.com/how-light-sensors-work
  2. CLEAN. (2013). Energy is a Physical Quantity. Retrieved from https://cleanet.org/clean/literacy/energy1.html
  3. Turito. (2022). Light Energy – Types, Properties and Uses. Retrieved from https://www.turito.com/blog/physics/light-energy
  4. Quora. (2015). What are the uses of light energy? Retrieved from https://www.quora.com/What-are-the-uses-of-light-energy
  5. GeeksforGeeks. (2024). Real Life Applications of Light Energy. Retrieved from https://www.geeksforgeeks.org/real-life-applications-of-light-energy/

Solar Energy, Solar Water Heaters, and Solar Pool Heaters: A Comprehensive Technical Guide

solar energy solar water heater solar pool heater

Solar energy, solar water heaters, and solar pool heaters are increasingly popular technologies that harness the power of the sun to provide sustainable and cost-effective energy solutions. This comprehensive guide delves into the technical details and performance metrics of these systems, equipping you with the knowledge to make informed decisions and maximize their efficiency.

Solar Energy Fundamentals

The foundation of solar energy lies in the conversion of sunlight into usable forms of energy. The incoming solar radiation, which averages around 830 W/m² during tests, is the primary source of energy. However, the captured solar radiation is typically 65-75% of the incoming radiation, due to factors such as reflection, absorption, and conversion efficiency.

The efficiency of solar energy conversion is governed by the Shockley-Queisser limit, which states that the maximum theoretical efficiency of a single-junction solar cell is around 33.7% under standard test conditions. This limit is based on the principles of thermodynamics and the bandgap energy of the semiconductor material used in the solar cell.

To improve the efficiency of solar energy conversion, researchers have developed various techniques, such as:

  1. Multi-junction Solar Cells: These cells stack multiple semiconductor layers with different bandgaps, allowing for a broader spectrum of light absorption and higher overall efficiency, reaching up to 29.1% under concentrated sunlight.
  2. Perovskite Solar Cells: This emerging technology has shown promising results, with lab-scale efficiencies exceeding 25%, and the potential for low-cost, large-scale manufacturing.
  3. Concentrating Solar Power (CSP): CSP systems use mirrors or lenses to concentrate sunlight onto a smaller area, increasing the energy density and enabling the use of more efficient, but more expensive, solar technologies.

Solar Water Heaters

solar energy solar water heater solar pool heater

Solar water heaters are a practical application of solar energy, providing a sustainable and cost-effective solution for domestic hot water needs. The performance of these systems is typically measured by the Solar Energy Factor (SEF), which ranges from 1.0 to 11.0, with higher values indicating greater energy efficiency.

Another important metric is the Solar Fraction (SF), which represents the portion of the total conventional hot water heating load that is met by the solar water heater. Typically, the SF ranges from 0.5 to 0.75, meaning that the solar water heater can meet 50-75% of the total hot water demand.

The daily hot water energy and annual solar energy savings are also crucial factors in evaluating the performance of solar water heaters. For example, a system may provide 0.4105 therms/day of hot water energy, resulting in an annual solar energy savings of 174 therms/year. Assuming an energy cost of $1.50/therm, this would translate to an annual solar cost savings of $261.

The efficiency of solar water heaters is influenced by various design and installation factors, such as the type of collector (flat-plate or evacuated tube), the orientation and tilt angle of the collector, the storage tank size, and the climate conditions.

Solar Pool Heaters

Solar pool heaters are another application of solar energy, providing a sustainable and cost-effective way to heat swimming pools. The performance of these systems is typically measured by the Thermal Performance Rating, which is expressed in Btu/(ft²day) or kWh/(m²day) and reflects the solar energy collection efficiency.

The collector efficiency of solar pool heaters is generally in the range of 65-75%, meaning that 65-75% of the incoming solar radiation is captured and converted into useful heat. This heat is then transferred to the pool water, with a typical heat transfer of 1700 W (5800 Btu/hr) from 400 feet of coil.

The pool temperature increase on sunny days is typically around 0.2°C/day, while the heat loss on sunny warm days is approximately 0.1°C/day. These values can vary depending on factors such as the pool size, the surface area of the solar collector, and the flow rate of the pool water.

The pool size and tubing surface area are also important considerations in the design and performance of solar pool heaters. For example, a pool size of 70,000 liters (18,500 gallons) and a tubing surface area of 600 W/m² are common values.

Installation and Maintenance

The installation of solar energy, solar water heaters, and solar pool heaters requires careful consideration of various factors, including the solar resource, climate, local building codes, and safety issues. Proper installation is crucial to ensure the optimal performance and longevity of these systems.

Maintenance requirements for these systems typically include regular checks on pool chemical balance and filtering system for solar pool heaters, and general system inspections and cleaning for solar water heaters and solar energy systems.

Cost Comparisons

The cost-effectiveness of solar energy, solar water heaters, and solar pool heaters is an important consideration for many consumers. The cost per unit of energy can be used to compare the efficiency of these systems, with an example value of 37.20 Btu/day per dollar spent.

The collector cost and system cost can also vary widely depending on the specific technology, size, and installation requirements. For example, a solar collector may cost $387, while the entire system may cost around $3,000.

Conclusion

Solar energy, solar water heaters, and solar pool heaters offer promising solutions for sustainable and cost-effective energy generation and utilization. By understanding the technical details and performance metrics of these systems, you can make informed decisions and maximize their efficiency to meet your energy needs. This comprehensive guide has provided you with the necessary knowledge to navigate the world of solar energy and its applications.

Reference:
Solar Energy Industries Association (SEIA)
National Renewable Energy Laboratory (NREL)
U.S. Department of Energy – Solar Energy Technologies Office

Mastering Portable Solar Panels: A Comprehensive Technical Guide

portable solar panels

Portable solar panels are a versatile and efficient way to generate electricity, especially in remote or off-grid locations. They come in various sizes, wattages, and configurations, making them suitable for a wide range of applications. This comprehensive guide will delve into the technical details and measurable data points of portable solar panels, providing a valuable resource for science students and enthusiasts.

Understanding the Fundamentals of Portable Solar Panels

Size and Weight Specifications

Portable solar panels typically measure between 10 to 100 watts and weigh between 5 to 20 pounds. For example, a 50-watt portable solar panel may measure 22 x 14 x 1.2 inches and weigh around 12 pounds. The size and weight of a portable solar panel are crucial factors to consider, as they determine the panel’s portability and ease of transportation.

Power Rating and Standard Test Conditions (STC)

The power rating of a portable solar panel is measured in watts (W) and indicates the maximum amount of power it can generate under standard test conditions (STC). STC assumes an irradiance of 1000 W/m², a cell temperature of 25°C, and an air mass of 1.5. For instance, a 100-watt portable solar panel can produce up to 100 watts of power under these standard conditions.

Voltage and Current Specifications

Portable solar panels have specific voltage and current ratings, measured in volts (V) and amperes (A), respectively. These ratings are essential for determining the compatibility of the solar panel with the intended application or device. For example, a 100-watt portable solar panel may have a voltage of 18 volts and a current of 5.55 amperes.

Efficiency and Conversion Rates

The efficiency of a portable solar panel is a measure of how well it converts sunlight into electricity. It is expressed as a percentage and is calculated by dividing the panel’s power output by the amount of sunlight energy it receives. For instance, a 100-watt portable solar panel with an efficiency of 20% would produce 20 watts of power for every 100 watts of sunlight energy it receives.

The conversion efficiency of solar cells is governed by the Shockley-Queisser limit, which states that the maximum theoretical efficiency of a single-junction solar cell is around 33.7% under standard test conditions. This limit is based on the principles of thermodynamics and the bandgap energy of the semiconductor material used in the solar cells.

Temperature Coefficient and Performance Variations

The temperature coefficient of a portable solar panel indicates how much its power output decreases as its temperature increases. It is expressed as a percentage and indicates the percentage decrease in power output for every degree Celsius increase in temperature. For example, a 100-watt portable solar panel with a temperature coefficient of -0.4% would produce 99.6 watts of power at 26°C, assuming a temperature coefficient of -0.4%.

The temperature coefficient is an important consideration, as portable solar panels can be exposed to a wide range of environmental conditions, which can affect their performance. Understanding the temperature coefficient can help users optimize the placement and cooling of the solar panels to maintain optimal power output.

Solar Cell Types and Characteristics

Portable solar panels can use different types of solar cells, such as monocrystalline, polycrystalline, or thin-film. Each cell type has its own unique characteristics and performance attributes:

  1. Monocrystalline Solar Cells: These are the most efficient solar cells, typically achieving efficiencies in the range of 18-22%. Monocrystalline cells are made from a single, continuous crystal of silicon, which results in a uniform and high-quality semiconductor material.

  2. Polycrystalline Solar Cells: These cells are made from multiple silicon crystals, resulting in a slightly lower efficiency compared to monocrystalline cells, typically in the range of 15-18%. However, polycrystalline cells are generally less expensive to manufacture.

  3. Thin-Film Solar Cells: These cells are made from thin layers of semiconductor materials, such as amorphous silicon, cadmium telluride, or copper indium gallium selenide (CIGS). Thin-film cells have lower efficiencies, typically in the range of 10-15%, but they can be more flexible and lightweight, making them suitable for certain portable applications.

The choice of solar cell type for a portable solar panel depends on factors such as efficiency, cost, weight, and specific application requirements.

Practical Examples of Portable Solar Panels

portable solar panels

To provide a better understanding of the technical specifications and characteristics of portable solar panels, let’s examine three specific models:

  1. Goal Zero Nomad 50:
  2. Power Rating: 50 watts
  3. Dimensions: 22 x 14 x 1.2 inches
  4. Weight: 12 pounds
  5. Voltage: 18 volts
  6. Current: 2.78 amperes
  7. Efficiency: 22%
  8. Temperature Coefficient: -0.4% per degree Celsius
  9. Solar Cell Type: Monocrystalline

  10. Renogy 100-Watt 12-Volt Monocrystalline Portable Foldable Solar Suitcase:

  11. Power Rating: 100 watts
  12. Dimensions (folded): 47 x 21.5 x 1.8 inches
  13. Weight: 26.6 pounds
  14. Voltage: 18 volts
  15. Current: 5.55 amperes
  16. Efficiency: 21%
  17. Temperature Coefficient: -0.35% per degree Celsius
  18. Solar Cell Type: Monocrystalline

  19. BigBlue 28W Solar Charger:

  20. Power Rating: 28 watts
  21. Dimensions: 11.1 x 6.3 x 2.8 inches
  22. Weight: 1.3 pounds
  23. Voltage: 5 volts
  24. Current: 5.6 amperes
  25. Efficiency: 22%
  26. Temperature Coefficient: Not specified
  27. Solar Cell Type: Not specified

These examples illustrate the diverse range of portable solar panel options available, each with its own unique set of technical specifications and characteristics. By understanding these details, users can make informed decisions when selecting the most suitable portable solar panel for their specific needs and applications.

Advanced Considerations and Calculations

To delve deeper into the technical aspects of portable solar panels, let’s explore some advanced considerations and calculations:

Photovoltaic Effect and the Shockley-Queisser Limit

The photovoltaic effect is the fundamental principle behind the conversion of sunlight into electrical energy in solar cells. This effect is governed by the Shockley-Queisser limit, which states that the maximum theoretical efficiency of a single-junction solar cell is around 33.7% under standard test conditions.

The Shockley-Queisser limit is derived from the principles of thermodynamics and the bandgap energy of the semiconductor material used in the solar cells. It takes into account factors such as the spectrum of the incident sunlight, the energy losses due to thermalization of charge carriers, and the radiative recombination of electron-hole pairs.

To calculate the Shockley-Queisser limit for a specific solar cell material, the following equation can be used:

η_max = (V_oc * J_sc * FF) / P_in

Where:
η_max is the maximum theoretical efficiency
V_oc is the open-circuit voltage
J_sc is the short-circuit current density
FF is the fill factor
P_in is the input power density of the incident sunlight

By understanding the Shockley-Queisser limit, researchers and engineers can work towards developing solar cell technologies that can push the boundaries of efficiency and improve the performance of portable solar panels.

Electrical Characteristics and Load Matching

The electrical characteristics of a portable solar panel, such as its voltage-current (V-I) curve and power-voltage (P-V) curve, are crucial for understanding its performance and optimizing its use.

The V-I curve of a solar panel describes the relationship between the output voltage and current, and it is influenced by factors such as the solar irradiance, cell temperature, and load resistance. The P-V curve, on the other hand, shows the relationship between the output power and voltage, and it can be used to determine the maximum power point (MPP) of the solar panel.

To maximize the power output of a portable solar panel, it is essential to match the load (e.g., a battery or a device) to the solar panel’s MPP. This can be achieved through the use of a maximum power point tracking (MPPT) charge controller, which continuously adjusts the load resistance to maintain the solar panel’s operation at the MPP.

By understanding the electrical characteristics of portable solar panels and implementing proper load matching techniques, users can optimize the power output and efficiency of their solar energy systems.

Numerical Examples and Calculations

To illustrate the application of the concepts discussed, let’s consider a numerical example:

Suppose you have a 100-watt portable solar panel with the following specifications:
– Voltage at maximum power (V_mp): 18 volts
– Current at maximum power (I_mp): 5.55 amperes
– Open-circuit voltage (V_oc): 22 volts
– Short-circuit current (I_sc): 6 amperes
– Fill factor (FF): 0.77

  1. Calculate the maximum theoretical efficiency of the solar panel based on the Shockley-Queisser limit:
    P_in = 1000 W/m^2 (standard test condition)
    V_oc = 22 V
    J_sc = I_sc / A = 6 A / (0.5 m^2) = 12 A/m^2
    FF = 0.77
    η_max = (V_oc * J_sc * FF) / P_in = (22 V * 12 A/m^2 * 0.77) / 1000 W/m^2 = 0.203 or 20.3%

    The maximum theoretical efficiency of the solar panel is approximately 20.3%.

  2. Calculate the actual power output of the solar panel:
    P_max = V_mp * I_mp = 18 V * 5.55 A = 99.9 W
    The actual power output of the solar panel is 99.9 watts, which is close to the rated 100-watt power.

  3. Determine the temperature coefficient of the solar panel:

  4. Assume the temperature coefficient is -0.4% per degree Celsius
  5. If the solar panel’s temperature increases by 10°C, the power output would decrease by:
    ΔP = P_max * (-0.4% / °C) * ΔT = 99.9 W * (-0.4% / °C) * 10°C = -3.996 W
    The power output of the solar panel would decrease by approximately 4 watts if the temperature increases by 10°C.

These calculations demonstrate the application of the technical concepts discussed earlier, allowing users to understand the performance and characteristics of their portable solar panels in more depth.

Conclusion

In conclusion, this comprehensive guide has provided a detailed exploration of the technical aspects and measurable data points of portable solar panels. By understanding the size, weight, power rating, voltage, current, efficiency, temperature coefficient, and solar cell types, users can make informed decisions when selecting and utilizing portable solar panels for their specific needs and applications.

The guide has also delved into advanced considerations, such as the photovoltaic effect, the Shockley-Queisser limit, electrical characteristics, and load matching, as well as presented numerical examples and calculations to illustrate the practical application of these concepts.

With this knowledge, science students and enthusiasts can confidently navigate the world of portable solar panels, optimizing their performance and maximizing the benefits of this versatile and efficient technology.

References

  1. Adafruit. (n.d.). Portable Solar Charging Tracker. Retrieved from https://learn.adafruit.com/portable-solar-charging-tracker?view=all
  2. Cedar, W. W. U. (2016). Portable Solar Panels: A Comprehensive Guide. Retrieved from https://cedar.wwu.edu/cgi/viewcontent.cgi?article=1679&context=wwu_honors
  3. Dabbsson. (2021). Mastering Portable Solar Panels: A Comprehensive Guide to Efficient Use. Retrieved from https://www.dabbsson.com/blogs/news/mastering-portable-solar-panels-a-comprehensive-guide-to-efficient-use
  4. Shockley, W., & Queisser, H. J. (1961). Detailed Balance Limit of Efficiency of p-n Junction Solar Cells. Journal of Applied Physics, 32(3), 510-519.