Scientific Principles: 7 Important Facts

Capture 300x277 1

Management

Management is the process of planning, organizing, leading and controlling the efforts of the members of an organization to achieve the goals of the organization. Whereas, science is the systematic theoretical knowledge derived and tested critically and finally generalized into laws, theories and principles. Introduction of scientific principles and study in the field of management is done in the field of scientific management.

Scientific management was the very early approach to introduce science into the field of engineering. Introduction of Scientific principles in the field of management gave birth to the scientific management. Scientific management is a branch of Industrial Engineering. Industrial Engineering is the branch of mechanical engineering which is focused on design, installation and improvement systems of people, information, material, energy and equipment.

As famously defined by F. W. Taylor, “Scientific management means knowing exactly what you want men to do and seeing that they do it in the best and cheapest way.”

History of Scientific Management

Management is the most significant thing that started in the Stone Age and continued until the date. In the Stone Age, management was associated with arrows’ production issues for hunting, forming wood lugs for fire, managing beasts for transportation, etc. After the invention of the wheel, the management issues got focused on the production of carts, agricultural work, etc. Still, the real era considered by historians for the management is from the period when man learned and implemented the concept of civilization successfully.

For more details Click Here!

Scientific Principles

Scientific principles are the answers of why and how of basic laws and rules of nature which are accepted by scientists. These scientific principles cannot be written in the mathematical forms. F. W. Taylor was the person who introduced these scientific principles and study in the field of management. This introduction terminated the conventional heat-and –miss and rule-of –thumb methods of management and initiated the rules of scientific investigation including research and experiments.

Scientific Principles of Sustainability

Sustainability is defined as the series of actions or processes through which human being tries to avoid the depletion of nature and natural resources. Sustainability emphasizes on pollution prevention, waste reduction and management, population stabilization, etc.

There are four main scientific principles of sustainability:

  1. Reliance on Solar Energy
  2. Biodiversity
  3. Population Control
  4. Nutrient Cycling

Every company should follow these four scientific principles while establishing and managing a company.

Principles of Scientific Management

There are four important principles of scientific management which are given by F. W. Taylor.

  • Principle #1: Science, not rule of thumb

Replacement of old rule of thumb method

  • Principle #2: Harmony, Not Discord

Co-operation between labor and management

  • Principle #3: Cooperation not individualism

Equal division of responsibility

  • Principle #4: Development of each and every person to his/her utmost efficiency and prosperity

Take care of each and every person

Development of Scientific Management

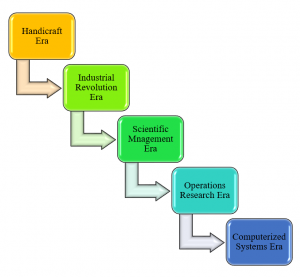
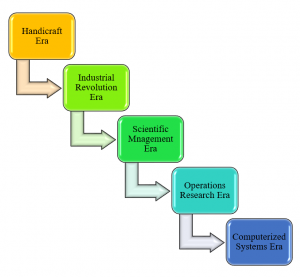
The development of scientific management is classified into five eras as follows:

  1. Handicraft Era
  2. Industrial Revolution Era
  3. Scientific Management Era
  4. Operations Research Era
  5. Computerized Systems Era
Scientific Management Theory | Management

Handicraft Era

  • This era starts with the early age of human civilization. From the 14th century to the 18th century.
  • This era was about specific groups, including carpenter, blacksmith, goldsmith, etc. so, the management was more about handicraft shops which an individual managed with a minimal volume of persons.
  • The compensation received by employees was varied according to place, time, and situation.
  • The type of work was not clearly defined, so the remuneration of the work.

Industrial Revolution Era

  • It is the era in which the factory system began to develop, and a large group of people started working together—starting from the 18th century to the 19th century.
  • Discoveries and inventions of various machines and mechanisms led to the replacement of humans by machines and the replacement of beasts by power sources. Its ultimate effect was the increase in productivity.

Productivity: It is the measure of output obtained per unit input.

  • Specialization of labor, division of labor, professional management, the introduction of public and general laws, and disconnection of ownership from management are concepts that started taking shape in this era.
  • Contributors of Era:
  • Adam Smith: Published ‘The Wealth of Nations’ in 1776, which promoted  “Specialization of Labor.”
  • James Watt: Invented ‘Steam Engine’ in 1764, which established the example of improvement of productivity using machines.
  • Henry Slator: Introduced water and steam power in the textile industry.
  • Eli Whitney: Developed the concept of “interchangeability of parts,” which led to the rapid growth of the factory system.
  • Charles Babbage: Suggested the concept of division of labor for productivity improvement.

Scientific Management Era

  • It is the era in which scientific methods were developed and implemented for process improvement. It is the early part of the 19th century.
  • Before this era, management was supposed to be more an art than science. So, the compensation method became transformed the form of time into money through analytical and mathematical solutions.
  • Development of classical management theories, development of neoclassical theory, generation of labor laws, strengthening of the workforce, quality and economy concepts’ emergence, development of participative management, development of a democratic type of leadership are the highlights of the scientific management era.
  • Contributors of Era:
  • Fredrick Winslow Taylor: Published the book ‘Principles of Scientific Management’ in 1915. He is the “Father of Scientific Management.”
  • Lillian Gilberth & F. B. Gilberth: Worked on the analysis of fundamental motions of the parts of the body at the micro-level.
  • H. L. Gantt: Developed a chart used for scheduling and wedge incentive plans.
  • Henry Ford: Developed the idea of the use of conveyors for progressive assembly.
  • F. Wilson. Harris: Proposed Economic Order Quantity (EOQ) model.
  • Walter Shewhart: developed Statistical Quality Control (SQC)
  • Henry Fayol: Developed “Principles of Organization”.

Operation Research Era

Operation Research: It involves decision-making by arriving at solutions systematically using quantitative techniques.

  • In this era, management was accepted as a profession. It is the late part of the 19th century.
  • In this era, optimization of resources has become prime important.
  • The manager’s role gained importance as the improvement in productivity and applications of optimization models became part of the manager’s job.
  • Both work allocation and work extraction were based on suitable modeling.
  • Use of the documentation process made management more systematic.
  • Decision-making became oriented on quantitative as well as qualitative aspects.
  • Development of independent demand, time phasing, material requirement planning(MRP), capacity requirement planning(CRP), just-in-time(JIT) inventory concept, enterprise resource planning(ERP), Total quality management(TQM), poka-yoke devices started in this rea.
  • Contributors of the era:
  • Joseph Orlicky, Oliver Weight, and others: Introduced the concept of independent demand, time phasing, MRP, CRP.
  • Western side: Continued with development of manufacturing resource planning(MRP-II) systems, Just-in-time(JIT) inventory concepts, Enterprise resource planning(ERP)
  • Eastern side: Witnessed the development of quality circles, Kanban, TQM(Total Quality Management), poka-yoke devices, kaizen.

Computerized Systems Era

The electronic and computerized systems developed till the date started with the development of microprocessors. Also known as chips. In this era of computerized systems. It is the early part of the 20th century.

Microprocessor: It is a processing element used in computers.

  • In this era, the process of management was computerized and automated with little or no human effort.
  • “You set a system-then it sets you” was the believed principle of the management.
  • Planning, designing, processing, transporting, information transmission, and communication are the human efforts that were replaced by machinery.
  • System approach accepted for the management.
  • Following are some of the developments which are developed in recent past years:
  • AGV-Automatic Guided Vehicle
  • AS/RS-Automatic Storage and Retrieval Systems
  • Computer Graphics
  • Computer animation
  • Automatic receipt
  • CNC- Computer/numerical controlled machinery
  • CAPP-Computer Aided Process Planning
  • CAD-Compuer Aided Design
  • CAM-Computer Aided Manufacturing
  • Computer-Aided Plant Layout Planning
  • Simulation and Modeling
  • HRM-Human Resource Management
  • Boundaryless and Virtual organization structure

Characteristics of Management

Following are the important characteristics of management:

  1. Management is scientific and mathematical.

The organizational goals are achieved by management with the help of scientific techniques and mathematical tools.

  • Management is art and tact.

Management is considered as the art of getting things done very often.

  • Management is a system of authority and responsibility.

In management, authority and responsibility go hand in hand.

  • Management is accountability

The accountability characteristic of management makes it effective and efficient.

  • Management is goal-oriented

Management is about clearly defined objectives and moving towards them successfully.

  • Management is a distinct process.

Each activity of management distinctly signifies and describes the method and style of fany functioning.

  • Management is decision-making.

A correct decision for management leads to grand success, while a wrong decision leads to failure.

  • Management is economic efficiency.

Economics is the major factor of management.

  • Management is the welfare of mankind.

To have concern for people and their welfare is very important for management.

  1. Management is an experience.

Experiences and minute records characterize the management continuity.

  1. Management is team building through coordination.

A group of people does management.

  1. Management is a profession: Management needs to apply scientific principles; therefore, it is considered a profession.
  2. Management is universal

Management is found in every act of human beings.

  1. Management is dynamic: Changing environment brings management changes.

Important Questions and Answers

What is scientific management? | Which of the following best describes scientific management?

Scientific management means knowing exactly what you want men to do and seeing that they do it in the best and cheapest way.

Who is the father of scientific management?

Fredrick Winslow Taylor is known as the father of scientific management.
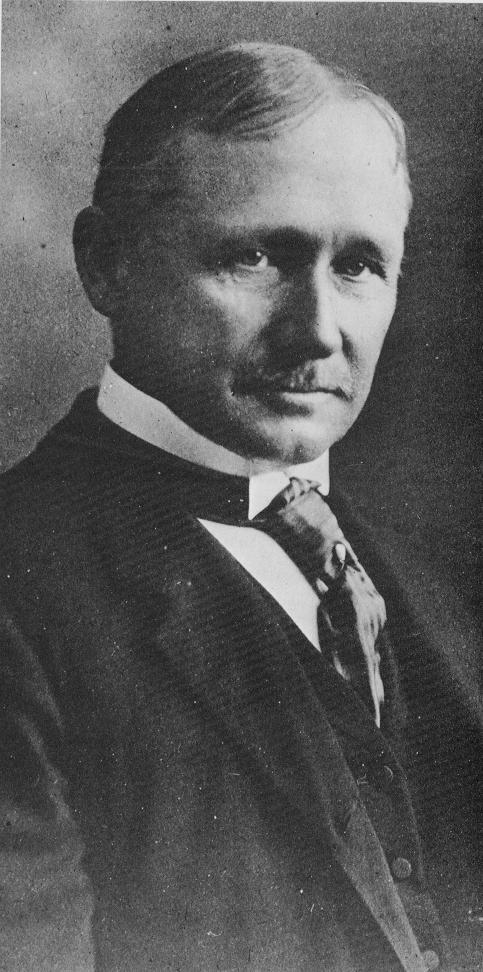
Frederick Winslow Taylor
Fredrick Winslow Taylor: father of scientific management, has introduced scientific principles

What is the four Ms of management?

Men, material, machines, and methods are the four Ms of management.

With respect to the development of scientific management, Frederick Taylor’s objective was to

Scientifically determine the most efficient way to perform a task and then teaching it to people.

Which person developed the model of Economic Order Quantity?

F. Wilson Harris developed the model of EOQ.

What are the characteristics of scientific management?

Following are the important characteristics of management:

  1. Management is scientific and mathematical
  2. Management is art and tact
  3. Management is a system of authority and responsibility
  4. Management is accountability
  5. Management is goal-oriented
  6. Management is a distinct Process
  7. Management ids decision making
  8. Management is economic efficiency
  9. Management is the welfare of mankind
  10. Management is an experience
  11. Management is team building through coordination
  12. Management is a profession.
  13. Management is universal
  14. Management is dynamic

What are scientific principles?

Scientific principles are the answers of why and how of basic laws and rules of nature which are accepted by scientists. These scientific principles cannot be written in the mathematical forms. F. W. Taylor was the person who introduced these scientific principles and study in the field of management.

What are Scientific Principles of Sustainability?

Sustainability is defined as the series of actions or processes through which human being tries to avoid the depletion of nature and natural resources. Scientific Principles of Sustainability emphasizes on pollution prevention, waste reduction and management, population stabilization, etc.

There are four main scientific principles of sustainability:

1) Reliance on Solar Energy

2) Biodiversity

3) Population Control

4) Nutrient Cycling

Every company should follow these four scientific principles while establishing and managing a company
 Click Here for more such articles

    Simply Supported Beam: 9 Important Facts

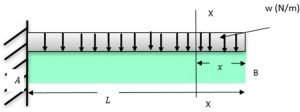
    FBD 300x64 1

    Simply Supported Beam Definition

    A simply supported beam is a beam, with one end normally hinged, and other-end is having support of roller. So because of hinged support’s, restriction of displacement in (x, y) will be and because of roller support’s will be prevented the end-displacement in the y-direction and will be free to move parallel to the axis of the Beam.

    Simply Supported Beam free body diagram.

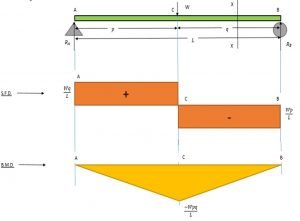
    The free-body diagram for the Beam is given below in which with point load acting at a distance ‘p’ from the left end of the Beam.

    Free Body diagram of simply supported beam
    Free Body Diagram for S.S.B

    Simply Supported Beam boundary conditions and Formula

    Evaluating Reaction forces acting on the Beam by using Equilibrium conditions 

    Fx + Fy = 0

    For vertical Equilibrium,

    Fy = RA +RB – W = 0

    Taking Moment about A equals to 0 with standard notations.

    Rb = Wp/L

    From above equation,

    RA + Wp/L = W

    Let X-X be the intersection at ‘a’ distance of x from the end point denoted by A.

    Considering standard Sign-convention, we can compute the Shear force at the point A as described in figure.

    Shear force at A,

    Va = Ra = wq/L

    Shear force at region X-X is

    Vx = RA – W = Wq/L – W

    Shear Force at B is 

    Vb = -Wp/L

    This proves that the Shear Force remains constant between points of application of Point Loads.

    Applying standard rules of Bending Moment, Clockwise Bending Moment from the Left end of the Beam is taken as +ve and Counter Clockwise Bending moment is considered as -ve respectively.

    • B.M at the point A = 0.
    • B.M at the point C = -RA p   ………………………… [since the moment is counter-clockwise, Bending Moment is coming out as negative]
    • B.M at the point C is as follows
    • B.M = -Wpq/L
    • B.M at the point B = 0.
    BMD SSB
    Shear force and bending moment diagram

    Simply supported Beam Bending moment for uniformly distributed Loading as a function of x.

    Given below is a simply-supported beam with uniformly distributed Loading applied across the complete span,

    SSB UDL 1
    S.S.B with U.D.L

    Region X-X be any region at a distance x from A.

    The resultant equivalent load acting on the Beam Due to Uniform Loading case can be elaborated by

    F = L * f

    F=fL

    Equivalent Point Load fL acting at the mid-span. i.e., at L/2

    FBD UDL

    Evaluating Reaction forces acting on the Beam by using Equilibrium conditions 

    Fx = 0 = Fy = 0

    For vertical Equilibrium,

    Fy = 0

    Ra + Rb = fL

    taking standard sign conventions, we can write

    L/2 – R = 0

    From above equation,

    RA + fl/2

    Following the standard Sign convention, shearforce at A will be.

    Va = Ra = FL/2

    Shear Force at C

    Vc = Ra – fL/2

    Shear force at region X-X is

    Vx = RA – fx = fL/2 – fx

    Shear Force at B

    Vb = -fL/2

    For Bending Moment Diagram, we can find that by taking standard notation.

    • B.M at the point A = 0.
    • B.M at the point X is
    • B.Mx = MA – Fx/2 = -fx/2
    • B.M at the point B = 0.

    Thus, the bending moment can be written as as follows

    B.Mx = fx/2

    Case I: For Simply supported Beam with a concentrated load F acting at the center of the Beam

    Below is a free body diagram for a simply supported steel beam carrying a concentrated load (F) = 90 kN acting at the Point C. Now compute slope at the point A and maximum deflection. if I = 922 centimer4, E = 210 GigaPascal, L =10 meter.

    Solutions:

    The F.B.D. Given an example is given below,

    FBD at Center
    Free Body Diagram for S.S.B with concentrated point load

    The slope at the end of the Beam is,

    dy/dx = FL/16E

    For a simply supported steel beam carrying a concentrated load at the centre, Maximum Deflection is,

    Ymax = FL/48 EI

    Ymax = 90 x 10 x 3 = 1.01m

    Case II: For Simply supported Beam having load at ‘a’ distance from support A.

    For this case acting load(F) = 90 kN at the Point C. Then compute slope at the point A and B and the maximum deflection, if I = 922 cm4, E = 210 GigaPascal, L =10 meter, a = 7 meter, b = 3 meter.

    FBD 3

    So,

    The slope at the end support A of the Beam,

    θ = Fb(L2 – b2) = 0.211

    Slope at the end support B of the Beam,

    θ = Fb (l2 – B2 ) (6 LE) = 0.276 rad

    The equation gives maximum Deflection,

    Ymax = Fb (3L – 4b) 48EI

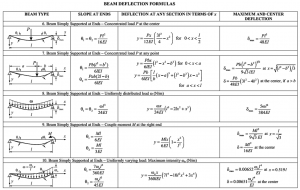
    Slope and deflection table for standard load cases:

    image 1

    Slope and Deflection in Simply supported Beam with uniformly distributed Loading case

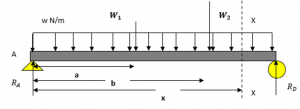
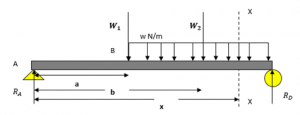
    Let weight W1 acting at a distance a from End A and W2 acting at a distance b from end A.

    image 3

    The U.D.L. applied over the complete Beam doesn’t require any special treatment associated with Macaulay’s brackets or Macaulay’s terms. Keep in mind that Macaulay’s terms are integrated with respect to themselves. For the above case (x-a), if it comes out negative, it must be ignored. Substituting the end conditions will yield constants’ values of integration conventionally and hence the required slopes and deflection value.
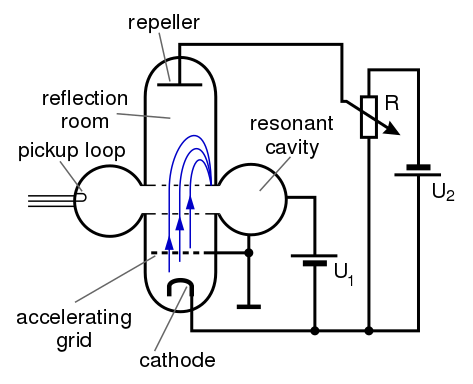
    image 6

    In This case, the U.D.L. starts at point B, the bending moment equation is modified, and the uniformly distributed load term becomes Macaulay’s Bracket terms.

    The Bending Moment equation for the above case is given below.

    EI (dy/dx) = Rax – w(x-a) – W1 (x-a) – W2 (x-b)

    Integrating we get,

    EI (dy/dx) = Ra (x2/2) – frac w(x-a) (6) – W1 (x-a) – W1 (x-b)

    Simply supported beam deflection as a function of x for distributed Loading [Triangular Loading]

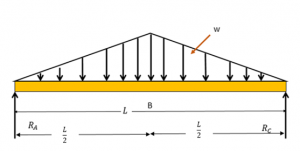
    Given below is the Simply-supported Beam of span L subjected to Triangular Loading and derived the equation of slope and Bending moment utilizing the Double-integration methodology is as follows.

    image 7

    For the symmetrical Loading, every support reaction bears half of the total load and the reaction at support is wL/4 and considering moment at the point which is at a distance x from Support A is calculated as.

    M = wL/4x – wx/L – x/3 = w (12L) (3L – 4x)

    Using the diffn-equation of the curve.

    by the double Integrating we can find as.

    EI (dy/dx) = w/12L (3L x 2x 2) (-x ) + C1

    putting x = 0, y = 0 in equation [2],

    C2 = 0

    For symmetric Loading, the slope at 0.5L is zero

     Thus, slope = 0 at x = L/2,

    0 = w/12L (3L x L2 – L4 +C1)

    Substituting the constants values of C2 and C1 we get,

    EI (dy/dx) = w 12L (3L) (2) – 5wl/192

    The highest deflection is found at the center of the beam. i.e., at L/2.

    Ely = w/12L (3L x 2L x 3) (2 x 8) / l5(5 x 32) (192)

    Evaluating slope at L = 7 m and deflection from given data: I = 922 cm4 , E = 220 GPa, L =10 m, w = 15 N-m

    From the above equations: at x = 7 m,

    EI (dy/dx) = w (12L)(3L x 2x x 2) – x4 – 5wl/192

    using equation [4]

    Ely = – wl/120

    220 x 10 x 922 = 6.16 x 10⁻⁴ m

    Negative sign represents downward deflection.

    Simply supported Beam Subjected to various Loading inducing Bending Stress.

    Given below is an example of a simply supported steel beam carrying a point load and the Supports in this beam are pin supported on one end, and another is roller support. This Beam has the following given material, and loading data

    loading shown in the Figure below has F=80 kN. L = 10 m, E = 210 GPa, I = 972 cm4, d = 80 mm

    FBD 4

    Evaluating Reaction forces acting on the Beam by using Equilibrium conditions 

    Fx = 0 ; Fy = 0

    For vertical Equilibrium,

    Fy = 0 (Ra + Rb – 80000 = 0)

    Taking Moment about A, Clock wise Moment +ve, and anticlockwise moment is taken as -ve, we can calculated as.

    80000 x 4 – Rb x 10 = 0

    Rb = 32000N

    Putting the value of RB in equation [1].

    RA + 32000 = 80000

    Ra = 48000

    Let, X-X be the section of interesting at the distance of x from the endpoint A, so Shear force at A will be.

    VA = RA = 48000 N

    Shear force at region X-X is

    Vx = RA – F = Fb/L – F

    Shear Force at B is 

    Vb = -Fa/L = -32000

    This proves that the Shear Force remains constant between points of application of Point Loads.

    Applying standard rules of Bending Moment, Clockwise Bending Moment from the Left end of the Beam is taken as positive. Counter Clockwise Bending moment is taken as Negative.

    • Bending Moment at A = 0
    • Bending Moment at C = -RA a   ………………………… [since the moment is counter-clockwise, Bending Moment is coming out as negative]
    • Bending Moment at C is
    • B.M = -80000 x 4 x 6/4 = -192000 Nm
    • Bending Moment at B = 0

    Euler-Bernoulli’s Equation for Bending Moment is given by

    M/I = σy = E/R

    M = Applied B.M over the crosssection of the Beam.

    I = 2nd area moment of Inertia.

    σ = Bending Stress-induced.

    y = normal distance between the neutral axis of the Beam and the desired element.

    E = Young’s Modulus in MPa

    R = Radius of Curvature in mm

    Thus, the bending Stress in the Beam

    σb = Mmax / y = 7.90

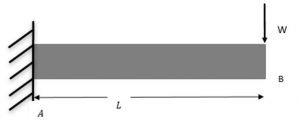
    To know about Deflection of beam and Cantilever beam other article click below.

    Magnetron Microwave: 5 Complete Quick Facts

    Magnetron2 300x204 1

    Points of Discussion: Magnetron Microwave

    Introduction to Magnetic Microwave | What is Magnetron?

    A magnetron is a kind of Microwave Tube. Before discussing magnetron and its related topics, let us find out some of the basic definitions.

    Microwave Tubes: Microwave tubes are devices which generate microwaves. They are the electron guns which produces linear beam tubes.

    Now, the definition of Magnetron is given as –

    Magnetron: Magnetron is a type of vacuum tube which generates signals of the microwave frequency range, with the help of interactions of a magnetic field and electron beams.

    Magnetron tube consumes high-power, and its frequency depends on the physical dimension of the tubes’ cavities. There is a primary difference between a Magnetron and other types of Microwave Tubes. A magnetron works only as an Oscillator but not an amplifier, but a Klystron (a Microwave Tube) can work as an amplifier and as an Oscillator.

    Magnetron Microwave
    A typical Magnetron Microwave, Image Credit: HCRS Home Labor Page, Magnetron1CC BY-SA 2.0 AT

    A Brief History of Magnetron Microwave

    The Siemens Corporation developed the very first magnetron in the year 1910 with the guidance from scientist Hans Gerdien. Swiss physicist Heinrich Greinacher finds out the idea of electrons’ motion in the crossed electric and magnetic field from his own failed experiments of calculation of the mass of electrons. He developed the mathematical model around the year 1912.

    In the United States, Albert Hull started working to control electrons’ motions using a magnetic field rather than using the conventional electrostatic field. The experiment was initiated to bypass the patent of ‘triode’ of Western’s Electric.

    Hull developed a device almost like a Magnetron, but it had no intention to generate signals of microwave frequencies. Czech physicist August Žáček and German physicist Erich Habann independently discovered that Magnetron could generate signals having frequencies of Microwave range.

    The invention and increased popularity of RADAR increased the demand for devices which can produce microwave at shorter wavelengths.

    In the year 1940, Sir John Randall and Harry Boot of University of Birmingham developed a working prototype of a cavity magnetron. In the beginning, the device produced around 400 Watts of power. Further development like water cooling and several other improvements hiked the produced power from 400 W to 1 kW and then up to 25 kW.

    There was a problem related to the frequency instability in the magnetron developed by British scientists. In 1941, James Sayers solved that problem.

    Magnetron Microwave
    The cavity magnetron developed by Sir John Randall and Harry Boot of University of Birmingham, Magnetron Microwave, Image Credit: Elektrik FanneR&B MagnetronCC BY-SA 4.0

    Applications of Magnetron

    A magnetron is a beneficial device, has several applications in various fields. Let us discuss some of them.

    • Magnetrons in Radar: The use of Magnetron for a Radar used to generate short pulses of high-power Microwave frequencies. A magnetron’s waveguide is attached with any of the antennae inside a Radar.
      • There are several factors of Magnetron which causes complexity to the Radar. One of them is the problem related to the frequency instability. This factor generates the problem of frequency shifts.
      • The second characteristics are that a magnetron produces signals with the power of broader bandwidth. So, the receiver should have a broader bandwidth to accept them. Now, having a wider bandwidth, the receiver also receives some sort of noise which is not desired.
    Magnetron Microwave
    An early commercial radar for airport, Magnetron Microwave, Image by: Unknown authorUnknown author, Magnetron radar assembly 1947, marked as public domain, more details on Wikimedia Commons
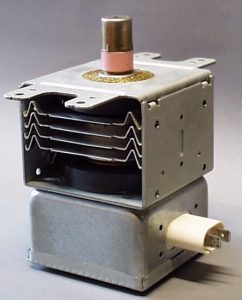
    • Magnetron Heating | Magnetron Microwave Ovens: Magnetrons are used to generate microwaves that are further used for heating. Inside a microwave oven, at first, the magnetron produces the microwave signals. Then, the waveguide transmits the signals to an RF transparent port into the food chamber. The chamber is of a fixed dimension, and also close to the magnetron.  That is why standing wave patterns are randomized by the revolving motor, which rotates the food inside the chamber.
    Magnetron Microwave
    Microwave Oven, Magnetron Microwave applications, Image Credit: The original uploader was 吉恩 at Chinese Wikipedia., WeiboluCC BY-SA 3.0
    • Magnetron Lighting: There are plenty of devices available which lights up using the Magnetron excitation. Devices like the sulfur lamp is a prime example of such light. Inside the devices, magnetron generates the microwave field, which is carried out by a waveguide. Then the signal is passed through the light-emitting cavity. These types of devices are complex. Nowadays, they are not used instead of more superficial elements like Gallium Nitride (GaN), or HEMTs are used.

    Construction of Magnetron

    In this section, we will discuss the physical construction and components of a Magnetron.

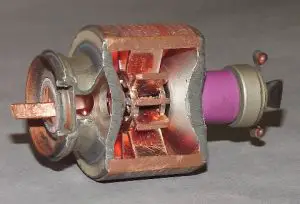
    The magnetron is grouped as a diode as it is deployed on grid. The anode of the magnetron is set into a cylindrical shaped block which is made up of copper. There are filaments with filament lead and the cathode at the centre of the tube—the filaments-leads help keep the cathode and filament attached with it at the centre. The cathode is made up of high-emission material, and it is heated for the operation.

    Magnetron Microwave
    A Magnetron with its parts, Magnetron Microwave, Image Credit: HCRS Home Labor Page, Magnetron2CC BY-SA 2.0 AT

    The tube has 8 to 20 resonant cavities which are cylindrical holes around its circumference. The internal structure is divided into several parts: the number of cavities present in the tube. The division of tube is done by the narrow slots connecting the cavities to the centre.

    Each cavity functions like a parallel resonant circuit where the anode copper block’s far-wall works as an inductor. The vane tip region is considered the capacitor. Now, the resonant frequency of the circuit is dependent on the physical dimensions of the resonator circuit.  

    It is evident that if a resonant cavity starts oscillation, it excites other resonant cavities and they start oscillation too. But there is one property that every cavity follows. If a cavity starts oscillation, the next cavity starts oscillation with 180 degrees delay in phase. This applies to every cavity. Now, the series of oscillation creates a slow-wave structure which is self-contained. That is why this type of Magnetron construction is also known as “Multi-Cavity Travelling Wave Magnetron”.

    Magnetron Microwave
    Central cathode in the middle of the magnetron microwave, Image Credit: Pingu Is SumerianMagnetron section transverse to axisCC BY-SA 3.0

    The cathode supplies the electrons necessary for the energy transfer mechanism. As mentioned earlier, the cathode is in the centre of the tube, further set up by the filament leads. There is a particular open space between the cathode and anode which needs to be maintained; otherwise, it will cause malfunction to the device.

    There are four types of cavity arrangement available. They are –

    • Slot-type
    • Vane-type
    • Rising Sun type
    • Hole and slot type

    Operation of a Magnetron Microwave

    Magnetron goes under some phases to generate signals of microwave frequency ranges. The phases are listed below.

    Though the name of the phases is indicative enough to let us discuss the incidents, those occur in each phase.

    Phase 1: Electron Beam generation and acceleration

    The cathode inside the cavity posses the negative polarity of the voltage. The anode is kept in a radial direction from the cathode. Now, indirect heating of cathode causes the flow of electron towards the anode. At the time of generation, there is no magnetic field present in the cavity. But after the generation of the electron, a weak magnetic field bends the path of the electrons. The path of the electron gets a sharp bend if the strength of the magnetic field increases further. Now, if the velocity of the electrons gets increased, the bend becomes sharper again.

    Phase 2: Velocity control and changes of Electron beam

    This phase occurs inside the ac field of the cavity. The AC field is located from adjacent anode segments to the cathode region. This field accelerates the flow of the electron beam, which is flowing towards the anode segments. The electrons which flow toward the segments gets slowed down.

    Phase 3: Generation of “Space Charge Wheel”

    The flows of electrons in two different directions with separate velocities causes a motion known as “space charge wheel”. This helps increase the electrons’ concentration, which further delivers enough power for the radio frequency oscillations.

    Phase 4: Transformation of energy

    Now, after the generation of the electron beam and its acceleration, the field acquires energies. The electrons also dispense some energy to the field. While travelling from cathode electrons dispenses energy at every cavity it passes through. Loss in energy causes a decrease in speed and eventually deceleration. Now, this happens multiple times. The released energy is efficiently used, and up to 80% efficiency is reached.

    Health Related Concerns from Magnetron Microwave

    A magnetron microwave produces microwave signals which may cause issue to human bodies. Some magnetrons consist of thorium in their filament, which is a radioactive element and not good for humans. Elements like beryllium oxides and insulators made with ceramics are also dangerous if they are crushed and inhaled. This can affect the lungs.

    There are also chances of damages from overheating of magnetron microwave ovens. Magnetrons require high voltage power supplies. So, there is a chance of electrical hazards as well.

    Time Domain Reflectometer: 3 Important Facts

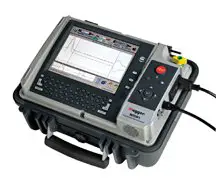
    Megger Time Domain Reflectometer MTDR1 1

    Cover By: https://giphy.com/embed/vNNkcmf2sx6TF6maey

    via GIPHY

    Points of Discussion

    Introduction to Time Domain Reflectometer

    Before we start learning about the time domain reflectometer – TDR, let us know a reflectometer.

    Reflectometer: A reflectometer is a type of circuit that isolates and samples the incident and reflected powers from a load using a directional coupler.

    Reflectometers are prime applications of passive microwave components. A reflectometer is used in a vector network analyzer as it can measure various parameters like – reflection coefficient for the one-port network, scattering parameters for the two-port network. It can also be used in replacement of an SWR Meter or also as a power monitor.

    Time Domain Reflectometer: A time-domain reflector or TDR is an electronic device based on a reflectometer’s property that finds out characteristics of electrical lines from the reflected waves.

    TDRs are used for finding out faults in cables like twisted pairs of cables or coaxial cables. This article will learn more about the device, the uses of the time-domain reflector, and explanations about it.

    Time Domain Reflectometer
    A typical Time Domain Reflectometer, Image Credit: By Megger Ltd. – Megger Ltd, CC BY 3.0, Link

    Know about 7+ Applications of Microwave Engineering and Overview. Click Here!

    Description of Time Domain Reflectometer

    Working Principle

    A TDR analyzes the reflected signals sent by itself. To analyze the reflections, it first transmits a signal along the cable and waits for the reflection. If there are some defects or mismatches in the transmission line or the cable, the part of the incident wave is reflected. TDR receives the reflected wave and then analyzes it to locate and measure the faults. But if there are no defects or everything is fine, then the signal reaches the far end without reflection, and the cable is considered acceptable. The working principle of a Time Domain Reflectometer is almost similar to the working principle of a RADR.

    Analysis

    The TDR analyzes the reflected wave. It is interpreted that the amplitude of the reflected wave determines the impedance of discontinuity. The reflected pulses also determine the distance of the reflected wave, which further determines the fault’s location.

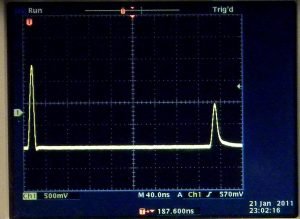
    Time Domain Reflectometer
    Readings from a TDR, Image Credit: Constant314TDR trace of cable with open terminationCC0 1.0

    Method

    Time Domain Reflectometer starts its operation by sending impulse or step signals or energies. Then it observes the reflected energy or the signals subsequently. The discontinuity of impedance is measured and analyzed by the reflected pulses of energies as the amplitude, magnitude, and waveforms help in analyzing.

    For example, suppose an impulse function is sent from TDR towards a connected load. In that case, the reflectometer shows an impulse signal on its display, and the amplitude indicates the impedance of discontinuity. The following expression gives the relation between the load impedance and the magnitude of the reflected wave.

    P = (RL – Z0) / (RL + Z0)

    Z0 is the characteristic impedance of the transmission line or the coaxial cable. RL is the connected load resistance.

    Any impedance discontinuity is observed as the termination impedance, and the termination impedance replaces it. The process consists of rapid changes in the characteristic impedance of the transmission lines.

    Transmitted signals of TDRs

    Time-domain reflectometers use various kinds of signals as incident signals. Some of the transmitters use pulse signals. Some of them use fast rise time step signals. Some of them also use impulse functions of signals.

    TDRs using pulse signals send the pulse through the cable. Their firmness depends on the width of the pulse sent by them. That is why narrow pulse signals are preferred. But there is a shortcoming for the narrow width pulses as they are of high frequencies. High-frequency signals get distorted inside large cables.

    Reflected Signals of TDR

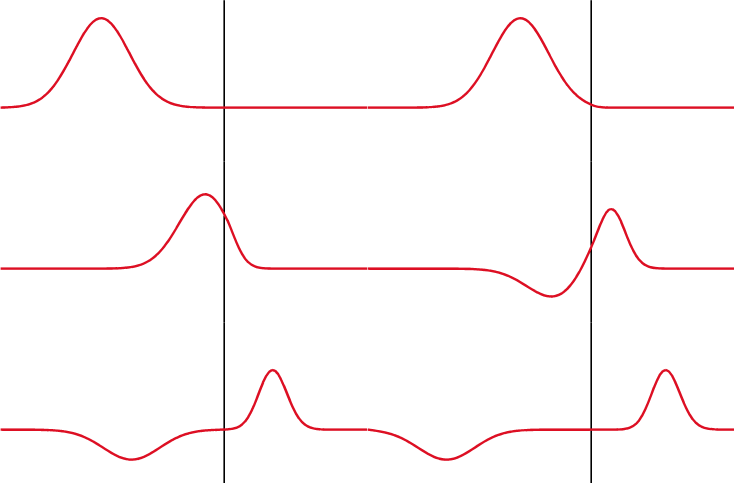
    Typically, the waves reflected from the load impedance or due to the impedance of discontinuity are similar to the incident waves in their shapes. Still, the magnitude and other properties get varied. If there is some change in the load impedance, the reflected wave does the exact change in its parameters to indicate the changes. For example, if the load impedance gets a step increased, the reflected wave will also have an increased step in it.

    This property of reflected wave finds applications in many fields for Time Domain Reflectometer. TDRs are used to ensure the cable’s characteristic impedances, other impedance parameters, no mismatch at connectors or joints.

    Time Domain Reflectometer
    Signal transmission and reflection from load discontinuity, Image Credit: Oleg AlexandrovPartial transmittance, marked as public domain, more details on Wikimedia Commons

    Applications of Time Domain Reflector

    Time Domain Reflectors are mainly used for testing purposes of the very long cables. If any fault arises in very long cables, it is practically impossible to locate the fault after digging up the kilometers-long cable. That is when a TD reflectometer comes into action. The time-domain reflectometer is capable of measuring the resistances on connectors and can sense (detects) the faults way before the catastrophic failures.

    TDRs also find applications in communication lines as they can catch any minute change of line impedance due to the introduction of any tap or splice.

    Time-domain reflectometer devices are crucial for PCBs. Printed circuit boards designed for high frequencies need TDRs for their fault analysis. Some of the major applications are listed below in detail.

    > Analysis of Semiconductor Devices

    TDRs are useful for locating defects in a semiconductor package. Using the property of domain reflectometry, a TDR provides marks for each conductive trace. It is beneficial for finding out the exact location of the opening and shorts.

    > Level Measurement using TDR

    As mentioned earlier, TDRs are beneficial and essential devices for finding out and locating faults for long wire cables. A more advanced device – a TDR-based level measurement device can find out the level of a fluid using that ancient and fundamental property.

    For measurement purposes, the device sends a signal through the cable or the waveguide. A part of the signal gets reflected after the signal incident or hits the medium’s target surface. Now, the device calculates the period by calculating the difference between the send time and the reflected wave’s receive time. The period now helps to determine the level of the fluid. As the device measures the fluid level, that is why it is called the Level Measurement Device.

    The internal sensors of the device process the analyzed output using analog signals. But there are also some difficulties while the propagation of the signal gets varied by the medium’s permittivity. The moisture content also varies the propagation greatly.

    > Applications of TDRs in Geotechnical Engineering

    TDRs are extensively involved in the Geotechnical Engineering domain. They are used to observe the slopes’ movements using various tools like highway cuts, rail beds, and open-pit mines.

    TDRs are also used for stability observation. In the process of observation, a cable is set up close to the concerning region. Any mismatch of insulators between conductors affects the electrical impedance of the coaxial cable. A hardcover surrounds the coaxial cable. It helps to interpret the earth’s movement via a rapid cable distortion. The deformation causes a peak in the monitor of the reflectometer device. Nowadays, signal processing techniques are doing the same job more efficiently.

    > Determination of Soil’s Moisture

    Time-domain reflectometers are used for determining the moisture level of soils. The process of measurement is quite a simple one. A TDR is placed inside different soil layers, and then the start time of precipitation and the time when the soil moisture increased is noted. TDRs are useful to measure the speed of water infiltration.

    > Applications in Agricultural Engineering

    As mentioned earlier, TDRs can measure the soil content. It is beneficial and crucial for the study of agriculture engineering and science. Researches and advanced studies have made time domain reflectometers more technically advance to measure the moisture content for soil and grain, foodstuff, and sediments. However, the primary building block remained the same. TDRs are very much renowned because of their accuracy in measurements.

    > Applications in Aviation maintenance

    The property of reflectometers has found applications in aviation wiring maintenance. The more specific property is the “Spread Spectrum Time Domain Reflectometry,” which is used to locate the fault and preventive maintenance. There are two main reasons behind using the property. The first one is the precision in the measurement, as the device gives accurate measurements. The second one is the TDR’s ability to locate defects in an extensive range that’s too in live.

    Some other types of Time Domain Reflectometers

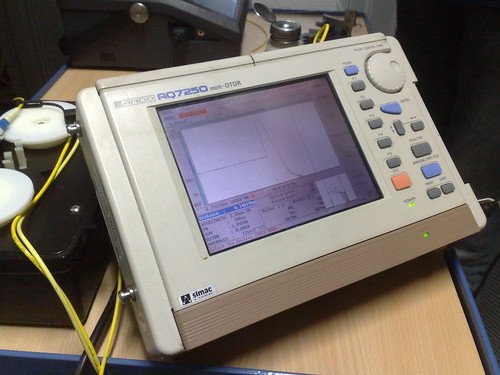
    Time Domain Reflectometer
    Optical Time Domain Reflectometer, Image By:
    Optical time-domain reflectometer” (CC BY-NC-SA 2.0) by sjeemz

    Time Domain Reflectometers get modified and advanced with time. The optical time-domain Reflectometer is one of the advanced types of TDR. It is an equivalent device for optical fiber. There is also a device like Time Domain Transmissometry, which analyses transmissions of optical fibers. Two more variations are: “Spread Spectrum Time Domain Reflectometry (SSTDR)” and “Coherent Time Domain Reflectometry (COTDR)”.  

    CRO And Digital Oscilloscope: 7 Answers You Should Know

    Digital oscilloscope in use 260x300 1

    CONTENTS:CRO and Digital Oscilloscopes

    • What is a CRO?
    • Function of CRO
    • CRO dual beam vs CRO dual trace
    • Dual Trace CRO
    • Function of Aquadag
    • Digital Oscilloscope (DSO)
    • Working principle digital oscilloscope
    • Deflection Factor

    What is a CRO?

    “The cathode ray oscilloscope (CRO) is a type of electrical instrument which is used for showing the measurement and analysis of waveforms and others electronic and electrical phenomenon.”

    Working principle of a CRO with Block Diagram:

    The major block circuit of a general purpose CRO is as follows:

    • Cathode ray tube (CRT)
    • Horizontal Amplifier
    • Perpendicular Amplifier
    • Delay line
    • Time Base circuit
    • Power Supply circuit
    • Trigger Circuit

    Cathode Ray Tube | CRT

    – CRT is actually a cathode ray tube that mainly emits electrons which hits the phosphor search internally and then it provides a visual display at signal.

    Horizontal Amplifier

    The sawtooth voltage is amplified here at first place and then it is applied to the horizontal deflection plates.

    Vertical Amplifier

    the sensitivity and bandwidth of an oscilloscope is determined by the vertical amplifiers. The smallest signal of a vertical amplifier is calculated from the gain of that particular amplifier. Hence, the oscilloscope can successfully produce images e on the CRT screen.

    The sensitivity of oscilloscope is directly proportional to gain of the vertical amplifier.

    Delay Line

    –  a delay line is used to delay any particular signal for a certain span of time in vertical sections. At what time the delay line is not in utilization, the portion of the signal will loss or distorted when delay not is operational. In case of the input signal the delay-line is not unswervingly applied to the vertical plate; instead it is delayed by a particular time while using a circuit. When the signal is delayed, the sweep generator output reaches to the horizontal plates as the time gets extended enough.

    They are 2 types;

    Distributed parameter delay line:

    It is basically a transmission line constructed with a wound helical coil on a mandrel and extruded insulation between it.

    Lamped parameter delay line:

    The Lamped parameter delay line counts at no. of cascading symmetric L-C network.

    Time Base

    time base generates the sawtooth voltage required to reflect the beam to the horizontal section. Hence, the time is plotted in Y- axis, may be utilize to analyse time-varying signals.

    Power Supply

    a voltage is required by CRT to generate and accelerate on electron beam and voltage required by the other circuits at the oscilloscope like horizontal amplifier, vertical amplifier etc. The power supply block provides that.

    There are two sections at a power supply block. The high voltage section and low voltage section. The high voltages of the order of 1000 volt to 1500 volt are required by CRT. Such high negative voltages are used for CRT.

    The -ve high voltage has advantages such as:

    • Accelerating orders and the deflection plates are clean to ground potential. It’s good for operator safety from electrical incidents.
    • The deflection voltages calculated in respect to ground hence blocking of coupling capacitors are not necessary.
    • Insulation between controls and chains is less.

    Trigger Circuit

    to synchronize the input signal and the sweep frequency, trigger circuit is used. The incoming signals are changed into trigger pulse in this particular circuit.

    Differences between Dual Time CRO and Dual Beam CRO:

    DUAL TRACE CRO       DUAL BEAM CRO
    1. Single beam is utilized for producing two different wave forms.  


    2. It cannot capture two fast transient events.  


    3. Signal loss in case of dual trace CRO about 50% of each signal.  

    4. Two operating modes under this CRO a) alternate & b) chop.
    1. Two separate electron beams are used for producing different wave forms.


    2. It can capture two fast transient events as it can display two signals simultaneously.


    3. No loss occurs during dual-beam display.  


    4. Two operating modes under this CRO a) double gun tube & b) split beam

    What is Digital Oscilloscope (DSO)?

    Digital oscilloscope in use
    Digital Oscilloscope (DSO) , Image Credit – RadarvectorDigital oscilloscope in useCC BY-SA 4.0

    Explain the working principle of a dual trace CRO:

    To compare two or more voltages in electronics experiments CRO is an essential and accurate instrument. Sometimes   multiple oscilloscopes might be utilized to trigger the sweep of each oscilloscope at an exact time.

    To get rid from this problem a dual-trace oscilloscope is quite frequently employed as an economic but useful option. In this method, an electron beam is utilized to produce 2 traces signal, these are deflected from 2 perpendicular source.

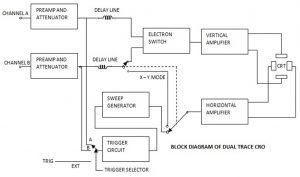
    The block diagram of dual trace oscilloscope is shown below:

    Digital Oscilloscope: Block diagram of dual trace CRO
    Digital Oscilloscope: Block diagram of dual trace CRO

    For each of A and B signal, A separates preamp will pre-amplify and then it gets attenuated by an attenuator. The amplitudes of each i/p are precisely controlled. After preamplification, both of these signal feed to a switch and capability to pass single channel at a time thru a delay to the perpendicular amp. The time-based circuit utilizes the trigger select switch S2 and permits to be triggered by A or B individually by line freq. or by setting an exterior signal. The horizontal amp is feed via S1/ S3 /switch by the sweep generator.

    Explain the function of Aquadag:

    An aquadag is basically name used for trading as a water based colloidal graphite widely utilized in cathode ray tubes.

    When electron beam strikes the phosphor screen, secondary electrons are emitted from the surface of the screen, and they get accumulated there unless they are removed. When their accumulation becomes quite large, they start repelling the electron beam away from the screen, which will create distorted images on the screen.

    To prevent the above problem, in all modern CRO’s a conductive graphite coating called aquadag is deposited on the inner wall of the flared end of the CR tube. This coating is also kept at high positive potential as the accelerating anode. This will perform two functions;

    • The aquadag coating is positive and so it attracts the secondary electrons and keeps removing them eventually.
    • Since the aquadag is installed in front of the anode, it assist e- acceleration to the CRO screen.

    What is Digital Storage Oscilloscope (DSO)?

    Working principle digital oscilloscope:

    In an oscilloscope, the i/p signal is applied to the amplifier and attenuator. The oscilloscope has an amplifier and attenuator circuitry as utilized same as conventional one. The attenuator signal is at that point go to the vertical amplifier part for further process.

    A DSO has three modes of operation –

    1. Roll Mode – Here in this mode of operation very frequently changeable signals are displayed clearly in this mode.
    2. Store Mode – this is also termed as refresh mode. Here, input initiates trigger circuit.
    3. Hold or Save Mode – this is automatic refresh mode.

    What is Deflection Factor or Deflection Sensitivity?

    Deflection sensitivity:

    For CRO, it is represented as the deflection of the screen per unit deflection-voltage.

    Therefore, deflection sensitivity (S),

    eq1

    Deflection Factor:

    Deflection factor of a CRT is expressed as the reciprocal of Deflection Sensitivity

    Therefore, deflection factor (G)

    eq2

    Both of this parameter is used to characterize the CRT.

    For more article click here

    Continuity Equation: 7 Important Concepts

    stream tube 300x269 1

    List of Content

    • Continuity equation
    • Continuity equation differential form
    • Continuity equation for incompressible flow
    • Continuity equation for two-dimensional coplanar flow
    • Continuity equation example
    • Question & Answers
    • MCQ
    • Conclusion

    Continuity equation

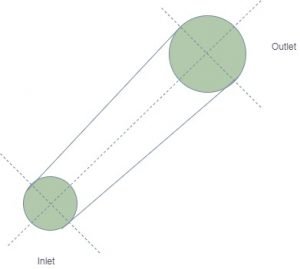
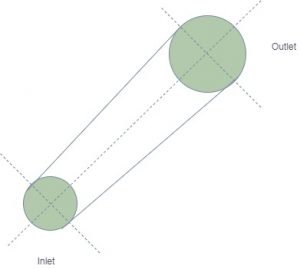
    The fluid flowing through the stream tube is assumed to the ideal fluid. There is no flow occurs across the streamline. It means that fluid enters at one end and leave at the other end there is no in-between outlet. Consider flow condition at inlet cross-section 1-1 as below,

    stream tube
    Stream tube
    Parameters Inlet section 1-1 Outlet section 2-2
    Cross-sectional area A A+dA
    Average fluid density ? ?+d?
    Mean flow velocity V V+dV

    The fluid mass which flows between this two considered sections is given by following formula,

    dm = (A V ? dt ) – ( A +  dA ) ( V+ dV ) ( ? + d? ) dt            Eq … 1

    by simplifying above equation we get ,

    dm/dt = – (A V d? + V ? dA + A ? dV)                                      Eq … 2

    As we know that steady flow means constant mass flow rate, it means here dm/dt = 0.  Now Eq. 2 turned as below,

    (A V d? + V ? dA + A ? dV) = 0                                                   Eq … 3

    Now, divide Eq. 3 with ? A V, equation will be like,

    ( d?/? ) + ( dA/A ) + ( dV/V ) = 0                                          Eq … 4

    d ( ? A V ) = 0                                                                                   Eq … 5

    ? A V = Constant                                                                             Eq … 6

    Here, the Eq. 6 makes us know that the mass of fluid passing through stream tube is constant at every section.

    Suppose the fluid is incompressible (liquid) then the density of fluid will not change at any point. It means that fluid density is constant.

    A V = Constant

    A1 V1 = A2 V2                                                                                                                           Eq … 7

    Eq. 7 represents the continuity equation for steady incompressible flow inside the stream tube. The continuity equation gives a basic understanding of area and velocity. The cross-sectional area’s change affects the velocity of flow inside the stream tube, pipe, hollow channel, etc. Here, the exciting thing is a product of velocity and cross-sectional area. This product is constant at any point in the stream tube. The velocity is inversely proportionate to the cross-section area of the stream tube or pipe.

    Continuity equation differential form

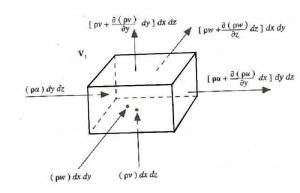
    To derive the differential form of the continuity equation, consider an object as shown in the figure. The dimensions are dx, dy, and dz. There are some assumptions for this formation. The mass of fluid is not created or destroyed, no cavity or bubbles in fluid ( continuous flow). We consider dx in the x-direction, dy in y, and dz in z directions for easiness in derivation.

    If u is the velocity of fluid flow as per shown face in the figure. It is assumed that velocity is uniform throughout the face cross-sectional area. The fluid velocity at surface 1-2-3-4 is u. now; the surface 5-6-7-8 is a dx distance far from 1-2-3-4. So, the velocity at 5-6-7-8 is given as

    u+∂u/∂x  dx
    Differential form of the continuity equation
    Differential form of the continuity equation

    As we know that there change in density by using compressible fluid. If the compressible fluid passes through an object, the density will change.

    The mass flow entering the object is given as

    Mass flow = ? A V

    Mass flow rate = ? A V dt

    The fluid entering on 1-2-3-4

    Inlet fluid = density ( area * velocity) dt

    Inlet fluid= ρ u dy dz dt

    Eq … 1

    The fluid leaving from 5-6-7-8

    Outlet fluid

    outlet fluid= [ρu+ ∂/∂x  (ρu)dx]  dy dz dtt

    Eq … 2

    Now, the difference between inlet fluid and outlet fluid is mass stayed in x direction flow.

    = ρ u dy dz dt- [ρu+ ∂/∂x  (ρu)dx]  dy dz dt
    =  - ∂/∂x  (ρu)dx  dy dz dt

    Eq … 3

    Similarly, we consider mass of fluid in y and z direction is given as below,

    = - ∂/∂y  (ρv)dx  dy dz dt

    Eq … 4

    =  - ∂/∂z  (ρw)dx  dy dz dt

    Eq … 5

    Here, the v and w are the velocities of fluid in y and z directions, respectively.

    For the mass flow of fluid in all three directions, axes are given by the addition of Eq. 3, 4, and 5. It is given as below total fluid mass,

    = -[∂/∂x  (ρu)+ ∂/∂y  (ρv)+ ∂/∂z  (ρw)]  dx  dy dz dt

    Eq … 6

    The rate of change of mass within the object is given by,

    ∂m/∂t  dt=  ∂/∂t  ( ρ ×volume )  dt=   ∂ρ/∂t  dx dy dz dt

    Eq … 7

    As per understanding of mass conservation Eq. 6 equal to Eq. 7

    -[∂/∂x  (ρu)+ ∂/∂y  (ρv)+ ∂/∂z  (ρw)]   dx  dy dz dt=  ∂ρ/∂t  dx dy dz dt

    Solving the above equation and simplifying it, we get,

    ∂ρ/∂t+∂/∂x (ρu)+ ∂/∂y  (ρv)+ ∂/∂z  (ρw)=0

    Eq … 8

    Eq. 8 is. Continuity equation for general flow. It may be steady or unsteady, compressible or incompressible.

    Continuity equation for incompressible flow

    If we consider flow is steady and incompressible. We know that in the case of steady flow ??/?t = 0. If the flow is incompressible, then density ? remains constant. So, by considering this condition, Eq. 8 can be written as,

    ∂u/∂x+ ∂v/∂y  + ∂w/∂z  =0

    Continuity equation for two-dimensional coplanar flow

    In two-dimensional flow, there are two directions x and y. So, u velocity in x-direction and v velocity in the y-direction. There is no z-direction, so velocity in the z-direction is zero. By considering these conditions, the Eq. 8 turned as below,

    ∂/∂x (ρu)+ ∂/∂y  (ρv)=0

    Compressible flow

    ∂u/∂x+ ∂v/∂y  =0 

    Incompressible flow, Density is zero

    Continuity equation example

    There is flow air through the pipe at the rate of 0.25 kg/s at an absolute pressure of 2.25 bar and temperature of 300 K. If the flow velocity is 7.5 m/s, then what will be the pipe’s minimum diameter?

    Data,

    m = 0.25 kg/s,

    P = 2.25 bar,

    T = 300 K,

    V = 7.5 m/s,

    Calculate the density of air,

    P = ? R T

    ? = P / RT

    ? = ( 2.25 * 105 )/ ( 287 * 300 ) = 2.61 kg/m3

    Mass flow rate of air,

    m = ? A V

    A = m / ? V

    A = 0.25 / ( 2.61* 7.5 ) = 0.012 m2

    As we know that area,

    A = π D2 / 4

    D= √((A*4)/π)
    D= √((0.012*4)/3.14)

    D = 0.127 m = 12.7 cm

    A jet of water in upward direction is leave nozzle  tip at the velocity of 15 m/s. The diameter of nozzle is 20 mm. suppose there is no energy loss during operation. What will be the diameter of water jet at 5 m above from the nozzle tip.

    Ans.

    First of all, imagine the system; the flow is in a vertical direction.

    Data,

    V1 = velocity of jet at the nozzle tip

    V2 = velocity of jet at 5 m above from nozzle tip

    Similarly, areas A1 and A2.

    We have general equation of motion as below,

    〖V2〗^2-〖V1〗^2=2 g s
    〖V2〗^2-〖15〗^2=2*(-9.8)*5

    V2 = 11.26 m/s

    Now , apply continuity equation,

    A1 V1 = A2 V2

    A2 = (A1 V1)/ V2

    A2=  ((π/4)* (0.02)^2* 15)/11.26=4.18* 10^-4  m^2
    π/4*〖d2〗^2  =4.18* 10^-4 m^2

    Diameter = 0.023 m = 23 mm

    Questions & Answers

    What is the difference between the continuity equation and the Navier Stokes equation?

    Fluids, by definition, can flow but it is fundamentally incompressible in nature. The continuity equation is a consequence of fact that what goes into a pipe/ hose must also release out. So, in the end, the area times the velocity at the end of a pipe/hose must remain constant.

    In a necessary consequence if the area of the pipe/hose decreases, the fluid’s velocity must also increase to keep the flowrate constant.

    While the Navier-Stokes equation describes the relations in between velocity, pressure, temperatures, and density of a moving fluid. This equation usually coupled with various differential equation forms. Usually, it’s pretty complex to solve analytically.

    What is the continuity equation based on?

    The equation of continuity says that the volume of fluid entering into the pipe of any cross-section should be equal to the volume of fluid leaving the other side of the cross-sectional area, which means the rate of flow rate should be constant and should follow the relation-

    Suppose the fluid is incompressible (liquid), then the fluid density will not change at any point. It means that fluid density is constant.

    A V = Constant

    Flow rate = A1 V1 = A2 V2

    What is the continuity equation used for?

    Continuity equation has many applications in the field of Hydrodynamics, Aerodynamics, Electromagnetism, Quantum Mechanics. It is an important concept for the fundamental rule of Bernoulli’s Principle, it is indirectly involved in the Aerodynamics principle and applications.

    The equation of continuity expresses a local conservation law depending on the context. It is merely a mathematical statement that is subtle yet very powerful concerning the local conservation of specific quantities.

    Does the equation of continuity hold for supersonic flow?

    Yes, It can be used for supersonic flow. It can be used for other flows like hypersonic, supersonic, and subsonic. The difference is that you have to use the conservative form of the equation.

    What is the three-dimensional form of the continuity equation for steady incompressible flow?

    If we consider flow is steady and incompressible. We know that in the case of steady flow ??/?t = 0. If the flow is incompressible, then density ? remains constant. So, by considering this condition, Eq. 8 can be written as,

     ∂u/∂x+ ∂v/∂y  + ∂w/∂z  =0

    What is the 3D form of the continuity equation for steady compressible and incompressible flow?

    In two-dimensional flow, there are two directions x and y. So, u velocity in x-direction and v velocity in the y-direction. There is no z-direction, so velocity in the z-direction is zero. By considering these conditions, the Eq. 8 turned as below,

    ∂/∂x (ρu)+ ∂/∂y  (ρv)=0
     ∂u/∂x+ ∂v/∂y  =0

    Multiple Choice Questions

    Which one of the following is a form of continuity equation?

    1. v1 A1 = v2 A2
    2. v1 t1 = v2 t2
    3. ΔV / t
    4. v1 / A1 = v2 / A2

    What does the continuity equation give the concept about the movement of an ideal fluid?

    1. As the cross-sectional area increases, the speed increases.
    2. As the cross-sectional area decreases, the speed increases.
    3. As the cross-sectional area decreases, the speed decreases.
    4. As the cross-sectional area increases, the volume decreases.
    5. As the volume increases, the speed decreases.

    The equation of continuity is based on the principle of

    a) conservation of mass

    b) conservation of momentum

    c) conservation of energy

    d) conservation of force

    Two similar pipe diameters of d converge to obtain a pipe of diameter D. What can be the observation between d and D?. The velocity of flow in the new pipe will be double that in each of the two pipes?

    a) D = d

    b) D = 2d

    c) D = 3d

    d) D = 4d

    The pipes of different diameters d1 and d2 converge to obtain a pipe of diameter 2d. If the liquid velocity in both pipes is v1 and v2, what will be the flow velocity in the new pipe?

    a) v1 + v2

    b) v1 + v2/2

    c) v1 + v2/4

    d) 2(v1 + v2)

    Conclusion

    This article includes continuity equation derivations with their different form and conditions. Basic examples and questions are given for a better understanding of the concept of the continuity equation.

    For more articles with related topics, click here

    Read more Scientific Principles.

    Klystron: 7 Important Factors Related To It

    660px Klystron tube 1952

    Cover By : DanielkuehlerTrain Tracks in ZuerichCC BY-SA 4.0

    Points of Discussion

    Introduction to Microwave Tubes and Klystron

    Microwave Tubes: Microwave tubes are devices which generate microwaves. They are the electron guns which produces linear beam tubes.

    660px Klystron tube 1952

    Microwave Tube

    Image Credit: Unknown authorUnknown author, Klystron tube 1952, marked as public domain, more details on Wikimedia Commons

    Microwave tubes are generally divided into categories on the type of electron beam-field interaction. The types are –

    • Linear beam or “O” type
    • Crossed-field or “M” type

    Linear-beam: In this type of tube, the electron beam traverses through the tube’s length, and it is parallel to the electric field.

    Crossed-field: In this type of tube, the focusing field is perpendicular to the accelerating electric field.

    Microwave tubes can also be classified into amplifiers or oscillators.

    Klystron: Klystron is a type of microwave tubes which can amplify the higher range of frequencies, especially from Radio Frequencies to Ultra High frequencies. Klystrons can also be used as Oscillator.

    Know about Transmission Lines and waveguides. Click Here!

    Klystron Amplifier

    In an amplifier, the electron beam is sent through two or more resonant cavities. The very first cavity receives the RF input and bunches it into high- and low-density regions to modulate the signal. The bunched beam then goes to the next cavity, which accentuates the bunching effect. In the following or final cavity, the RF’s power is extracted at a highly amplified level.

    The two cavities generate about 20 dB of gain, and using four cavities may produce up to 80-90 dB of gain. Klystron amplifiers can peak powers in the range of megawatt. It has power conversion efficiencies of about 30% to 50%.

    Operation of Klystron Amplifier

    Klystron amplifiers amplify the Rf signal. It converts the kinetic energy of the signal in a DC electron beam into the RF power. Inside a vacuum, an electron gun emits a beam of electrons, and the high-voltage electrodes accelerate the electron beam.

    Then, an input cavity resonator accepts the beam. Here some series of operation occurs. At first, the input cavity is fed with RF energy. It creates standing waves. The standing wave further produces oscillating voltages which function on the beam of an electron. The electric field bunched the electrons.

    Every bunch enters into the output cavity when the electric field decelerates the beam by opposing the electron’s motion. That is how the conversion of kinetic energy to the potential energy of the electrons occurs.

    Reflex klystron and Working of Reflex klystron

    Reflex Klystron: Reflex klystron is a klystron with a single-cavity which acts as an oscillator by using a reflector electrode next to the cavity to deliver positive feedback through the electron beam. Reflex klystrons can be tuned mechanically to adjust the cavity size.

    Klystron

    Reflex Klystron

    Image Credit: ErbadeVarian V-260 modelCC BY-SA 3.0

    A reflex klystron is often called “Sutton Tube” after the name of scientist Robert Sutton, one of the Reflex klystron inventors. It is a low power klystron with applications as a local oscillator in some of the radar receivers.

    Know about 7+ Applications of Microwave Engineering and Overview. Click Here!

    Working of Reflex Klystron

    Klystron
    A Diagrammatic structure, Image Credit: Reflex.sch.enpCC BY-SA 3.0

    In a reflex klystron, the electron beam is passed through the only cavity present in the klystron. After the pass, they get reflected by a reflector of a negatively charged electrode. They make another pass through the cavity. Then they are collected. When the electron beam has their first pass, they are velocity modulated. The electron bunches are formed inside the drift space of the reflector electrode and the cavity.

    The reflector voltage is tuned to ensure the maximum branching. The electron beam gets reflected by the reflector and re-enters into the cavity. The maximum branching makes sure that the maximum amount of energy is transferred from the beam of an electron to the radio frequency oscillation. The electronic range of tuning of a reflex klystron is typically referred to as the change in frequency between two half PowerPoint.

    Applications of Reflex Klystron

    Some of the reflex klystrons are listed below.

    • One of the significant applications of reflex klystrons is in Radio and RADAR systems as the receivers.
    • They are also used as signal generators.
    • Reflex klystrons can be used as Frequency modulators.
    • Also, they can be used as pump oscillator and local oscillators.

    Nowadays, most of the applications of reflex klystron has been replaced by semiconductor technologies.

    Gyroklystron

    Gyroklystron is one of the types of microwave amplifier whose working is almost the same as of a klystron.  But for a Gyroklystron, unlike a klystron, the bunching of an electron is not axial. Instead, the modulation forces change the cyclotron frequency, and thus the azimuthal part of the motion creates the phase branching.

    At the last or the output cavity, the received electrons transfer their energies to the cavity electric field, and the amplified RF signal can be coupled off from the cavity. The cavity structure of a Gyroklystron is cylindrical or coaxial.  The main advantage of a Gyroklystron over a normal klystron is that a Gyroklystron is capable of delivering high power at high frequencies which is very difficult for a typical klystron.

    Optical Klystron

    Optical klystrons are the devices where the method of amplification inside is the same as of a klystron. The experiments are done primarily on lasers at optical frequencies, and they are known as Free Electron Laser. These types of devices use ‘undulators’ in the place of microwave cavities.

    Two Cavity Klystron

    Two cavity klystron is the simplest type of klystron available. As the name suggests, this type of klystron has two microwave cavities. They are known as ‘catcher’ and ‘buncher’. If the two cavities klystron is used as an amplifier, the buncher receives the weak microwave signal and couples out from the catcher, and it gets amplified.

    Working of a Two Cavity Klystron

    In this klystron, there is an electron gun which generates electrons. An anode is placed at a certain distance from them. Electron gets attracted by the anode and passes through them with high positive potential. An external magnetic field, outside the tubes, produces a longitudinal magnetic field along the beam axis. It helps to stop the beam from the spreading.

    The electron beam first goes through the ‘buncher’ cavity. There are grids on both sides of the cavity. The electron beam produces excitation to the standing wave oscillations, which further causes an oscillating AC potential across the grids. The field’s direction varies two times for a single cycle. Electrons enter the cavity when the entrance grid is negative and exits when the exit grid is positive. The field affects the motion as it accelerates them. After the change of direction of the field, the motion of the electrons gets decelerated.

    After the ‘buncher’ cavity there, coms the drift space’. The bunching of electrons occurs here as the accelerated electrons get bunched with the decelerated electrons. The length is made precisely so that the maximum branching occurs.

    Then comes the ‘catcher’ cavity. It has similar grids on each side. The grids

    absorbs the energy from the electron beams. Like the ‘buncher’ here, the electron moves due to the electric field’s change of direction and thus the electrons work. Here the kinetic energy produced by their movement is converted into potential energies. The amplitude of the oscillating electric field is increased to do so. That is how the signal of the ‘buncher’ cavity is get amplified in the ‘catcher’ cavity. Specified types of waveguides and transmission lines are used to couple out from the catcher cavity.

    Klystron vs Magnetron (Difference between the Klystron and Magnetron)

    To find out the differences between the Klystron and Magnetron, we have to know about the Magnetron.

    Magnetron: Magnetron is a type of vacuum tube which generates signals of the microwave frequency range, with the help of interactions of a magnetic field and electron beams.

    Points of DiscussionKlystronMagnetron
    DefinitionKlystron is a type of microwave tubes which can amplify the higher range of frequencies, especially from Radio Frequencies to Ultra High frequencies.The magnetron is a type of vacuum tube which generates signals of the microwave frequency range, with the help of interactions of a magnetic field and electron beams.
    Frequency of operationThe operating frequency range for Klystron is 1 GHz to 25 GHz.Working frequency range is 500 MHz to 12 GHz.
    EfficiencyThe efficiency is around 10% to 20%.The efficiency of the magnetron is relatively high, and it is around 40% to 70%.
    Output PowerOutput power ranges between 1 milli-watt to 2.5 watts.Output power ranges between 2 mW to 250kW.
    Injection of ElectronsElectrons usually are injected from outside.Electrons are injected forcefully from the outside.
    Traversing path of the ElectronsElectrons traverse linearly along the axis.Electrons traverse spirally along the axis.
    UsabilityCan be used as an amplifier as well as an oscillator.Can be used as Oscillator only.
    ApplicationsKlystrons are used in RADARS, like particle accelerators, transmitters, etc.Magnetrons are used in many types of home appliances, including microwave ovens, special heaters.

    SWR Meter: 9 Important Explanations

    swr meter

    Cover Image BY: Theonlysilentbob at English Wikipedia, CC BY-SA 3.0, Link

    Points of Discussion

    Introduction to SWR Meter | What is an SWR meter?

    To know about Standing Wave Ratio Meters, we should know what is SWR at first. SWR is an Acronym of “Standing Wave Ratio”, and it is defined as follow.

    SWR or Standing Wave Ratio: Standing Wave ratio is defined as the ratio of the maximum RF voltage to the minimum RF voltage of a transmission line.

    When the ratio is calculated with respect to the AC voltage, then the parameter will be called voltage SWR, and if the ratio is calculated with respect to current, then the SWR will be known as current SWR.

    Standing waves are physically stationary waves but not like typical ones as the amplitude doesn’t change with respect to time. SWR is necessary for the measurement of impedance matching for loads of transmission lines in Microwave Engineering.

    What is an SWR Meter?

    SWR Meter: SWR Meter or Standing Wave Ratio meter or Wave Ratio Meter or VSWR Meter (Voltage Wave Standing Ratio Meter) measures the value of Standing Wave ratio of a transmission line.

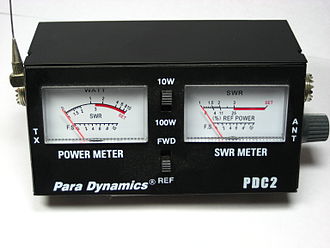
    330px Para dynamics swrmeter dec07
    A typical Standing Wave Ratio Meter, Image BY: Theonlysilentbob at English Wikipedia, CC BY-SA 3.0, Link

    The Standing Wave Ratio Meter actually measures the amount of mismatch present between the load and the transmission line associated with it. It also determines the amount of RF energy reflected by the transmitter.

    The most common type of standing wave ratio meter contains a dual directional coupler which other samples out some amount of power in a direction. After that, a diode does some rectifications and applies to the meter.

    This method of operation finds out a comparison between the minimum and maximum level of voltages. The standing wave ratio meters is applicable and useful for signal ranging from very high frequencies and above. It cannot be used for low-frequency signals.

    VSWR meters measures voltage Standing Wave Ratio and ISWR meters measure current standing wave ratio.

    Methods of Measurement of SWR

    There many different methods available for measurement of SWR. The simplest method is the method of using a slotted line. The slotted line is a part or component of transmission lines with an uncluttered slot through which a probe gets passed. The probe does the main thing by allowing to measure voltages at various points.

    Real World Applications of SWR Meter

    Standing Wave Ratio Meter is one of the most critical and crucial devices for Microwave Engineering. SWR meters are widely used for setting up Antennas and connecting the antennas with their transmission lines. SWR Meters are also used for medical applications which are based on microwave engineering.

    Know about Transmission Lines and waveguides. Click Here!

    Working of an SWR Meter | How does an SWR work?

    Let us discuss how an SWR Meter works or how a directional SWR works. A directional SWR meter is necessary to measure the amplitude of the transmitted wave as well as the amplitude of the reflected wave.

    Directional SWR Meter
    Directional SWR , Image Credit: InductiveloadSWR Meter, marked as public domain, more details on Wikimedia Commons

    As the image shows, there is a transmitter (Tx) and an antenna (ANT) terminal connected with the help of a transmission line. Here, the significant line electromagnetically couples with the directional couplers. Resistors terminate the lines at one of the ends and diodes are connected at another end for rectification purposes.

    The resistors help to match the characteristic impedance of the transmission lines, and the diodes allow the conversion of the amplitudes of waves to their equivalent DC voltage. At last, capacitors smoothen the final DC voltage. There are also connected amplifiers with the forward and reverse terminals. They function as the needed drain resistor and help to determine the Dwell Time.

    Know about Rectangular waveguides. Click Here!

    How to use an SWR meter?

    VSWR meters or typical Standing Wave Ratio meters are easy to use and measure the standing wave ratio. The process of using an Standing Wave Ratio meter while doing an experiment or applying for other purposes are listed below. The steps will help to interpret the result from the meters.

    An important point to be noted before using VSWR is that: VSWR should be used at low power and in the clear channel, primarily if the experiment aims to measure an antenna’s performance.

    • Step 1: Find a clear frequency channel – The frequency channel should be clear enough or noiseless enough so that the transmitted signal from both ends could be interpreted from both sides.
    • Step 2: Reduction of Power – The transmitted power should not exceed a specific power range so that the signal causes distortion at the output devices.
    • Step 3: Set up the Mode – The mode of operation should be set using the options available on the meter. Like – Amplitude Modulation, Frequency Modulation etc.
    • Step 4: Set up of Meter – Now we need to set the Standing Wave Ratio meter to the forward mode. To do so, check the front panel. Also, switch the adjustment knob downwards. It will help to restrict overloading.
    • Step 5: Adjustment of the Forward Reading – After the transmitter starts its transmitting job, keep adjusting the CAL knob to ensure a full-scale reading of the experiment.
    • Step 6: Set up of Meter – Now the Standing Wave Ratio Meter is set up again. This time the knob on the front panel is changed to ‘Reverse’ direction. This is done after the meter is set for forwarding power.
    • Step 7: Restrict the transmission – The transmission is stopped as soon as possible to restrict the VSWR meter’s overloading.
    • Step 8: Repeat the above steps for various frequencies – Took the readings for several other frequencies by following the same steps.

    SWR Bridge

    Impedance bridge is also capable of measuring Standing wave ratio. Impedance bridge is an LCR meter. When the given impedance gets matched with the reference impedance, the bridge gets balanced. If a transmission line gets mismatched, there is some deviation of input impedance, and that could lose the bridge’s balance. That is how a bridge can measure if there is some amount of SWR present in the connection.

    Know about 7+ Applications of Microwave Engineering and Overview. Click Here!

    SWR Meter Reading Explanations

    Let us discuss the reading collected by Standing Wave Ratio Meters. Different values of Standing Wave Ratio meters describe different conditions.

    Range of valueExplanation
    SWR 1 to 1.5It is considered as the ideal range of value. The reading can be decreased to 1 from 1.5 by doing some additional tuning.
    SWR 1.5 to 1.9It is not the best range, but fair enough. Such readings come from vehicle variables or installations faults. It is an acceptable range.
    SWR 2.0 to 2.4It is not a good range of value. There are scopes for improvement. This range of values come from poor antenna mounting location. Fixing that problem might improve your meter’s SWR value.
    SWR 2.5 to 2.9This range of value affects performance and lead to wrong impressions. The transmitter may also get a damaged—poor quality of equipment and needy mounting causes this range of values.
    SWR >  3Operation with this range of values is risky. The device will be damaged within a few moments. The transmission should be stopped at this range. The reason behind such worse values is major installation problems. Attach a proper ground with the device. This range can also indicate poor quality of antenna and faulty coaxial cables.

    Point to be noted: Do not transmit a signal if the SWR range exceeds the range of 1.5 to 2. It will damage the transmitter. If you observe the reading is more than 2.5, shut down the transmitter as soon as possible.

    Essential Formulas For calculation of SWR using SWR Meter

    The formula for calculating VSWR is Vmax / Vmin.

    Also, the expression for VSWR using the forward and reverse wave voltages can be written as: VSWR = (VFWD + VREV) / (VFWD – VREV)

    There is another formula for calculation of SWR.

    SWR = | 1 + Г| / | 1 – Г|

    Digital SWR Meter

    Nowadays, most of the analogue SWR meters are replaced by Digital SWR Meters. Digital SWR Meters are easier to use, take less time to get the result, smaller in size, and lower the maintenance cost than an analogue meter.

    Limitations of Standing Wave Ratio (SWR) Meters

    SWR Meters does not measure the physical impedance present for a load. Instead, it measures a ratio which gives us the idea of mismatch. The perfect impedance for the load can be measured using a separate device known as – “Antenna Analyzer”.  The measurement is only possible if the SWR meter is set perfectly with the transmission line itself. It is matched with the characteristic impedance of the transmission line (generally 50 to 70 ohms).

    SWR meters must be set up as close as possible concerning the transmission line. Otherwise, SWR creates some false impression regarding the readings.

    Rectangular Waveguide: 5 Important Facts

    RW 1 1

    Points of Discussion

    Introduction to rectangular waveguide

    Rectangular Waveguides are one of the primarily used transmission lines. The primary application of rectangular waveguides was the transmission of microwave signals. It has still some critical applications. Some of the components like – couplers, detectors, isolators, attenuators, and slotted lines are available in the market with their large variety for different waveguides band ranging from 1 to 22o GHz. Nowadays, modern devices are using planar transmission lines like stripline or microstrips rather than waveguides. It also helps the miniaturization of the devices. However, the waveguides still have significant applications, including high-power systems, millimetre wave applications, satellite systems, etc.

    Rectangular waveguides of a hollow structure can propagate TE (transverse electrical) modes and TM (transverse magnetic) modes but not the TEM (transverse electromagnetic) modes. The reason behind such characteristics is the single conductor. This article will discuss the transmission of TE and TM modes and find out several properties of them.

    Know about Transmission Lines and waveguides. Click Here!

    TE Modes on Rectangular Waveguide

    As we know, TE modes of waveguides are specified by Ez = 0 and hz will satisfy the reduced wave equation. The reduced wave equation is given below.

    RW 1 1

    Here, the cut off number is the kc. It is given as: kc = √ (k2 − β2) and Hz (x, y, z) = hz (x,y) e – jβz.

    Now, the above equation can be solved using the method of separation of variables. Let, hz (x,y) = X (x) Y(y)

    Substituting the hz in the equation, we get:

    RW 2 1

    Following the usual separation of variables, as each of the terms must be equal to a constant, we provide separation constant kx and ky. Now, the equations are:

    RW 3 1

    The constants also satisfy another condition. That is: kx2 + ky2 = kc2

    The typical solution for hz comes as:

    hz (x, y) = (A coskxx +B sinkxx) (C coskyy + D sinkyy).

    To determine the constant value, boundary conditions have to apply on the electric field components in tangential direction to the waveguide’s wall. They are given below.

    ex (x, y) = 0 for y= 0 and b.

    ey (x, y) = 0 for x= 0 and a.

    The values of ex and ey from hz comes as below. They are calculated from some other wave equations.

    RW 4 1

    From the boundary conditions of ex and evaluated value of ex, D’s value comes as 0 and ky = nπ/b for n = 0, 1, 2…

    Also, from the boundary conditions of ey and evaluated value of ey, B’s value comes as 0 and kx = mπ/a for m = 0, 1, 2…

    At last, the solution of Hz comes as:

    Hz (x, y, z) = Amn cos (mπx/a) cos (nπy/b) e – jβz

    Here, Amn is an arbitrary amplitude constant which is made up of the constants A and C.

    Now, the transverse field components of TEmn modes are specified below.

    RW 5

    The propagation constant is given by:

    β = (k2 – kc2)1/2 = (k2 – (mπ/a)2 – (nπ/b)2)1/2

    Now, in reality, k > kc,

    β = [(mπ/a)2 + (nπ/b)2]1/2

    Now each mode (for each combination of m and n) has a cutoff frequency. It is specified by fcmn.

    fcmn = kc/ (2π√µe) = (1/(2π√µe) * [(mπ/a)2 + (nπ/b)2]1/2

    The mode having the lowest cutoff frequency is known as dominant mode. In the dominant mode, we assume that a > b. the minimum cut off frequency happens for the TE10 mode and cutoff freq. expressed as:

     fc10 = 1 / (2a√µe)

    TE10 is the overall dominant mode for TE mode. Now for m = n = 0, all the expression comes to 0. That is why there is no TE00 mode.

    The wave impedance with the relation of the transverse magnetic field and transverse electric field comes as ZTE = Ex / Hy = Ey / Hx = kη / β

    Here, η = √µ/e. It is the intrinsic impedance of the material present inside the waveguide.

    There is another important parameter present known as guide wavelength. It is defined as the difference between two equal-phase along the waveguide. The difference here means the distance. Guide Wavelength can be calculated as

    λg = 2π / β > 2π / k = λ

    Wherever, λ is the wavelength of a plane wave which is present in between the guide.

    The following expression gives the phase velocity.

    υp = ω / β > ω / k = 1 / (√µe)

    It is greater than the speed of light.

    Know about 7+ Applications of Microwave Engineering and Overview. Click Here!

    TM Modes on Rectangular waveguide

    We know that TM modes are characterized by Hz = 0. And the Ez component must satisfy the reduced wave equation.

    RW 1 2

    Here, Ez (x, y, z) = ez (x, y) e -jβz. Here, the cut off number is the kc. It is given as kc = √ (k2 − β2).

    The solution is achieved using the same process as that of TE mode. The typical solution of ez comes as:

    ez (x, y) = (A coskxx +B sinkxx) (C coskyy + D sinkyy)

    Now, applying the bounding conditions, which are listed below, we get –

    ez (x, y) = 0 for x= o and x = a,

    and, ez (x, y) = 0 for y = 0 and y = b.

    Now, from the boundary conditions of ez and evaluated value of ez, the value of A comes as 0 and kx = mπ/a for m = 0, 1, 2…

    Also. from the boundary conditions of ez and evaluated value of ez, the value of C comes as 0 and ky = nπ/b for n = 0, 1, 2…

    At last, the solution of Ez comes as:

    Ez (x, y, z) = Bmn sin (mπx/a) cos (nπy/b) e – jβz

    Here, Bmn is an arbitrary amplitude constant which is made up of the constants B and D.

    The calculated transverse components for the TMmn modes are listed below.

    RW 6

    The propagation constant is given by:

    β = (k2 – kc2)1/2 = (k2 – (mπ/a)2 – (nπ/b)2)1/2

    For TM modes, the dominant mode is TM11 as the other lower mode like TM00, TM01 or TM10 is not possible as the filed expressions become zero. The cutoff frequency for the dominant mode is given as: fcmn.

    fc11 = (1/(2π√µe) * [(mπ/a)2 + (nπ/b)2]1/2

    The wave impedance with the relation of transverse magnetic field and transverse electric field, comes as: ZTM = Ex / Hy = – Ey / Hx = ηβ / k

    Solved Example on Rectangular Waveguide

    1. A rectangular waveguide is filled up with Teflon, and it is copper K-band. The value of a = 1.07 cm and b = 0.43 cm. The operating frequency is 15 GHz. Answer the following queries.

    A. Calculate the cut-off frequencies for the first five propagating nodes.

    B. compute the attenuation because of dielectric and conductor loss.

    Solution:

    The permeability of Teflon is 2.08. tan delta = 0.0004

    We know that the cutoff frequencies are:

    fcmn = (c/(2π√µe) * [(mπ/a)2 + (nπ/b)2]1/2

    Now, the values for different m and n values are calculated using the formula.

    The below list shows the values.

    value

    The first five modes those will propagate through the rectangular waveguide are TE10, TE20, TE01, TE11 and TM 11.

    At 15 GHz, k = 453.1 m-1.

    The propagation constant for TE10 comes as:

    β = [ (2πf√er/c)2 – (π/a)2] ½ = [k2 – (π/a)2]1/2 = 345.1 m-1

    The attenuation from dielectric loss: αd = k2 tan δ / 2β = 0.119 Np/m

    Or, αd =1.03 dB/m.

    The surface resistivity of the copper (conductivity is 5.8 x 10⁷ S/m) walls are:

    Rs = √(ωµ0/2σ) = 0.032 ohm.

    The attenuation from the conductor loss:

    αc = (Rs / a3bβkη) * (2bπ2 + a3k2) = 0.050 Np/m = 0.434 dB/m.

    Characteristic Table of Rectangular Waveguide

    characteristic table of rectangular waveguide
    Characteristic table of rectangular waveguide

    Cover GIF by: L’OFFICIEL MARTINIQUE

    Cantilever Beam: 11 Facts You Should Know

    Slide2 1 300x80 1

    Contents: Cantilever Beam

    • Cantilever Beam Definition
    • Cantilever Beam Free Body diagram
    • Cantilever Beam Boundary conditions
    • Determine the internal shear and Bending moment in the cantilevered beam as a function of x
    • Finding Shear force and Bending Moment acting at a distance of 2 m from the free end on a Cantilever beam with Uniformly Distributed load (U.D.L.)
    • The equation of the deflection curve for a cantilever beam with Uniformly Distributed Loading
    • Cantilever beam Stiffness and vibration
    • Cantilever beam bending due to pure bending moment inducing Bending Stress
    • Finding Cantilever Bending Stress induced due to Uniformly Distributed load (U.D.L.)
    • Question and Answer on Cantilever beam

    Cantilever Beam Definition

    “A cantilever is a rigid structural element that extends horizontally and is supported at only one end. Typically, it extends from a flat vertical surface such as a wall, to which it must be firmly attached. Like other structural elements, a cantilever can be formed as a beam, plate, truss, or slab.”

    https://en.wikipedia.org/wiki/Cantilever

    A cantilever beam is a beam whose one end is fixed, and another end is free. The fixed support prevents the displacement and rotational motion of the beam at that end. Cantilever beam permits the overhanging feature without any additional support. When the load is applied to the free end of the beam, the cantilever transmits that load to the support where it applies the shear force [V] and the bending Moment [B.M.] at the fixed end.

    Cantilever beam free body diagram

    Consider a cantilever beam with point load acting on the free end of the beam.

    The Free body diagram for the cantilever beam is drawn below:

    Slide2 1
    Free body diagram

    Cantilever beam boundary conditions

    The reaction Forces and moment at A can be calculated by applying Equilibrium conditions of

    \\sum F_y=0, \\sum F_x=0 ,\\sum M_A=0

    For horizontal Equilibrium

    \\sum F_x=0
    R_{HA}=0

    For vertical Equilibrium

    \\sum F_y=0
    \\\\R_{VA}-W=0
    \\\\R_{VA}=W

    Taking Moment about A, Clockwise moment positive and Counter Clockwise moment is taken as negative

    WL-M_A=0
    M_A=WL

    Determine the internal shear and Bending moment in the cantilevered beam as a function of x

    Consider the Cantilever beam with Uniformly distributed loading shown in the Figure below.

    Cantilever Beam with Uniformly distributed load
    Cantilever Beam with U.D.L

    The resultant load acting on the Beam Due to U.D.L. can be given by

    W = Area of a rectangle

    W = L * w

    W=wL

    Equivalent Point Load wL will act at the centre of the beam. i.e., at L/2

    Free Body Diagram of the Beam becomes

    Presentation1

    The value of the reaction at A can be calculated by applying Equilibrium conditions

    \\sum F_y=0, \\sum F_x=0 ,\\sum M_A=0

    For horizontal Equilibrium

    \\sum F_x=0
    \\\\R_{HA}=0

    For vertical Equilibrium

    \\sum F_y=0
    \\\\R_{VA}-wL=0
    \\\\R_{VA}=wL

    Taking Moment about A, Clockwise moment positive and Counter Clockwise moment is taken as negative

    wL*\\frac{L}{2}-M_A=0
    \\\\M_A=\\frac{wL^2}{2}

    Let X-X be the section of interest at a distance of x from a free end

    According to the Sign convention discussed earlier, if we start calculating Shear Force from the Left side or Left end of the beam, Upward acting force is taken as Positive, and Downward acting Force is taken as Negative.

    Shear force at A is 

    S.F_A=R_{VA}=wL

    at region X-X is

    S.F_x=R_{VA}-w[L-x]
    \\\\S.F_x=wL-wL+wx=wx

    Shear force at B is

    S.F=R_{VA}-wL
    \\\\S.F_B=wL-wL=0

    The shear Force values at A and B states that the Shear force varies linearly from fixed end to free end.

    For BMD , if we start calculating Bending Moment from the Left side or Left end of the beam, Clockwise Moment is taken as Positive and Counter-Clockwise Moment is taken as Negative.

    B.M at A

    B.M_A=M_A=\\frac{wL^2}{2}

    B.M at X

    B.M_x=M_A-w[L-x]
    \\\\B.M_x=\\frac{wL^2}{2}-\\frac{w(L-x)^2}{2}
    
    \\\\B.M_x=wx(L-\\frac{x}{2})

    B.M at B

    B.M_B=M_A-\\frac{wL^2}{2}
    
    \\\\B.M_B=\\frac{wL^2}{2}-\\frac{wL^2}{2}=0
    Slide5 1
    S.F.D and B.M.D

    Finding Shear force and Bending Moment acting at a distance of 2 m from the free end on a Cantilever beam with Uniformly Distributed load (U.D.L.)

    Consider the Cantilever beam with uniformly distributed loading shown in the Figure below. w = 20 N/m only. L = 10 m, x = 2 m

    Slide6

    The resultant load acting on the Beam Due to U.D.L. can be given by

    W = Area of a rectangle

    W = 20*10

    W=200 N

    Equivalent Point Load wL will act at the centre of the beam. i.e., at L/2

    Free Body Diagram of the Beam becomes,

    Slide7

    The value of the reaction at A can be calculated by applying Equilibrium conditions

    \\sum F_y=0, \\sum F_x=0 ,\\sum M_A=0

    For horizontal Equilibrium

    \\sum F_x=0
    \\\\R_{HA}=0

    For vertical Equilibrium

    \\sum F_y=0
    \\\\R_{VA}-wL=0
    \\\\R_{VA}=200 N

    Taking Moment about A, Clockwise moment positive and Counter Clockwise moment is taken as negative

    200*\\frac{10}{2}-M_A=0
    \\\\M_A=1000 \\;N-m

    Let X-X be the section of interest at a distance of x from a free end

    According to the Sign convention discussed earlier, if we start calculating Shear Force from the Left side or Left end of the beam, Upward acting force is taken as Positive, and Downward acting Force is taken as Negative.

    Shear force at A is 

    S.F_A=R_{VA}=wL
    \\\\S.F_A=200 N

    at region X-X is

    S.F_x=R_{VA}-w[L-x]
    \\\\S.F_x=wL-wL+wx=wx

    for x = 2 m

    \\\\S.F_x=wx=20*2=40\\;N

    Shear force at B is

    S.F=R_{VA}-wL
    \\\\S.F_B=wL-wL=0

    The shear Force values at A and B states that the Shear force varies linearly from fixed end to free end.

    For BMD , if we start calculating Bending Moment from the Left side or Left end of the beam, Clockwise Moment is taken as Positive and Counter-Clockwise Moment is taken as Negative.

    B.M at A

    B.M_A=M_A
    B.M_A=1000\\;N.m

    B.M at X

    B.M_x=M_A-w[L-x]
    
    \\\\B.M_x=\\frac{wL^2}{2}-\\frac{w(L-x)^2}{2}=wx[L-\\frac{x}{2}]
    \\\\B.M_x=20*2*[10-\\frac{2}{2}]=360\\;N.m

    B.M at B

    B.M_B=M_A-\\frac{wL^2}{2}=1000-\\frac{20*10^2}{2}=0
    
    Slide8

    The equation of the deflection curve for a cantilever beam with Uniformly Distributed Loading

    Consider the Cantilever beam of length L shown in the Figure below with Uniformly distributed load.  We will derive the equation for slope and deflection for this beam using the Double integration method.

    Slide3 1

    The bending moment acting at the distance x from the left end can be obtained as:

    M=-wx* \\frac{x}{2}

    Using the differential equation of the curve,

    \\frac{d^2y}{dx^2}=M = \\frac{-wx^2}{2}

    Integrating once we get,

    EI \\frac{dy}{dx}= \\frac{-wx^3}{6}+C_1………..[1]

    Integrating equation [1] we get,

    EIy= \\frac{-wx^4}{24}+C_1 x+C_2……..[2]

    The constants of integrations can be obtained by using the boundary conditions,

    At x = L, dy/dx = 0; since support at A resists motions. Thus, from equation [1], we get,

    C_1=\\frac{wL^3}{6}

    At x = L, y = 0, No deflection at the support or fixed end A Thus, from equation [2], we get,

    0= \\frac{-wL^4}{24}+\\frac{wL^3}{6} *L+C_2
    C_2= \\frac{-wL^4}{8}

    Substituting the constant’s value in [1] and [2] we get new sets of equation as

    EI \\frac{dy}{dx}= \\frac{-wx^3}{6}+\\frac{wL^3}{6}………..[3]
    EIy= \\frac{-wx^4}{24}+\\frac{wL^3}{6} -\\frac{wL^4}{8}……..[4]

    Evaluate slope at x = 12 m and maximum deflection from given data: I = 722 cm4 , E = 210 GPa, L =20 m, w = 20 N-m

    From the above equations: at x = 12 m,

    EI \\frac{dy}{dx}= \\frac{-wx^3}{6}+\\frac{wL^3}{6}
    210*10^9*722*10^{-8}* \\frac{dy}{dx}= \\frac{-20*12^3}{6}+\\frac{20*20^3}{6}
    \\frac{dy}{dx}=0.01378 \\;radians

    From equation [4]

    EIy= \\frac{-wx^4}{24}+\\frac{wL^3}{6} -\\frac{wL^4}{8}
    210*10^9*722*10^{-8}*y= \\frac{-20*12^4}{24}+\\frac{20*20^3}{6} -\\frac{20*20^4}{8}
    y=-0.064 \\;m

    Cantilever beam Stiffness and vibration

    Stiffness can be defined as the resistance to bending deflection or deformation to bending moment. The ratio of the maximum load applied to the maximum deflection of a beam can be called the stiffness of the beam.

    For a cantilever beam with a Force W at the free end, the maximum deflection is given by

    δ=\\frac{WL^3}{3EI}

    Where W = applied load, L = length of the beam, E = young’s Modulus, I = the second Moment of Inertia

    Stiffness is given by,

    k=W/δ
    \\\\k=W/\\frac{WL^3}{3EI}
    
    \\\\k=\\frac{3EI}{L^3} 

    The natural frequency can be defined as the frequency at which a system tends to vibrate in the absence of any driving or resisting force.

    ω_n=\\sqrt{k/m}
    \\\\ω_n=\\sqrt{\\frac{3EI}{L^3m} }
    

    Where m = mass of the beam.

    Cantilever beam bending due to pure bending Moment inducing Bending Stress

    When a member is subjected to equal and opposite couples in the member’s plane, it is defined as pure bending. In pure bending Shear force acting on the beam is zero.

    Assumptions: Material is Homogenous

    Hook’s Law is applicable

    Member is prismatic

    A couple is applied in the plane of the member

    No warping of the cross-section of the beam takes place after bending

    Strain profile must be linear from the neutral axis

    The stress distribution is linear from the neutral axis to the top and bottom fibres of the beam.

    Euler-Bernoulli’s Equation for Bending Moment is given by

    \\frac{M}{I}=\\frac{\\sigma_b}{y}=\\frac{E}{R}

    M = Applied bending moment over the cross-section of the beam.

    I = Second area moment of Inertia

    σ = Bending Stress-induced in the member

    y = Vertical distance between the neutral axis of the beam and the desired fibre or element in mm

    E = Young’s Modulus in MPa

    R = Radius of Curvature in mm

    Bending Stress for cantilever beam with diameter d, and applied load W can be given as,

    Slide1 3

    Bending Stress will be acting at the fixed support of the beam

    The moment applied M = W.L.

    Second Area moment of Inertia

    I=\\frac{\\pi}{64}d^4

    The vertical distance between the neutral axis of the beam and the desired fiber or element

    y=d/2

    Bending Stress is given as

    σ=\\frac{My}{I}
    
    \\\\σ=\\frac{32WL}{\\pi d^3}

    Finding Bending Stress acting on Cantilever beam with Uniformly Distributed load (U.D.L.)

    Consider A Cantilever beam with Uniformly distributed loading shown in the Figure below has I = 722 cm4 , E = 210 GPa, L =20 m, w = 20 N-m

    Slide7 1

    The reaction Forces and moment at A can be calculated by applying Equilibrium conditions of

    \\sum F_y=0, \\sum F_x=0 ,\\sum M_A=0

    For horizontal Equilibrium

    \\sum F_x=0
    \\\\R_{HA}=0

    For vertical Equilibrium

    \\sum F_y=0
    \\\\R_{VA}-wL=0
    \\\\R_{VA}=200 N

    Taking Moment about A, Clockwise moment positive and Counter Clockwise moment is taken as negative

    200*\\frac{10}{2}-M_A=0
    \\\\M_A=1000 \\;N-m

    Bending Stress

    σ=\\frac{My}{I}
    
    σ=\\frac{1000*50*10^{-3}}{2*722*10^{-8}}
    
    σ=3.238\\;MPa
    

    Question and Answer on Cantilever beam

    Q.1 What is the ratio of Maximum load applied to maximum deflection of a beam called?

    Ans: Stiffness can be defined as the resistance to bending deflection or deformation to bending moment. The ratio of the maximum load applied to the maximum deflection of a beam can be called the stiffness of the beam.

    Q.2 Define a cantilever beam?

    Ans: A cantilever beam is a beam whose one end is fixed, and the other end is free. The fixed support prevents the displacement and rotational motion of the beam at that end. Cantilever beam permits the overhanging feature without any additional support. When the load is applied to the free end of the beam, the cantilever transmits that load to the support where it applies the shear force [V] and the bending Moment [B.M.] towards the fixed end.

    Q.3 A cantilever beam is subjected to uniformly distributed load over the length of the beam, what will be the shape of Shear Force and Bending Moment diagram?

    Ans: For a cantilever beam subjected to uniformly distributed load over the beam’s length, the Shear force diagram’s shape will be a linear curve and Bending Moment diagram will be a Parabolic curve.

    Q.4 A cantilever is subjected to uniformly Varying load over the length of the beam starting at zero from a free end, what will be the shape of Shear Force and Bending Moment diagram?

    Ans: For a cantilever beam subjected to uniformly varying load over the beam’s length, the Shear force diagram’s shape will be Parabolic curve and Bending Moment diagram will be a cubic or third-degree curve.

    Q.5 Where do tension and compression act in bending of cantilever beams?

    Ans: For a cantilever beam of a given span, the maximum bending stress will be at the beam’s Fixed end. For downward netload, maximum tensile bending stress is acted on top of cross-section, and max compressive Stress is acted on the bottom fibre of the beam.

    Q.6 A cantilever is subjected to Moment (M) over the length of the beam, what will be the Shear force and Bending Moment?

    Ans: For a cantilever beam subjected to moment M over the beam’s length, the Shear force will be zero, since no external bending force will be acting on the beam and Bending moment will remain constant for the entire length of the beam.

    To know about Strength of material(click here)and Bending Moment Diagram Click here