The Comprehensive Guide to Seismology and Seismologists: A Hands-on Playbook

seismology seismologist

Seismology is the scientific study of earthquakes and the energy they release. Seismologists are the professionals who study seismic activity and interpret the data collected from seismometers and other instruments to determine the location, magnitude, and other characteristics of earthquakes. This comprehensive guide will delve into the intricate world of seismology, providing a detailed and technical exploration of the tools, techniques, and principles that seismologists rely on to unravel the mysteries of our dynamic planet.

Measuring Earthquake Severity: Intensity and Magnitude

To quantify the severity of an earthquake, seismologists utilize two primary scales: intensity and magnitude. Intensity is a measure of the shaking experienced at a particular location, and it is typically assessed using the Modified Mercalli Intensity (MMI) scale, which ranges from I (barely perceptible) to XII (total destruction). Magnitude, on the other hand, is a measure of the total energy released by the earthquake, and it is most commonly expressed using the moment magnitude scale (Mw).

The moment magnitude scale (Mw) is based on the seismic moment of the earthquake, which is a function of the size of the rupture area, the average slip, and the rigidity of the rocks involved. The formula for calculating the moment magnitude (Mw) is:

Mw = (2/3) log(M0) – 6.0

Where M0 is the seismic moment, measured in Newton-meters (N·m). This scale is preferred over the older Richter scale (ML) because it provides a more accurate representation of the earthquake’s energy release, particularly for large earthquakes.

Seismometers: The Backbone of Seismology

seismology seismologist

Seismometers are the primary instruments used by seismologists to measure ground motion. These devices work on the principle of inertia, where a suspended mass tends to remain still when the ground moves. This motion is then converted into electrical signals, which are recorded as seismograms.

To measure the actual motion of the ground in three dimensions, seismometers employ three separate sensors within the same instrument, each measuring motion in a different direction: up/down (Z component), east/west (E component), and north-south (N component). This allows seismologists to obtain a comprehensive understanding of the ground’s movement during an earthquake.

Seismometers can be classified based on several technical specifications, including:

  1. Frequency Response: Broadband seismometers used for studying tectonic processes have a flat frequency response from 0.001 to 100 Hz, while strong-motion seismometers used for studying building response to earthquakes have a flat frequency response from 0.1 to 100 Hz.

  2. Period: Short-period seismometers have a natural period of less than 1 second and are used for measuring high-frequency seismic waves, while long-period seismometers have a natural period of more than 10 seconds and are used for measuring low-frequency seismic waves.

  3. Sensitivity and Dynamic Range: High-sensitivity seismometers are used for measuring small earthquakes and ambient noise, while low-sensitivity seismometers are used for measuring large earthquakes and strong ground motion. Sensitivity is a measure of the minimum detectable ground motion, while dynamic range is a measure of the ratio of the largest to smallest measurable ground motion.

Locating Earthquakes: Seismic Wave Arrival Times

Seismologists use the arrival times of different seismic waves to locate the epicenter of an earthquake. Seismic waves are classified into two main types: body waves and surface waves. Body waves, which include P-waves (primary or compressional waves) and S-waves (secondary or shear waves), travel through the Earth’s interior, while surface waves, such as Rayleigh and Love waves, travel along the Earth’s surface.

P-waves are the fastest seismic waves and are the first to arrive on a seismogram, followed by the slower S-waves, and then the surface waves. By comparing the arrival times of these waves at different seismometers, seismologists can determine the location of the earthquake’s epicenter using the following equations:

t_p = t_0 + (r/v_p)
t_s = t_0 + (r/v_s)

Where:
– t_p and t_s are the arrival times of the P-waves and S-waves, respectively
– t_0 is the origin time of the earthquake
– r is the distance between the earthquake and the seismometer
– v_p and v_s are the velocities of the P-waves and S-waves, respectively

By solving these equations for multiple seismometer locations, seismologists can triangulate the earthquake’s epicenter.

Seismic Wave Propagation and Attenuation

The propagation and attenuation of seismic waves are crucial factors in seismology. Seismic waves travel through the Earth’s interior and are affected by the varying properties of the materials they encounter. The velocity of seismic waves is primarily determined by the density and rigidity of the medium, as described by the following equations:

v_p = sqrt((K + 4/3 * μ) / ρ)
v_s = sqrt(μ / ρ)

Where:
– v_p and v_s are the velocities of the P-waves and S-waves, respectively
– K is the bulk modulus of the medium
– μ is the shear modulus of the medium
– ρ is the density of the medium

As seismic waves propagate, they also experience attenuation, which is the reduction in their amplitude due to various factors, such as geometric spreading, intrinsic absorption, and scattering. The attenuation of seismic waves is often described by the quality factor (Q), which is a measure of the energy dissipation in the medium.

Seismic Imaging and Tomography

Seismologists use advanced techniques, such as seismic imaging and tomography, to create detailed models of the Earth’s interior structure. Seismic imaging involves the use of seismic reflection and refraction data to generate images of subsurface structures, while seismic tomography uses the travel times of seismic waves to construct three-dimensional models of the Earth’s interior.

One of the most widely used seismic imaging techniques is the reflection seismic method, which involves the generation of seismic waves and the recording of the reflected waves at the surface. The time it takes for the waves to travel from the source to the reflector and back to the surface can be used to determine the depth and structure of the subsurface layers.

Seismic tomography, on the other hand, relies on the analysis of the travel times of seismic waves through the Earth’s interior. By measuring the arrival times of seismic waves at various seismometers, seismologists can infer the velocity structure of the Earth’s interior, which can then be used to create three-dimensional models of the Earth’s structure, including the crust, mantle, and core.

Seismic Hazard Assessment and Risk Mitigation

Seismologists play a crucial role in assessing seismic hazards and developing strategies for risk mitigation. By analyzing historical earthquake data, seismologists can identify regions with high seismic activity and estimate the likelihood of future earthquakes. This information is used to create seismic hazard maps, which are essential for urban planning, infrastructure design, and emergency preparedness.

Seismic hazard assessment involves the evaluation of several factors, including the frequency and magnitude of past earthquakes, the tectonic setting of the region, and the local soil conditions. Seismologists use probabilistic seismic hazard analysis (PSHA) to quantify the likelihood of different levels of ground shaking occurring at a given location within a specified time frame.

Risk mitigation strategies developed by seismologists include the implementation of building codes and structural design standards, the development of early warning systems, and the promotion of public awareness and preparedness programs. By working closely with engineers, policymakers, and emergency management agencies, seismologists can help communities become more resilient to the devastating effects of earthquakes.

Emerging Trends and Advancements in Seismology

The field of seismology is constantly evolving, with new technologies and analytical techniques being developed to enhance our understanding of the Earth’s dynamic processes. Some of the emerging trends and advancements in seismology include:

  1. Distributed Acoustic Sensing (DAS): This technology uses fiber-optic cables to measure ground motion, providing a dense network of seismic sensors that can be deployed in remote or inaccessible areas.

  2. Machine Learning and Artificial Intelligence: Seismologists are increasingly leveraging machine learning algorithms to automate the detection, classification, and analysis of seismic events, leading to more efficient and accurate data processing.

  3. Integrated Geophysical Approaches: Seismologists are combining seismic data with other geophysical measurements, such as gravity, magnetism, and electrical resistivity, to create more comprehensive models of the Earth’s structure and composition.

  4. High-Performance Computing: The growing availability of powerful computing resources has enabled seismologists to develop more complex and detailed models of the Earth’s interior, as well as to perform large-scale simulations of earthquake processes.

  5. Citizen Science and Crowdsourcing: Seismologists are engaging the public in data collection and analysis through citizen science initiatives, leveraging the power of crowdsourcing to enhance their understanding of seismic activity.

As seismology continues to evolve, seismologists will play an increasingly vital role in advancing our knowledge of the Earth’s structure and dynamics, as well as in developing strategies for mitigating the risks posed by earthquakes and other natural hazards.

References:

  1. Seismology, Geology & Tectonophysics Division | Lamont-Doherty Earth Observatory. Retrieved from https://lamont.columbia.edu/research-divisions/seismology-geology-tectonophysics
  2. Seismological Data Acquisition and Analysis within the Scope of … (n.d.). Retrieved from https://www.intechopen.com/chapters/74466
  3. Which Picker Fits My Data? A Quantitative Evaluation of Deep … (2022). Retrieved from https://agupubs.onlinelibrary.wiley.com/doi/full/10.1029/2021JB023499
  4. How are earthquakes detected? – British Geological Survey. Retrieved from https://www.bgs.ac.uk/discovering-geology/earth-hazards/earthquakes/how-are-earthquakes-detected/
  5. Thorne Lay (PhD ’83), Seismologist – Caltech Heritage Project. Retrieved from https://heritageproject.caltech.edu/interviews-updates/thorne-lay
Scientific Principles: 7 Important Facts

Capture 300x277 1

Management

Management is the process of planning, organizing, leading and controlling the efforts of the members of an organization to achieve the goals of the organization. Whereas, science is the systematic theoretical knowledge derived and tested critically and finally generalized into laws, theories and principles. Introduction of scientific principles and study in the field of management is done in the field of scientific management.

Scientific management was the very early approach to introduce science into the field of engineering. Introduction of Scientific principles in the field of management gave birth to the scientific management. Scientific management is a branch of Industrial Engineering. Industrial Engineering is the branch of mechanical engineering which is focused on design, installation and improvement systems of people, information, material, energy and equipment.

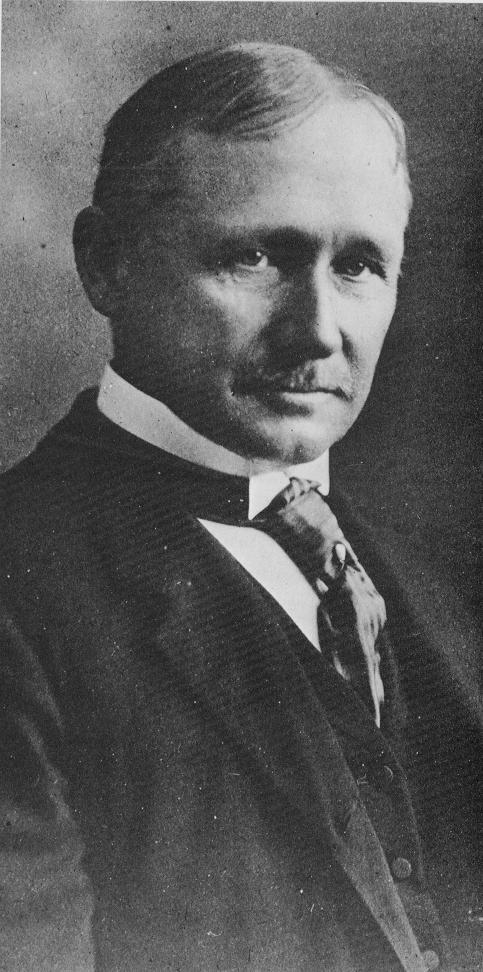
As famously defined by F. W. Taylor, “Scientific management means knowing exactly what you want men to do and seeing that they do it in the best and cheapest way.”

History of Scientific Management

Management is the most significant thing that started in the Stone Age and continued until the date. In the Stone Age, management was associated with arrows’ production issues for hunting, forming wood lugs for fire, managing beasts for transportation, etc. After the invention of the wheel, the management issues got focused on the production of carts, agricultural work, etc. Still, the real era considered by historians for the management is from the period when man learned and implemented the concept of civilization successfully.

For more details Click Here!

Scientific Principles

Scientific principles are the answers of why and how of basic laws and rules of nature which are accepted by scientists. These scientific principles cannot be written in the mathematical forms. F. W. Taylor was the person who introduced these scientific principles and study in the field of management. This introduction terminated the conventional heat-and –miss and rule-of –thumb methods of management and initiated the rules of scientific investigation including research and experiments.

Scientific Principles of Sustainability

Sustainability is defined as the series of actions or processes through which human being tries to avoid the depletion of nature and natural resources. Sustainability emphasizes on pollution prevention, waste reduction and management, population stabilization, etc.

There are four main scientific principles of sustainability:

  1. Reliance on Solar Energy
  2. Biodiversity
  3. Population Control
  4. Nutrient Cycling

Every company should follow these four scientific principles while establishing and managing a company.

Principles of Scientific Management

There are four important principles of scientific management which are given by F. W. Taylor.

  • Principle #1: Science, not rule of thumb

Replacement of old rule of thumb method

  • Principle #2: Harmony, Not Discord

Co-operation between labor and management

  • Principle #3: Cooperation not individualism

Equal division of responsibility

  • Principle #4: Development of each and every person to his/her utmost efficiency and prosperity

Take care of each and every person

Development of Scientific Management

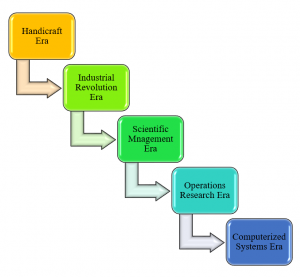
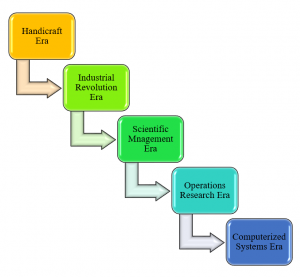
The development of scientific management is classified into five eras as follows:

  1. Handicraft Era
  2. Industrial Revolution Era
  3. Scientific Management Era
  4. Operations Research Era
  5. Computerized Systems Era
Scientific Management Theory | Management

Handicraft Era

  • This era starts with the early age of human civilization. From the 14th century to the 18th century.
  • This era was about specific groups, including carpenter, blacksmith, goldsmith, etc. so, the management was more about handicraft shops which an individual managed with a minimal volume of persons.
  • The compensation received by employees was varied according to place, time, and situation.
  • The type of work was not clearly defined, so the remuneration of the work.

Industrial Revolution Era

  • It is the era in which the factory system began to develop, and a large group of people started working together—starting from the 18th century to the 19th century.
  • Discoveries and inventions of various machines and mechanisms led to the replacement of humans by machines and the replacement of beasts by power sources. Its ultimate effect was the increase in productivity.

Productivity: It is the measure of output obtained per unit input.

  • Specialization of labor, division of labor, professional management, the introduction of public and general laws, and disconnection of ownership from management are concepts that started taking shape in this era.
  • Contributors of Era:
  • Adam Smith: Published ‘The Wealth of Nations’ in 1776, which promoted  “Specialization of Labor.”
  • James Watt: Invented ‘Steam Engine’ in 1764, which established the example of improvement of productivity using machines.
  • Henry Slator: Introduced water and steam power in the textile industry.
  • Eli Whitney: Developed the concept of “interchangeability of parts,” which led to the rapid growth of the factory system.
  • Charles Babbage: Suggested the concept of division of labor for productivity improvement.

Scientific Management Era

  • It is the era in which scientific methods were developed and implemented for process improvement. It is the early part of the 19th century.
  • Before this era, management was supposed to be more an art than science. So, the compensation method became transformed the form of time into money through analytical and mathematical solutions.
  • Development of classical management theories, development of neoclassical theory, generation of labor laws, strengthening of the workforce, quality and economy concepts’ emergence, development of participative management, development of a democratic type of leadership are the highlights of the scientific management era.
  • Contributors of Era:
  • Fredrick Winslow Taylor: Published the book ‘Principles of Scientific Management’ in 1915. He is the “Father of Scientific Management.”
  • Lillian Gilberth & F. B. Gilberth: Worked on the analysis of fundamental motions of the parts of the body at the micro-level.
  • H. L. Gantt: Developed a chart used for scheduling and wedge incentive plans.
  • Henry Ford: Developed the idea of the use of conveyors for progressive assembly.
  • F. Wilson. Harris: Proposed Economic Order Quantity (EOQ) model.
  • Walter Shewhart: developed Statistical Quality Control (SQC)
  • Henry Fayol: Developed “Principles of Organization”.

Operation Research Era

Operation Research: It involves decision-making by arriving at solutions systematically using quantitative techniques.

  • In this era, management was accepted as a profession. It is the late part of the 19th century.
  • In this era, optimization of resources has become prime important.
  • The manager’s role gained importance as the improvement in productivity and applications of optimization models became part of the manager’s job.
  • Both work allocation and work extraction were based on suitable modeling.
  • Use of the documentation process made management more systematic.
  • Decision-making became oriented on quantitative as well as qualitative aspects.
  • Development of independent demand, time phasing, material requirement planning(MRP), capacity requirement planning(CRP), just-in-time(JIT) inventory concept, enterprise resource planning(ERP), Total quality management(TQM), poka-yoke devices started in this rea.
  • Contributors of the era:
  • Joseph Orlicky, Oliver Weight, and others: Introduced the concept of independent demand, time phasing, MRP, CRP.
  • Western side: Continued with development of manufacturing resource planning(MRP-II) systems, Just-in-time(JIT) inventory concepts, Enterprise resource planning(ERP)
  • Eastern side: Witnessed the development of quality circles, Kanban, TQM(Total Quality Management), poka-yoke devices, kaizen.

Computerized Systems Era

The electronic and computerized systems developed till the date started with the development of microprocessors. Also known as chips. In this era of computerized systems. It is the early part of the 20th century.

Microprocessor: It is a processing element used in computers.

  • In this era, the process of management was computerized and automated with little or no human effort.
  • “You set a system-then it sets you” was the believed principle of the management.
  • Planning, designing, processing, transporting, information transmission, and communication are the human efforts that were replaced by machinery.
  • System approach accepted for the management.
  • Following are some of the developments which are developed in recent past years:
  • AGV-Automatic Guided Vehicle
  • AS/RS-Automatic Storage and Retrieval Systems
  • Computer Graphics
  • Computer animation
  • Automatic receipt
  • CNC- Computer/numerical controlled machinery
  • CAPP-Computer Aided Process Planning
  • CAD-Compuer Aided Design
  • CAM-Computer Aided Manufacturing
  • Computer-Aided Plant Layout Planning
  • Simulation and Modeling
  • HRM-Human Resource Management
  • Boundaryless and Virtual organization structure

Characteristics of Management

Following are the important characteristics of management:

  1. Management is scientific and mathematical.

The organizational goals are achieved by management with the help of scientific techniques and mathematical tools.

  • Management is art and tact.

Management is considered as the art of getting things done very often.

  • Management is a system of authority and responsibility.

In management, authority and responsibility go hand in hand.

  • Management is accountability

The accountability characteristic of management makes it effective and efficient.

  • Management is goal-oriented

Management is about clearly defined objectives and moving towards them successfully.

  • Management is a distinct process.

Each activity of management distinctly signifies and describes the method and style of fany functioning.

  • Management is decision-making.

A correct decision for management leads to grand success, while a wrong decision leads to failure.

  • Management is economic efficiency.

Economics is the major factor of management.

  • Management is the welfare of mankind.

To have concern for people and their welfare is very important for management.

  1. Management is an experience.

Experiences and minute records characterize the management continuity.

  1. Management is team building through coordination.

A group of people does management.

  1. Management is a profession: Management needs to apply scientific principles; therefore, it is considered a profession.
  2. Management is universal

Management is found in every act of human beings.

  1. Management is dynamic: Changing environment brings management changes.

Important Questions and Answers

What is scientific management? | Which of the following best describes scientific management?

Scientific management means knowing exactly what you want men to do and seeing that they do it in the best and cheapest way.

Who is the father of scientific management?

Fredrick Winslow Taylor is known as the father of scientific management.

Frederick Winslow Taylor
Fredrick Winslow Taylor: father of scientific management, has introduced scientific principles

What is the four Ms of management?

Men, material, machines, and methods are the four Ms of management.

With respect to the development of scientific management, Frederick Taylor’s objective was to

Scientifically determine the most efficient way to perform a task and then teaching it to people.
Which person developed the model of Economic Order Quantity?

F. Wilson Harris developed the model of EOQ.

What are the characteristics of scientific management?

Following are the important characteristics of management:

  1. Management is scientific and mathematical
  2. Management is art and tact
  3. Management is a system of authority and responsibility
  4. Management is accountability
  5. Management is goal-oriented
  6. Management is a distinct Process
  7. Management ids decision making
  8. Management is economic efficiency
  9. Management is the welfare of mankind
  10. Management is an experience
  11. Management is team building through coordination
  12. Management is a profession.
  13. Management is universal
  14. Management is dynamic

What are scientific principles?

Scientific principles are the answers of why and how of basic laws and rules of nature which are accepted by scientists. These scientific principles cannot be written in the mathematical forms. F. W. Taylor was the person who introduced these scientific principles and study in the field of management.

What are Scientific Principles of Sustainability?

Sustainability is defined as the series of actions or processes through which human being tries to avoid the depletion of nature and natural resources. Scientific Principles of Sustainability emphasizes on pollution prevention, waste reduction and management, population stabilization, etc.

There are four main scientific principles of sustainability:

1) Reliance on Solar Energy

2) Biodiversity

3) Population Control

4) Nutrient Cycling

Every company should follow these four scientific principles while establishing and managing a company

 Click Here for more such articles

    Isentropic Process: 5 Important Factors Related To It

    isentrophic

    Topic of discussion: Isentropic process

    Isentropic Definition

    A typical case of an adiabatic process that has no transfer of heat or matter through the process while the entropy of the system remains constant is known as an isentropic process.

    The thermodynamic process where the entropy of the gas or fluid remains constant can also be coined as the reversible adiabatic process. This type of process that is both adiabatic in nature and internally reversible while considering that it is frictionless enables the engineering sector to view this as an idealized process and a model for comparing actual processes.

    isentrophic
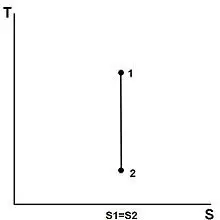
    Isentropic process graph
    Tyler.neysmithIsentropicCC BY-SA 3.0

    Ideally, enthalpy of the system is used in the particular isentropic process as the only variables changing are internal energy dU and system volume ΔV while the entropy remains unchanged.

     The T-s diagram for an isentropic process is plotted based on the known traits varying from different states such as the pressure and temperature quantity. Since,

     ΔS = 0 or s1 = s2

    And,

    H = U + PV

    They are intrinsically related to the first law of thermodynamics in terms of enthalpy measure. Since it both reversible and adiabatic, the equations formed would be as follows:

    Reversible \\rightarrow dS=\\int_{1}^{2}\\left ( \\frac{\\delta Q}{T} \\right )_{rev}

    Adiabatic\\rightarrow Q=0 \\Rightarrow dS=0

    In enthalpy terms,

    dH=dQ+VdP

    Or,

    dH=TdS+VdP

    The water, refrigerants, and ideal gas can be derived using the equations in the molar form to deal with the enthalpy and temperature relation. At the same time, the specific entropy of the system remains unchanged.

    From the enthalpy equation abiding by the first law of thermodynamics, VdP is considered a flow process work where a mass flow is involved as work is required to transfer the fluid in or out of the boundaries of the control volume. This flow energy (work) is generally utilized for systems with the difference in pressure dP, like an open flow system found in turbines or pumps. By simplifying the energy transfer description, it is derived that enthalpy change is equivalent to flow energy or process work done on or by the system at constant entropy.

    For,

    dQ=0

    dH=VdP

    \\rightarrow W=H_{2}-H_{1}

    \\rightarrow H_{2}-H_{1}=C_{p}\\left ( T_{2}-T_{1} \\right )

    Isentropic process for an ideal gas

    Now, for an ideal gas, the isentropic process where entropy changes are involved can be represented as:

    \\Delta S=s_{2}-s_{1}

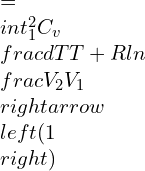
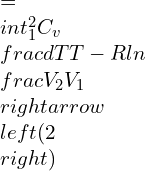
    =\\int_{1}^{2}C_{v}\\frac{dT}{T}+Rln\\frac{V_{2}}{V_{1}} \\rightarrow \\left ( 1 \\right )

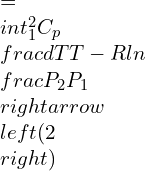
    =\\int_{1}^{2}C_{p}\\frac{dT}{T}-Rln\\frac{P_{2}}{P_{1}} \\rightarrow \\left ( 2 \\right )

    \\Delta S\\rightarrow 0

    equation \\left ( 1 \\right )\\rightarrow 0

    =\\int_{1}^{2}C_{v}\\frac{dT}{T}-Rln\\frac{V_{2}}{V_{1}} \\rightarrow \\left ( 2 \\right )

    Integrating and rearranging,

    C_{v}ln\\frac{T_{2}}{T_{1}}=-Rln\\frac{V_{2}}{V_{1}}

    (this is by assuming constant specific heats)

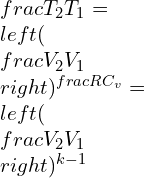
    \\frac{T_{2}}{T_{1}}=\\left ( \\frac{V_{2}}{V_{1}} \\right )^{\\frac{R}{C_{v}}}=\\left ( \\frac{V_{2}}{V_{1}} \\right )^{k-1}

    Where k is the specific heat ratio

    k=\\frac{C_{p}}{C_{v}}; R=C_{p}-C_{v}

    Now, setting

    equation \\left ( 2 \\right )\\rightarrow 0

    \\int_{1}^{2}C_{p}\\frac{dT}{T}=Rln\\frac{P_{2}}{P_{1}}

    \\Rightarrow C_{p}ln\\frac{T_{2}}{T_{1}}=Rln\\frac{P_{2}}{P_{1}}

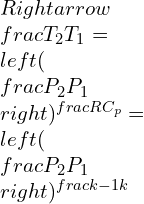
    \\Rightarrow \\frac{T_{2}}{T_{1}}=\\left ( \\frac{P_{2}}{P_{1}} \\right )^{\\frac{R}{C_{p}}}=\\left ( \\frac{P_{2}}{P_{1}} \\right )^{\\frac{k-1}{k}}

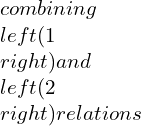
    combining \\left ( 1 \\right ) and \\left ( 2 \\right )relations

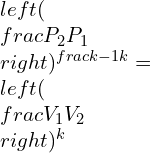
    \\left ( \\frac{P_{2}}{P_{1}} \\right )^{\\frac{k-1}{k}}=\\left ( \\frac{V_{1}}{V_{2}} \\right )^{k}

    Consolidated expressions of the three relations of the equations in compact form can be projected as:

    TV^{k-1}=constant

    TP^{\\frac{1-k}{k}}=constant

    PV^{k}=constant

    If the specific heat constant assumptions are invalid, the entropy change would be:

    \\Delta S=s_{2}-s_{1}

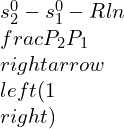
    s_{2}^{0}-s_{1}^{0}-Rln\\frac{P_{2}}{P_{1}}\\rightarrow \\left ( 1 \\right )

    equation\\left ( 1 \\right )\\rightarrow 0

    \\frac{P_{2}}{P_{1}}=\\frac{exp\\left ( \\frac{s_{2}^{0}}{R} \\right )}{exp\\left ( \\frac{s_{1}^{0}}{R} \\right )}

    If the numerator of the above equation is construed as the relative pressure, then:

    \\left ( \\frac{P_{2}}{P_{1}} \\right )_{s}=constant=\\frac{P_{r2}}{P_{r1}}

    Pressure vs temperature values are tabulated against each other. Hence, the ideal gas relation produces:

    \\frac{V_{2}}{V_{1}}=\\frac{T_{2}P_{1}}{T_{1}P_{2}}

    Replacing \\rightarrow \\frac{P_{r2}}{P_{r1}}

    \\left ( \\frac{V_{2}}{V_{1}} \\right )=\\frac{\\left ( \\frac{T_{2}}{P_{r2}} \\right )}{\\left ( \\frac{T_{1}}{P_{r1}} \\right )}

    Defining the relative specific volume,

    \\left ( \\frac{V_{2}}{V_{1}} \\right )_{s}=constant=\\frac{V_{r2}}{V_{r1}}

    Isentropic process derivation

    The total energy change in a system:

    dU=\\delta W+\\delta Q

    A reversible condition involving work with pressure is,

    As established earlier,

    dH=dU+pdV+Vdp

    For isentropic,

    \\delta Q_{rev}=0

    And,

    dS=\\frac{\\delta Q_{rev}}{T}=0

    Now,

    dU=\\delta W+\\delta Q=-pdV+0,

    dH=\\delta W+\\delta Q+pdV+Vdp=-pdV+0+pdV+Vdp=Vdp

    Capacity ratio:

    \\gamma =-\\frac{\\frac{dp}{p}}{\\frac{dV}{V}}

    cp - cv = R

    1 - \\frac{1}{\\gamma } = \\frac{R}{C_{p}}

    \\frac{C_{p}}{R} = \\frac{\\gamma }{\\gamma -1}

    p = r * R * T

    Where, r=density

    ds = \\frac{C_{p}dT}{T} - R \\frac{dp}{p}

    As dS=0,

    \\frac{C_{p}dT}{T} = R \\frac{dp}{p}

    After substitution of PV=rRT equation in the above equation,

    Cp dT = \\frac{dp}{r}

    \\Rightarrow (\\frac{C_{p}}{r}) d(\\frac{p}{r}) = \\frac{dp}{r}

    Differentiating,

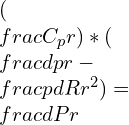
    (\\frac{C_{p}}{r}) * (\\frac{dp}{r} - \\frac{pdR}{r^{2}}) = \\frac{dP}{r}

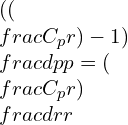
    ((\\frac{C_{p}}{r}) - 1) \\frac{dp}{p} = (\\frac{C_{p}}{r}) \\frac{dr}{r}

    Substituting the gamma equation,

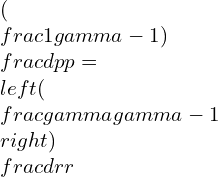
    (\\frac{1}{\\gamma -1}) \\frac{dp}{p} = \\left ( \\frac{\\gamma }{\\gamma -1} \\right )\\frac{dr}{r}

    Simplifying the equation:

    \\frac{dp}{p} = \\gamma \\frac{dr}{r}

    Integrating,

    \\frac{p}{r^{\\gamma }} = constant

    For the flow brought to rest isentropically, the total pressure and density occurring can be evaluated as a constant.

    \\frac{p}{r^{\\gamma }} = \\frac{pt}{rt^{\\gamma }}

    \\frac{p}{pt} = \\left ( \\frac{r}{rt} \\right )^{\\gamma }

    pt being the total pressure and rt being the total density of the system.

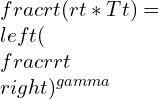
    \\frac{rt}{(rt * Tt) } = \\left ( \\frac{r}{rt} \\right )^{\\gamma }

    \\frac{T}{Tt} = \\left ( \\frac{r}{rt} \\right )^{\\gamma -1}

    Now, by combining the equations:

    \\frac{p}{pt} = \\left ( \\frac{T}{Tt} \\right )^{\\frac{\\gamma }{\\gamma -1}}

    Isentropic work equation

    W=\\int_{1}^{2}PdV=\\int_{1}^{2}\\frac{K}{V^{\\gamma }}dV

    \\Rightarrow W=\\frac{K}{-\\gamma +1}\\left [ \\frac{V_{2}}{V_{2}^{\\gamma }}-\\frac{V_{1}}{V_{1}^{\\gamma }} \\right ]

    \\Rightarrow W=\\frac{1}{-\\gamma +1}\\left [ \\left ( \\frac{K}{V_{1}^{\\gamma }} \\right )V_{1}-\\left ( \\frac{K}{V_{2}^{\\gamma }} \\right )V_{2} \\right ]

    \\Rightarrow W=\\left ( \\frac{1}{\\gamma -1} \\right )\\left [ P_{1}V_{1}-P_{2}V_{2} \\right ]

    \\Rightarrow W=\\left ( \\frac{1}{\\gamma -1} \\right )\\left [ nRT_{2}-nRT_{1} \\right ]

    \\therefore W=\\frac{nR\\left ( T_{2}-T_{1} \\right )}{\\gamma -1}

    While satisfying the isentropic equations respectively under enthalpy and entropy values.

    Isentropic turbine and isentropic expansion

    \\eta _{T}=\\frac{Actual Turbine work}{Isentropic Turbine work}

    \\Rightarrow \\frac{W_{real}}{W_{s}}

    \\Rightarrow \\frac{h_{1}-h_{2r}}{h_{1}-h_{2s}}

    For the purpose of calculations, the adiabatic process for the steady flow devices such as turbines, compressors or pumps is ideally generated as an isentropic process. Specific ratios are evaluated for calculating the efficiency of steady flow machines by including parameters that intrinsically affect the overall system of the process.

    Typically, the particular device’s efficiency ranges from 0.7-0.9, which is about 70-90%.

    While,

    \\eta _{C}=\\frac{Isentropic Compressor work}{Actual Compressor work}

    \\Rightarrow \\frac{W_{s}}{W_{real}}

    \\Rightarrow \\frac{h_{2s}-h_{1}}{h_{2r}-h_{1}}

    Summary and conclusion

    The Isentropic process, ideally known as a reversible adiabatic process, is exclusively used in the various thermodynamic cycles such as Carnot, Otto, Diesel, Rankine, Brayton cycle and so on. The numerous mathematical equations and tables plotted utilizing the isentropic process parameters are basically used to determine the efficiency of gases and flows of the systems that are steady in nature such as turbines, compressors, nozzles, etc.

    To read more about mechanical related articles click here

    Adiabatic Process: 7 Interesting Facts To Know

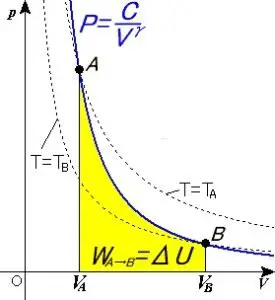
    Adiabatic process jpeg 275x300 1

    Topic of Discussion: Adiabatic Process

    • Adiabatic process definition
    • Adiabatic process examples
    • Adiabatic process formula
    • Adiabatic process derivation
    • Adiabatic process work done
    • Reversible adiabatic process and Irreversible adiabatic process
    • Adiabatic graph

    Adiabatic process definition

    Abiding the first law of thermodynamics, the process occurring during expansion or compression where there is no heat exchanged from the system to the surroundings can be known as an adiabatic process. Differing from the isothermal process, adiabatic process transfers energy to the surrounding in the form of work. It can be either reversible or an irreversible process.

    In reality, a perfectly adiabatic process can never be obtained since no physical process can happen spontaneously nor a system can be perfectly insulated.

    Following the first law of thermodynamics that says when energy (as work, heat, or matter) passes into or out of a system, the system’s internal energy changes accordingly with the law of conservation of energy, where ​E​ can be denoted as the internal energy, while ​Q​ is the heat added to the system and ​W​ is the work done.

    ΔE=QW

    For an adiabatic process where there is no heat exchanged,

    ΔE=−W

    Conditions required for an adiabatic process to take place are:

    • The system must be completely insulated from its surroundings.
    • For the heat transfer to occur in a sufficient amount of time, the process must be performed quickly.
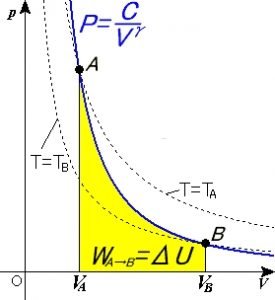
    Adiabatic Process
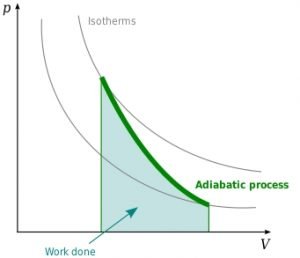
    Adiabatic Process Graphical Curve Image credit : “File:Adiabatic process.png” by Yuta Aoki is licensed under CC BY-SA 3.0

    Adiabatic process Example

    1. Expansion process in an internal combustion engine found among hot gases.
    2. The quantum-mechanic analogue of an oscillator classically known as the quantum harmonic oscillator.
    3. Gases liquified in a cooling system.
    4. Air released from a pneumatic tire is the most significant and common instance of an adiabatic process.
    5. Ice stored in an icebox follows the principles of heat not being transferred in and out to the surroundings.
    6. Turbines, using heat as a medium to generate work, is considered an excellent example as it reduces the efficiency of the system as the heat is lost to the surroundings.
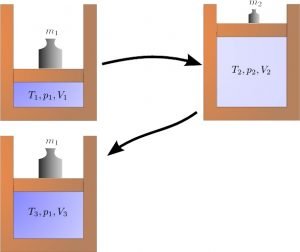
    Exaple of adiabetic process
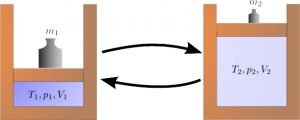
    Adiabatic Process Example piston movement. Image credit : AndlausAdiabatic-irrevisible-state-changeCC0 1.0

    Adiabatic process formula

    The expression of an adiabatic process in mathematical terms can be given by:

    ΔQ=0

    Q=0,

    ΔU= -W, (since there is no heat flow in the system)

    U= frac{3}{2} nRDelta T= -W

    Therefore,

    W= frac{3}{2} nR(T_{i} - T_{f})

    Consider a system where the exclusion of heat and work interactions on a stationary adiabatic process is performed. The only energy interactions are the boundary work by the system in its surroundings.

    delta q=0=dU+delta W,

    0=dU+PdV

    Ideal gas

    The amount of thermal energy per unit temperature unavailable to perform specific work can be defined as the entropy of a system. A speculative gas that comprises the random motion of point particles subject to interparticle molecular interactions is ideal.

    The molar form of the ideal gas formula is given by:

    P.V=R.T

    dU = C_{v} . dT

    C_{v}dT + (frac{R.T}{V})dV = 0

    rightarrow frac{dT}{T}= -(frac{R}{C_{v}}) frac{dV}{V}

    Integrating the equations,

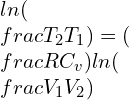
    ln(frac{T_{2}}{T_{1}}) = (frac{R}{C_{v}})ln(frac{V_{1}}{V_{2}})

    left ( frac{T_{2}}{T_{1}} right )=left ( frac{V_{1}}{V_{2}} right )frac{R}{C_{v}}

    Adiabatic process equation can be denoted as:

    PVY = constant

    Where,

    • P= pressure
    • V= volume
    • Y= adiabatic index; (Cp/Cv)

    For a reversible adiabatic process,

    • P1-YTY = constant,
    • VTf/2 = constant,
    • TVY-1 = constant. (T = absolute temperature)

    This process is also known as the isentropic process, an idealized thermodynamic process containing frictionless work transfers and adiabatic. In this reversible process, there is no transfer of heat or work.

    Adiabatic process derivation

    The alteration in internal energy dU in a system to work done dW plus the heat added dQ to it can be associated as the first law of thermodynamics through which the adiabatic process can be derived.

    dU=dQ-dW

    According to the definition, 

    dQ=0

    Hence,

    dQ=0=dU+dW

    Addition of heat escalates the amount of energy U defining the specific heat as the amount of heat added for a unit rise in temperature change for 1 mole of a substance.

    C_{v}=frac{dU}{dT}(frac{1}{n})

    (n is the number moles), Therefore:

    0=PdV+nC_{v}dT

    Derived from the ideal gas law,

    PV=nRT

    PdV +VdP=nRdT

    Merging equation 1 and 2,

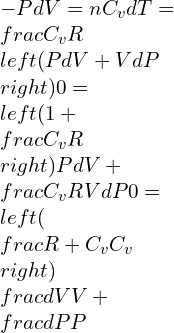
    -PdV =nC_{v}dT = frac{C_{v}}R left ( PdV +VdP right )0 = left ( 1+frac{C_{v}}{R} right )PdV +frac{C_{v}}{R}VdP0=left ( frac{R+C_{v}}{C_{v}} right )frac{dV}{V}+frac{dP}{P}

    For a constant pressure Cp, heat is added and,

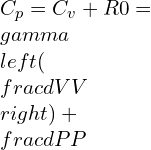
    C_{p}=C_{v}+R0 = gamma left ( frac{dV}{V} right )+frac{dP}{P}

    γ is the specific heat

    gamma = frac{C_{p}}{C_{v}}

    Using the integration and differentiation concepts, it is arrived at:

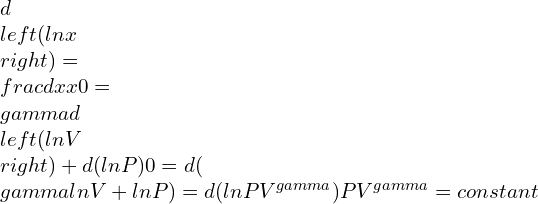
    dleft ( lnx right )= frac{dx}{x}0=gamma dleft ( lnV right ) + d(lnP)0=d(gamma lnV+lnP) = d(lnPV^{gamma })PV^{gamma }= constant

    This equation above becomes real for a given ideal gas that contains the adiabatic process.

    Adiabatic process Work done.

    For a pressure P and a cross-sectional area A moving through a small distance dx, the force acting would be given by:

    F=PA

    And the work done on the system can be written as:

    dW=Fdx  =PAdx  =PdV

    Since,

    dW=PdV

    The net work produced for the expansion of the gas from the volume of the gas Vi to Vf (initial to the final) will be given as

    W= area of ABDC from the graph plotted as the adiabatic process takes place. The conditions to be followed are associated with an example of a perfectly non-conducting piston cylinder with a single gram molecule of a perfect gas. The cylinder’s container is to be made of an insulating material, and the curve plotted by the graph should be sharper.

    Whereas, in an analytical method to derive the work done on the system would be as follows:

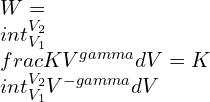
    W=int_{0}^{W}dW=int_{V_{1}}^{V_{2}}PdV —–(1)

    Initially, for an adiabatic change, we can assume:

    PV_{gamma }=constant = K

    Which can be,

    9

    From (1),

    W=int_{V_{1}}^{V_{2}}frac{K}{V^{gamma }}dV=Kint_{V_{1}}^{V_{2}}V^{-gamma }dV

    W=kleft | frac{V^{1-gamma }}{1-gamma } right |=frac{K}{1-gamma }left [ V_{2}^{1-gamma }-V_{1}^{1-gamma } right ]

    For solving,

    P_{1}V_{1}^{gamma }=P_{2}V_{2}^{gamma }=K

    Thus,

    13

    Which is,

    14 1

    Taking T1 and T2 as the initial and final temperatures of the gas respectively,  

    P_{1}V_{1}^{gamma }=P_{2}V_{2}^{gamma }=K

     Using this in equation (2),

    W=left [ frac{R}{1-gamma } right ]left [ T_{2}-T_{1} right ]

    Or,

    W=left [ frac{R}{gamma-1 } right ]left [ T_{1}-T_{2} right ] —-(3)

    The heat required during the expansion process to do the work is:

    18 1

    =left [ frac{R}{J(gamma-1)} right ]left [ T_{1}-T_{2} right ]

    As R is the universal gas constant and during adiabatic expansion, the work done is directly proportional to the decrease in temperature, while the work done during an adiabatic compression is negative.

    Hence,

    W=-left [ frac{R}{gamma-1} right ]left [ T_{1}-T_{2} right ]

    Or,

    W=-left [ frac{R}{1-gamma} right ]left [ T_{2}-T_{1} right ] ----left ( 4 right )

    This can be given as the work done in an adiabatic process.

    And the heat expelled during the process is:

    2 2

    Adiabatic graph

    Adiabatic process1
    Various curves in thermodynamic process
    image credit : User:StanneredAdiabaticCC BY-SA 3.0

    The mathematical representation of the adiabatic expansion curve is represented by:

    PV^{gamma }=C

    P,V,T are the pressure, volume, and temperature of the process. Considering the initial stage conditions of the system as P1, V1, and T1, also defining the final stage as P2, V2, and T2 respectively the P-V graph diagram is plotted essentially for a piston cylinder movement heated adiabatically from the initial to final state for a m kg of air.

    Adiabatic entropy, adiabatic compression and expansion

    A gas allowed to expand freely without the transfer of external energy to it from higher pressure to a lower pressure will essentially cool by the law of adiabatic expansion and compression. Likewise, a gas will heat up if it is compressed from a lower temperature to a more significant temperature without the substance’s transfer of energy.

    • Air parcel will expand if the surrounding air pressure is reduced.
    • There is a decrease in temperature at higher altitudes due to the diminish in the pressure as they are directly proportional in the case of this process.
    • Energy can either be utilized to do work for expansion or to maintain the temperature of the process and not both at the same time.

    Reversible adiabatic process

    reversible
    Reversible Adiabatic process image credit : AndlausAdiabatic-reversible-state-changeCC0 1.0

    dE=frac{dQ}{dT}

    The frictionless process where the system’s entropy remains constant is coined as the term reversible or isentropic process. This means that the change in entropy is constant. The internal energy is equivalent to the work done in the expansion process.

    Since there is no heat transfer,

    dQ=0

    Thus,

    frac{dQ}{dT}=0

    Which means that,

    dE=0

    Examples of a reversible isentropic process can be found in gas turbines.

    Irreversible adiabatic process

    As the name suggests, the internal friction dissipation process resulting in the change in entropy of the system during the expansion of gases is an irreversible adiabatic process.

    This generally means the entropy increases as the process furthers that cannot be performed at equilibrium and cannot be tracked back to its original state.

    To know about Thermodynamics click here

    Thermal Insulation: 5 Important Facts You Should Know

    fiberglass 300x283 1

    Topic of Discussion: Thermal insulation

    Thermal insulation definition

    When two objects are in thermal contact with each other or under the influence of radiation, the process of depletion of heat transfer among the entities is known as thermal insulation. It is quite the opposite of what thermal conductivity can be defined as. Essentially, an object with very low thermal conductivity can be regarded as a well-insulated material. 

    Thermal insulator

    While thermal insulation is the process of depletion of heat transfer, thermal insulators are materials that employ the insulation process. It prevents heat energy from being transferred from one object to another. This can be viewed in detail from a thermodynamics perspective while comprehending heat energy principles and more.

    Heat Insulation

    It is a form of energy that depends upon another factor called temperature. The transfer of energy in the form of heat from one body to another result in a temperature difference. Heat usually flows from a hotter to a colder body. It plays a significant role in the principles of thermodynamics. If a body is cold, it means that heat is removed and not coldness added, which brings about a fun fact about this form of energy.

    Heat can be transferred by three different means.

    1. Conduction
    2. Convention
    3. Radiation

    Conduction is the energy transfer process between two objects where the medium of exchange is through direct contact. At the same time, convection is the transfer of energy through the motion of matter, using air as a medium. Radiation is the transfer process that happens without any medium but with the aid of electromagnetic waves.

    The three equations concerning the three forms of heat transfer are as follows,

    Conduction: Q = [k · A · (Thot – Tcold)]/d

    Convection: Q = hc · A · (Ts – Tf)

    Radiation: P = e · σ · A · (Tr4 – Tc4) (Using Stefan-Boltzmann law)

    Examples of the modes of transfer that can be found in our everyday life under conduction can be as simple as accelerated vibrating molecules in the hand when in contact with a hot coffee mug. This means that the hand has heated up where the transfer of energy took place through direct contact. 

    A typical example of convection would be refrigeration, where the food items kept in the fridge would essentially get cold through convection of air and other coolants. 

    Radiation is the mode of transfer through a void, such as the heat from the sun that reaches the earth.

    Why thermal insulation? Its purposes and requirements

    The objective of thermal insulation is to moderate the temperature in something as small as an individual house to as complex as a nuclear reactor. Thermal insulation is to fortify the constructional elements against damage caused by moisture or thermal impact on the component. The wear on the object or the part can be decreased during winter with thermal insulation, which serves the purpose of energy conservation. At the same time, during the summer, overheating is significantly depleted. 

    Advantages of thermal insulation

    Thermal insulation creates an optimum environment that keeps the surroundings warm in the winter and chill during the summer, enabling a comfortable living and operating. Due to the demand for a comfortable lifestyle environment, thermal insulation greatly enhances energy conservation and maintenance costs. It also helps prevent the deposition of moisture on the interior walls of a room or a container that can be caused due to the effect of temperature and humidity.

    Thermal insulation materials

    1. Fiberglass
    2. Polyurethane foam
    3. Cellulose
    4. Polystyrene
    5. Mineral wool

    Thermal insulation Fiberglass: 

    it is the most common and frequently used for thermal insulation method in modern-day houses. It is derived from finely woven silicon, recycled glass fragments, and sand particles containing glass powder. 

    Fiberglass or glass wool is generally used as an acoustic insulation material, an indoor material applied under pitched roofs or wooden floors. Since fiberglass loses their value insulation when in contact with damp or moisture, they are mostly seen inside homes and not outside.

    Insulation values of the material are given by,

    • Density = 25 kg/m³
    • Heat storage capacity = 800 J/kgK
    • Fire class => A2, S1, d0 (extinguish by self and low flame ability)
    • λ= 0.032 to 0.040 W/mL-K
    • Diffusion resistance: 1

    Cellulose:

    This type of thermal insulation method is considered one of the most eco-friendly processes in the modern-day. Cellulose comprises 70-80% recycled denim, paper or cardboard in the form of loose foam heavily treated (15% volume) with (NH₄)₂SO₄, boric acid or borax. It is considered the best form of thermal insulation against fire resistance solutions that are essentially used to moderate heat loss and gain noise transmission. 

    Properties of cellulose, 

    • Thermal conductivity = 40 mW/m·K 
    • R value = R-2.6 to R-3.8 per 100mm 
    • Density = 57 kg/m3

    Mineral wool:

    The glass wool or mineral wool is used widely for its functional properties, easy purchase, and simple handling. Mineral wool comprises spun yarn manufactured from melted or recycled glass or stone (rock wool). Rock wool is made from basalt, where the threads are combined in a unique way for a wooly structure to be formed for insulation. Hereafter the wool is compressed into mineral batts or boards that can be purchased off the market for insulation purposes. 

    Mineral wool is generally used to Insulate cavity walls, exterior walls, partition walls, and stored floors. They are also extensively applied in industrial applications like machines, air conditioners, etc. 

    Properties: 

    • λ= 0.03 W/mK to 0.04 W/mK
    • Density= 30-200 kg/m³
    • R= 0.035 W/mK
    mineral wools
    Mineral wool
    Image credit: Achim HeringRockwool 4lbs per ft3 fibrex5CC BY 3.0

    Polystyrene:

    This is also commonly known as styrofoam, is a waterproof thermoplastic foam that insulates temperature and sound very effectively. They come in two types: EPS (expanded) and XEPS(extruded), differing in cost and performance. They possess a very smooth surface of insulation not found in any other types, usually created into cut blocks, making it very ideal for insulation. The foam is sometimes flammable and requires a coating of Hexabromocyclododecane (HBCD), a fireproofing chemical. 

    Its significant advantages are that it possesses magnificent cushioning properties, lightweight in nature, low thermal conductivity, and absorbs very little moisture, mostly 98% air and 100% recyclable. 

    Properties: 

    • R= 4-5.5
    • Density= 0.05 g/cm3
    • λ= 0.033 W/(m·K)
    • Refractive index= 1.6
    pollystrene
    Polystyrene
    Image credit:PhyrexianPolistiroloCC BY-SA 3.0

    Polyurethane foam:

    It is the most abundant and exceptional form of thermal insulation utilizing non-chlorofluorocarbon (CFC) as a blowing agent to decrease the ozone layer’s damage. They are low-density foams that consist of low conductivity gas in their shells that can be sprayed onto the insulated areas. 

    They are lightweight in relativity and weigh almost 2lb/ft3. They are also fire-resistant and used on surfaces like brick blocks, concrete, etc., by direct fixation. It is also used in the case of unfinished masonry by cutting the foam into the desired shape and size. The foam is then covered with constructive adhesive, pressing it against the masonry surface and seal the joints between the sheets with the expanding foam. 

    Properties:

    • λ= 0.022 W/mK to 0.028 W/mK
    • Density= 30 kg/m3 to 100 kg/m3
    • R= 6.3/ inch of thickness

    Types of thermal Insulation

    Blanket: Batt and Roll Insulation

    The most well-known and broadly accessible sort of insulation is Blanket insulation, which comes in Batts or Rolls. It comprises flexible fiber, fiberglass’s. Batts and Rolls are also finished from mineral-wool, plastic, and natural fiber, such as cotton and sheep’s wool. The Blanket insulation is most likely to be used in unfinished walls, floors, and ceilings and these insulation could easily be fitted in-between studs, joists, and beams. This insulation type is highly used since it is suited for standard stud and joist spacing that is comparatively free from different obstruction. This type is also relatively expensive in comparison to the others.

    Concrete Block thermal Insulation

    Concrete block insulation is incorporated in several ways, like adding foam bead or air into the concrete mixture to get the desired R-values. Concrete Block insulation is widely used for unfinished walls, including foundation walls, and is also used prominently for construction and renovation. Installation requires specialized skills like stacking, insulating concrete blocks without using mortar, and surface bonding. The cores are insulated to achieve R’s desired values, which helps us moderate temperatures as well.

    Insulating Concrete foam 

    The material used in the making of this is foam boards or foam blocks. This type of insulation is highly used to complete unfinished walls, as well as foundation walls for new construction. They are incorporated as a part of the building assembly also. This category of insulation is highly in use for construction. Since they are built into the home’s walls, it increases the thermal resistance.

    Rigid fibrous or fiber insulation

    Fiberglass and mineral wool are used to assimilate fiber insulation. Rigid fibrous insulation is highly used in regions that withstand high temperatures and often used for ducts in unconditioned spaces. Fiber insulation is established by HVAC contractors, usually manufactures the insulation and install them onto vents. These are mainly utilized for the reason of its ability to withstand high temp.

    Structural insulated panels (SIPs)

    This is primarily foam-board or liquid-foam insulation core and straw-core insulation. They are incorporated in unfinished walls, ceilings, floors, and the initial construction of roofs. They are implemented by construction workers who fit SIPs together to form walls and roofs. The perks of using this type of insulation provide consistent and higher insulation compared to traditional insulation. SIPs take a limited amount of time to implement.

    Thermal insulation in the nuclear sector

    The generic idea of a nuclear power plant is that it is utilized to generate electricity with nuclear fission. 

    Nuclear reactor cores serve a particular purpose in energy-releasing enormous amounts of heat and work output. The containment of the nuclear reactor in an container is a large space incorporating the nuclear steam supply system (NSSS).

     The NSSS has a reactor, valves, pipe, pumps, and other various components and equipment. The NSSS produces a very substantial net positive heat load. Insulation on hot pipe and equipment inside the reactor has one objective: to control containment cooling loads. Containment cooling is performed to remove that heat linked directly to a water body (river, lakes, etc.) or vapor compression cooling such as air conditioning. The nuclear plants’ technical specifications will be alarmed if heat source release heat more than the cooling rate in standard.

    Thermal properties of insulation

    There are particular primary considerations to be chosen during the selection process of insulation. These properties vary with the material selected, ranging from wool to nuclear reactor thermal insulation. The difference in the insulation types’ thermal properties makes a difference in the amount of efficiency, performance, and sustainability. 

    The various properties to be considered are: 

    Emissivity (E):

    A material written as ε is defined as the ratio of energy radiated by the material to the energy emitted by a black body at a similar temperature. In layman’s terms, it is useful in emitting energy as thermal radiation such as infrared energy.

    Thermal conductance (C):

    It can be termed by the unit temperature difference between two bodies that infer the time rate of a steady-state heat flow through a unit area of the given material. 

    bjCz9G XsPnaeRlYz0OdgrADcC6Iq1g9ZOMW 57mf7 PEGSa1hrVgOokYQwvREW hZWJ9VcGvF9 8sfTiirOEYqr8OebzZhjObpLgrjTR35OjctgaC1JNkpRn3L5C3YrKqr5edI

    Temperature limits:

    upper and lower levels of temperature should be satisfied by the materials chosen for insulation. 

    Thermal resistance (R-Value): the temperature difference between two surfaces induces a unit heat flow rate through the objects’ unit area (K.m2/W). 

    Thermal transmittance (U):

    through an assembly, heat flow’s overall conductance is coined as thermal transmittance. 

    Thermal conductivity (k-value): 

    AWp75pQ1x5w499fU184t5dlL RsgXVEU v7NmkDEd jUWZscZ 5IABciK9Cd D5hHhUfuzGU15Sufptt X7Dj6wf9gb6TAiMhqItmmI2hCIMCSTlP QfVDVb6vjr lF4JN2obh0

    Where, L= thickness of the material, (m)

    T= temperature, (K)

    q = heat flow rate, (W/m2)

    To learn more about thermodynamics click here!


    Mohr’s Circle: 9 Important Facts You Should Know

    E10

    In real life, we may encounter many cases in which material is applied to tension or compression in 2 perpendicular direction at that time. The stress applied in such a case is known as biaxial stress. A balloon is a perfect example of it.

    These tensile/compressive stresses also produce shear stress in the material. To calculate the net tensile and shear stress produced in the material, a graphical method is used known as Mohr’s Circle for biaxial stress.

    Mohr’s circle is an advantageous and easy way to solve stress equations. It gives the information about the stresses on various planes.

    Topic of Discussion: Mohr’s Circle

    How to Draw Mohr’s Circle | How Do You Plot Mohr’s Circle?

    Let us consider a thin sheet subjected to biaxial tension, as shown in the following figure. The normal and shear stress on a plane whose normal n have an angle of ϕ with the x-axis are specified as follows:

    Mohr's Circle: Biaxial Tension

    E1

    From the above equations, it can be said that these equations can be plotted as a circle in a normal stress-shear stress plane where angle ϕ acts as a parameter.

    As we know:

    E2

    So, normal stress and shear stress can be represented in more compact form as follow:

    E3

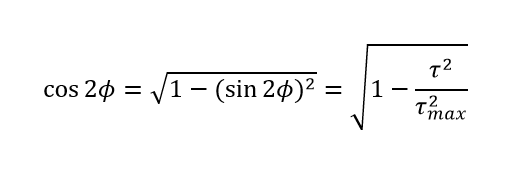
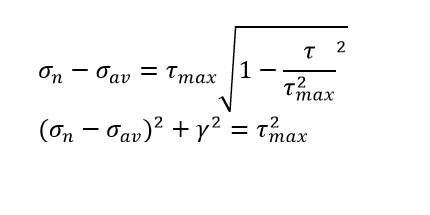
    By solving the above equations and eliminating parameter ϕ.

    E4

    Substitute of this in the first of

    E5

    The above equation denotes the standard form of the equation of a circle.

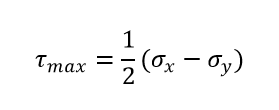
    On solving the above equation, we get that radius of the circle formed is

    E6

    The Center of the circle formed is on σ-axis denoted as

    E7

    Circle formed on the σ-τ plane with the above parameters is known as Mohr ‘s Circle.

    Mohr's Circle


    If the applied principal stress applied is of compression kind, it must be taken with the negative sign.

    Thus, the origin of Mohr ‘s circle always lies on the σ-axis.

    Mohr’s Circle Equations

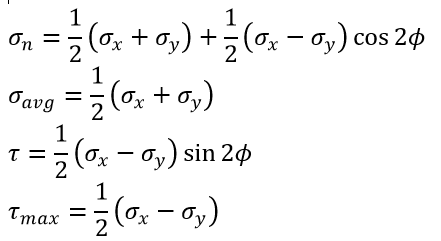
    Following are the standard equations formed of Mohr circle.

    E8

    Where,

    E9

    How to Use Mohr’s Circle

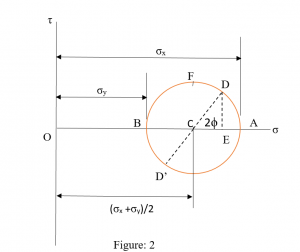
    Mohr’s circle is the circle drawn in the plane of σ-τ. σ is on the x-axis, which is the total of the normal force acting on the material. τ is on the y-axis, which is the total shear stress acting on the same plane, hence if we take any point on the Mohr’s circle, its x-coordinate gives the value of total normal stress acting on the material, and y-coordinate gives the value of total shear stress acting on the material.

    For figure 2, let’s take a point D on it. The x-coordinate gives the value of total normal stress acting on it, and the y-coordinate gives the value of total shear stress acting on it.

    From the geometry, it can be seen that the coordinates of point D are

    E10

    Where OE is an x-coordinate, and DE is a y-coordinate.

    For each condition of the material in figure 1 defined by ϕ, there is a corresponding point denoting it on the Mohr’s circle in figure 2.

    Let’s say, when ϕ = 0, and normal n coincides the x-axis, and it gives σn = σx

    And τ = 0.

    When ϕ = 900, the normal n coincides with the x-axis, and it gives σn = σy

    And τ = 0.

    When ϕ = 450, the normal n coincides with the x-axis, and it gives

    E11

    And

    E12

    The Mohr’s failure envelope

    Failure is the particular value of normal stress or shear stress at which material breaks or develops a crack.

    Mohr ’s circle can be used to know the normal and shear stress values at the point of failure.

    A material has multiple failure values of shear stresses and normal stresses. Thus, the Mohr Failure Envelope is a locus of all failure such failure points.

    For more Details Click Here

    Mohr’s Circle Pressure Vessel

    The stress experienced by any pressure vessel is the biaxial type of stress. It gives the impression due to pressure experienced by the wall of the pressure vessel can also have stresses generated by the weight of the under pressure fluid inside, its weight, and externally applied load and by an functional torque.

    Mohr’s circle is used to denote the stresses developed in the vessel.

    Questions and Answers

    What is Mohr’s circle used for?

    In real life, we may come across many cases in which material is subjected to tension or compression in two perpendicular direction at the identical time. The stress applied in such a case is known as biaxial stress. A balloon is a perfect example of it.

    These tensile/compressive stresses also produce shear stress in the material. To calculate the net tensile and shear stress produced in the material, a graphical method is used known as Mohr ‘s Circle for biaxial stress.

    What are the principal stresses?

    Principal stresses are maximum and minimum stresses at a point on the material. These stresses include only normal stresses and do not include shear stresses.

    What are the three principal stresses?

    There are mainly three principal stresses as follows:

    1) σ1= maximum (most tensile) principal stress

    2) σ3= minimum (most compressive) principal stress,

    3) σ2= intermediate principal stress.

    What is Mohr’s circle of stress?

    In real life, we may see numerous cases in which material is subjected to tension or compression in two perpendicular direction at that time. The stress applied in such a case is known as biaxial stress. A balloon is a perfect example of it.

    These tensile/compressive stresses also produce shear stress in the material. To calculate the net tensile and shear stress produced in the material, a graphical method is used known as Mohr ‘s Circle for biaxial stress.

    What is the radius of Mohr’s circle?

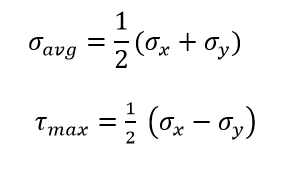
    The radius of Mohr’s Circle formed is as follows:

    τ_max=1/2(σ_x-σ_y)

    To learn more on mechanical engineering articles click here

    Characteristics of Function Graphs: 5 Important Facts

    Image5 300x273 1

    Characteristics of Function Graphs

    Characteristics of Function Graphs, this article will discuss the concept of graphical presentation of functions in addition to the value of a variable present in a function. So that the readers can easily understand the methodology.

    Which graph represents the functions f(X) = |x-2| – 1 ?

    One look at the right hand side expression makes us wonder, what are those two bars around -2 ? Well those bars are the notation for a very special function in mathematics, known as the modulus function or the absolute value function. This function is so important in function theory that it is worth a few words on its origin.

    Let us say we are to decide the time required to go from one city to another. In this case, won’t we only be interested in the distance between the two cities? Will the direction be of any importance? Similarly, in the study of calculus, we are often required to analyze the closeness of two numbers, which is the absolute value of their difference. We don’t care if the difference is positive or negative. German mathematician Karl Weierstrass was the one who realized the necessity of a function which would express the absolute value of a number. In the year 1841, Weierstrass defined the Modulus function and used the two bars as its symbol. 

    f(x) = x    for all x>0

    =-x for all x<0

    = 0   for x=0

    Abbreviated as f(x) = |x|

    From the definition, it is clear that this function does not have any effect on a positive number. It however changes a negative number to a positive number having the same absolute value. Hence

    |5| = 5

     7-2 = 5

    |-5| = 5

    |2-7| = 5

    To draw the graph of |x|, we should start with the graph of f(x) = x which simply is a straight line through the origin, inclined at 45 degrees to the positive side of the X axis

    Image1
    Characteristics of Function Graphs: Function Theory : f(x) = x

    It can be said that the upper half of this graph will be retained by f(x) = |x| as this function doesn’t change positive numbers. The lower half of the graph, however, has to change side, because |x| must always be positive. So, all the points on the lower half of f(x)=x will now be replaced on the upper half, keeping the same distance from the X axis. In other words, the entire LEFT HALF OF f(x) = |x| IS ACTUALLY THE REFLECTION OF THE LOWER HALF OF f(x) = x about the X axis.

    Characteristics of Function Graphs
    Characteristics of Function Graphs: Function theory: |x| and x graphs

    In the above figure, the right half shows the graphs of |x| and x superimposed, while the left half shows one as the reflection of another. It is essential to note that this technique may be stretched to any function. In other words, it is easy to imagine the graph of |f(x)| if we already know the graph of f(x). Replacing the lower half with its reflection about the X axis is the key.

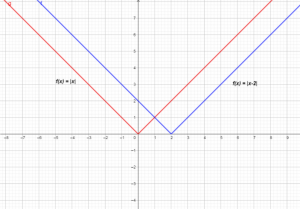
    Now we know how to plot |x|. But our original problem demands the plot of |x-2|. Well, this is nothing but a shift of origin from (0,0) to (2,0) as it simply decreases the X reading of all points by 2 units, thus transforming f(x) into f(x-2).

    Image3
    Characteristics of Function Graphs:  Function Theory: |x| and |x-2|

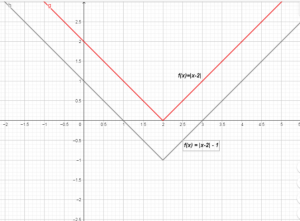
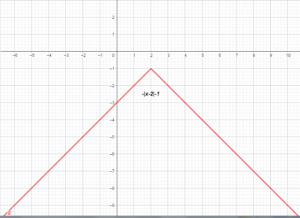
    Now the -1 is the only remaining thing to be taken care of. It means subtracting 1 from all points on |x-2|. In other words, it means pulling the graph vertically down by 1 unit. So, the new vertex would be (2,-1) instead of (2,0)

    Image4
    Characteristics of Function Graphs: Function Theory: |x-2| – 1

    Which graph represents the functions f(X)= -|x-2| – 1 ?

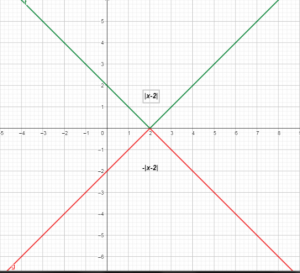
    Well, that should be quite easy after the analysis we just did. The only  difference here is a minus sign before |x-2|. The minus sign simply inverts the graph of |x-2| with respect to the X axis. So, we can restart the previous problem just after the point where we had graph of |x-2|. But, this time before considering the -1, we shall invert the graph.

    Image5
    Characteristics of Function Graphs: Graph of |x-2| and -|x-2|

    After this, we shall drag it down by one unit to incorporate the -1. And it is done.

    Image6
    Characteristics of Function Graphs

    The graph of a function must be linear if it has what characteristic?

    What is a straight line? Normally it is defined as the minimum distance between two points on a plane surface. But it can also be defined from another angle. Since the X-Y plane is a collection of points, we can consider any line on this plane to be the locus or trace of a moving point, or a point whose X,Y co-ordinates are changing.

    Moving along a straight line implies that the movement is happening without a change in direction. In other words, if a point starts moving from a given point and moves only in one given direction, then it is said to be following a straight line. So, if we are to express the linear graph as a function, then we must find an equation for the constant direction condition.

    But how to express direction mathematically? Well, as we already have two axes of reference in the X-Y plane, a direction of a line may be expressed by the angle it makes with any of the two axes. So, let us assume that a straight line is inclined at an angle α. But that would mean a family of parallel lines and not just a single one. So, α cannot be the only parameter to a line.

    Image7
    Characteristics of Function Graphs: Family of lines with 45 degree slope

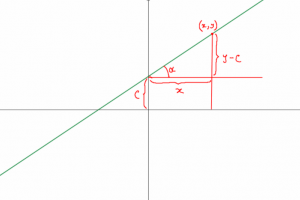
    Note that the lines differ only in their Y intercept. The Y intercept is the distance from the origin of the point where the line meets the Y axis. Let us call this parameter, C. So, we have two parameters, α and C. Now, let us try to derive the equation of the line.

    Image8
    Characteristics of Function Graphs: Intercept form of straight lines

    From the figure it should be clear from the right triangle, that for any point (x,y) on the line the governing condition has to  be                      

    (y-c)/x = tanα.

    ⟹ y = xtanα + c

    ⟹y = mx + c  where m=tanα

    Hence, any equation of the form y=ax+b must represent a straight line. In other words f(x) = ax + b is the desired form of a function in order to be linear.

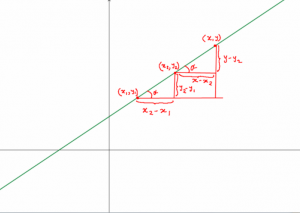
    The same can be derived also from the conventional definition of a straight line which states that a line is the shortest path between two points on a plane surface. So, let (x1,y1) and (x2,y2) be two points on a straight line.

    Image9
    Characteristics of Function Graphs: Two points form of straight lines

    For any other point on the line, a condition can be derived by equating the slopes of the two line segments formed by the three points as the line must maintain it s slope at all segments. Hence the equation                                 

                                                                       (y-y1)/(x-x1)= (y2-y1)/(x2-x1)

                                                                ⟹y(x2-x1) + x(y1-y2) + (x1y2-y1x2) = 0

    This equation is of the form Ax + By + C = 0 which may be written in the form, y=ax+b, which we know as the form of a linear function.

    Which graph is used to show change in a provided variable when a second variable is changed?

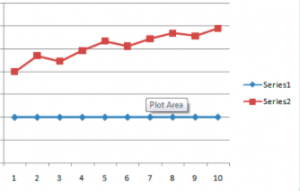
    To draw an ideal graph of a function, we would need either a definite algebraic expression or infinite number of data points. In real life, both are not available most of the times. The data we have is scattered. In other words, we may have a list of (x,y) points which may be plotted on the graph, but the points may not be very densely located. But we have to connect those points anyways, as there is no other way to look at the pattern or the trend of the variables. A graph thus obtained is known as a line graph.

    It is so named because neighboring points are joined with straight lines. This graph is best suited for illustrating a connection between two variables where one is depending on the other and are both changing. Time-series graphs are examples of line-graph where the X axis represents time in units of hours/days/months/years and the Y axis represents the variable whose value changes over time.

    Sales2010201120122013201420152016201720182019
    Year4000470044504920534051205450568055605900
    Characteristics of Function Graphs
    Image10
    Characteristics of Function Graphs: Example of a line graph

    Periodic function

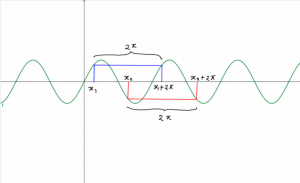
    When the dependant variable repeats its value at a definite period or interval of the independent variable, the function is called periodic. The interval is called the period or fundamental period, sometimes as basic period or prime period also. The criteria for a function to be periodic is for some real constant T, f(x+T) = f(x). Which means f(x) is repeating its value after every T units of x. We may note the value of the function at any point, and we will find the same value at T units right and left to that point. That is the characteristic of a periodic function.

    Image11
    Characteristics of Function Graphs :    Sin(x) has a period of 2

    The above figure depicts the periodic behavior of Sinx. We take two random values of x, as x1 and x2 and draw lines parallel to the x axis from sin(x1) and sin(x2). We note that both the lines meet the graph again at a distance of exactly 2π. Hence the period of Sinx is 2π. So we can write sin(x+2 π) = sinx for any x. The other trigonometric functions are also periodic. Cosine has the same period as Sin and so do Cosec and Sec. Tan has a period π and so does Cot.

    Which term gives the number of cycles of a periodic function that happen in one horizontal unit?

    One full period is called a cycle. So, there is exactly one cycle in T units of x. Hence there are 1/T cycles in one unit of x. The number 1/T is of particular significance in the study of periodic functions since it tells how frequently the function is repeating its values. Hence the term ‘frequency’ is assigned to the number 1/T. Frequency is denoted by  ‘f’, which is not to be confused with the ‘f’ of function The higher the frequency the more number of cycles are there per unit. Frequency and period are inversely proportional to each other, related as f = 1/T or T = 1/f. For Sin(X), the period is 2π, so frequency would be 1/2π.

    Examples:

    1. Calculate the period and frequency of Sin(3x)

    As Sin(x) has one cycle in 2π, Sin(3x) will have 3 cycles in 2π as x progresses 3 times faster in Sin(3x). So frequency would be 3 times that of Sin(x) , that is 3/2π. That makes the period 1/(3/2π) = 2π/3

    1. Calculate the period of Sin2x+sin3x

    Note that any integer multiple of the fundamental period is also a period. In this problem, there are two components of the function. First has a period of π and the second one 2π/3. But these two are different, so neither can be the period of the composite function. But whatever is the period of the composition, it has to be a period of the components also. So, it has to be a common integer multiple to both of them. But there could be infinitely many of those. Hence the fundamental period would be the least common multiple of the periods of the components. In this problem that is Lcm(π,2π/3) = 2π 

    Image12
    Characteristics of Function Graphs: Period of a composite function

    1. Calculate the period of (Sin2x + Sin5x)/(Sin3x + Sin4x)

    It is trivial but quite interesting to observe that the rule that we invented in the previous problem, does actually apply for any composition of periodic functions. So, in this case also the effective period would be the LCM of the periods of the components. That is LCM(π,2π/5,2π/3, π/2) = 2π

    1. Calculate the period of Sinx + sin πx

    At first, it seems obvious that the period should be LCM(2π,2), but then we realize that such a number does not exist as 2π is irrational so are its multiples and 2 is rational and so are its multiples. So, there could be no common integer multiple to these two numbers. Hence, this function is not periodic.

    The fractional part function {x} is periodic.

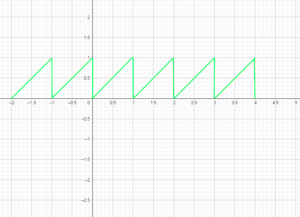
    f(x)={x}

    This is known as the fractional part function. It leaves the greatest integer portion of a real number and leaves out only the fractional part. So, its value is always between 0 and 1 but never equal to 1. That graph should make it clear that it has a period 1.

    Image13
    Characteristics of Function Graphs :  The fractional part function {x}


    CONCLUSION

    So far we discussed the Characteristics of Function Graphs. We should be now clear on the Characteristics and different types of graphs. We also had a idea of graphical interpretation of functions. Next article will be covering a lot more detail on concepts such as range and domain, inverse functions, various functions and their graphs,  and a lot of worked out problems. To go deeper into the study, you are encouraged to read below

    Calculus by Michael Spivak.

    Algebra by Michael Artin.

    For more mathematics article, please click here.

    Function Theory: 9 Complete Quick Facts

    INTRODUCTION

    What is mathematics? Is it calculation? Is it logic? Is it symbols? Pictures? Graphs? Turns out, it is all of these and so much more. IT IS BUT A LANGUAGE.  The universal language, having its symbols, characters, expressions, vocabulary, grammar, everything that makes a language, all perfectly reasoned, unique and unambiguous in their meaning. It is the language in which the laws of the universe are written. Hence it is the language we must learn and explore to unravel the mysteries of nature. We must begin our discussion on one of the most beautiful and fundamental mathematics topics, FUNCTION THEORY, with this philosophy.

    WHAT ARE EXPRESSIONS, EQUATIONS AND, IDENTITIES?

    Like all well-defined languages, mathematics comes with its own set of symbols and characters, numeric and alphabetical. An expression in mathematics is a combination of such symbols and characters. These all will be explain in this function theory discussion.

    5+2/(9-3)

    7a+2b-3c

    2 cos 1/2 (α + β) cos 1/2 (α – β)

    These are all mathematical expressions. No matter if they could be evaluated or not, if they are meaningful and if they follow proper syntax, they are expressions.

    Now, when we compare two expressions with an ‘=’ sign, we have something like …

    (1+x)2 = 1+2x+x2

    Which is an expression for equality of two expressions written on either side of an = sign. Note, that this equality is true for all values of x. These sorts of equalities are called IDENTITIES.

    (1+x)2 = 2+3x+2x2…………..(1)

    Or like

    (1+x)2 = 7-3x+2x2…………(2)

    Then they won’t be true for all values of x, rather they would be true for some values of x like (2) or they would be true for NO values of x, like (1). These are called EQUATIONS.

    So to summarize, equalities that have for all values of the variables, are IDENTITIES. And equalities that hold for some or no values of the variables are EQUATIONS.

    WHY DO WE NEED THE CONCEPT OF FUNCTION?

    Is it not amazing that the universe is so perfectly balanced? A system of such enormous size made of so many smaller systems, each having so many variables interacting with each other, yet so well behaved. Does it not seem that everything is governed by a set of rules, unseen but existing everywhere? Take the example of the gravitational force. It is inversely proportional to the distance between bodies, and this rule is followed by all matters, everywhere in the universe. So, we must have a way to express such rules, such as connections between variables.

    We are surrounded by such variables which depend on other variables. The length of the shadow of a building depends on its height and the time of the day. The distance travelled by car depends on the torque generated by its engine. It is the concept of function theory that enables us to express such relations mathematically.

    SO WHAT IS A FUNCTION IN MATH?

    Function Rule or FUNCTION as a rule

    To put it simply, a function is a rule that binds two or more variables. If the variables are allowed to take only real values then it is simply an expression that defines a rule or a set of rules that assigns a real number to each of certain real numbers.

    Now this definition surely requires some clarification which are given through the examples such as

    1. The rule that assigns the cube of that number to each number.

    f(x) = x3

    2. The rule that assigns (x2-x-1)/x3 to each x

    f(x) = (x2-x-1)/x3

    3. The rule that assigns (x2x-1)/(x2+x+1)  to all x which are not equal to 1 and the number 0 to 1

    f(x) = (x2-x-1)/(x2+x+1) for x ≠ 1

                                                     = 0            for x=1

    • f(x) = x2   for -1 < x < π/3
    • The rule that assigns

      2 to number 5

      3 to number 8/3

      π/2 to number 1

      and  to the rest

    • The rule that assigns to a number x, the number of 1s in its decimal expansion if the count is finite and 0 if there are infinitely many 1s in the expansion.

    These examples should make one thing very clear that a function is any rule that assigns numbers to specific other numbers. These rules may not always be expressible by algebraic formulation. These may not even point to one unique condition that applies to all numbers. And it doesn’t have to be a rule that one can find in practice or in the real world, like the one in rule 6. No one can tell which number this rule assigns to the number π or √2. The rule also may not apply to some numbers. For example, rule 2 does not apply to x=0. The set of numbers to which the rule applies is called the DOMAIN of the function.

    SO WHAT DOES y= f(x) MEAN?

    Note, that we are using the expression y=f(x) to write a function. Whenever we start an expression with ‘f(x) = y’ then we mean that we are about to define a function that relates a set of numbers with a set of values of the variable x.

    FUNCTION as a relation

    So, in other words, and perhaps in a more general sense, a function is a relation between two sets A and B, where all the elements in the set A have an element assigned to them from the set B. The elements from set B are called the IMAGES and the elements of set A are called the PRE-IMAGES.

    The process of relating the elements is called MAPPING. Of course there could be many ways in which these mappings can be done, but we would not call all of them as functions. Only those mappings that relate the elements in such a way that every element in set A has exactly one image in set B, are to be called functions. It is sometimes written as f : A–> B . This is to be read as ‘f is a function from A to B’.

    The set A is called the DOMAIN of the function and the set B is called the CO-DOMAIN of the function. If f is such that the image of one element a of set A is the element b from set B, then we write f(a) = b, read as ‘f of a is equal to b’, or  ‘b is the value of f at a’, or ‘b is the image of a under f’.

    TYPES OF FUNCTIONS

    Functions may be classified as per the way they relate the two sets.

    One – one or injective function

    Image1 Types of Functions
    function theory: One to One or injective function

    The figure says it all. It is when a function relates every element of a set to a unique element of another set, it is a one to one or injective function.

    Many – one function

    function theory
    function theory: Many to One function

    Again, the figure is quite self-explanatory. Evidently there are more than one pre-image to a particular image. Hence the mapping is many to one. Note, that it does not violate the definition of a function as no element from set A has more than one image in set B.

    ONTO function or SURJECTIVE function

    Image3 Onto functions 1
    Function Theory: ONTO function or SURJECTIVE function

    When all the elements of set B has at least one pre-image, then the function is called Onto or surjective. Onto mapping can be one to one or many to one. The one depicted above is evidently many to one onto mapping. Note that the picture used previously for depicting one to one mapping is also onto mapping. This sort of one to one onto mapping is also known as BIJECTIVE mapping.

    Into function

    Image4 onto function2
    Function Theory: INTO Function

    When there is at least one image without any pre-image, it is an INTO function. Into function can be one to one or many to one. The one depicted above is obviously one to one into.

    GRAPH OF A FUNCTION

    As it is said earlier that a function assigns real numbers to certain real numbers, it is quite possible and convenient to plot the pair of numbers on X-Y Cartesian plane. The trace obtained by connecting the points, is the graph of the function.

    Let us consider a function f(x) = x + 3. Then, we could evaluate f(x) at x=1,2,3 to obtain three pairs of x and f(x) as (1,4) , (3,6) and (5,8). Plotting these points and connecting them shows that the function traces a straight line in the x-y plane. This line is the graph of the function.

    Image5 graph of a function1
    Function Theory: Graph of a function_1

    Evidently, the nature of the trace will vary according to the expression for the function. Thus we get a range of graphs for different kind of expressions. A few are given.

    The graphs of f(x) = sin x, f(x) = x2 and f(x) = ex from left to right

    Image6 graphof function2
    Function Theory: Graph of a function_2

    At this point, one can see that the expression for a function actually looks like that of an equation. And it is true, for example y = x + 3 is indeed an equation as well as a function definition. This brings us the question, are all equation functions? If not then

    How to tell if an equation is a function?

    All the equations depicted in the graphs earlier are actually functions, as for all of those, there is exactly one value of f(x) or y for some value of x. This means that the expression for f(x) should yield only one value when evaluated for any value of x. This is true for any linear equation. But if we consider the equation y2 = 1-x2, we find that there are always two solutions for all x within 0 to 1, in other words, two images are assigned to each value of x within its range. This violates the definition of a function and hence cannot be called a function.

    This should look clearer from the graph that there are exactly two images of each x as a vertical line drawn at any point on the x axis will cut the graph at exactly two points.

    Image7 graph of function3
    Function Theory: Graph of a function_3

    So, this brings us to one important conclusion that not all equations are functions. And whether an equation is a function, can be verified by the vertical line test, which is simply imagining a variable vertical line at each point on x axis and seeing if it meets the graph at a single point.

    This also answers another important question, which is, how to tell if a function is one to one? Surely enough, that answer is also in the graph and can be verified by the vertical line test.

    Now, one could ask if there is a way to tell the same without obtaining the graph or if it could be told algebraically as it is not always easy to draw graphs of functions. Well the answer is yes, it can be done simply by testing f(a)=f(b) implies a=b. This is to say that even if f(x) takes the same value for two values of x, then the two values of x cannot be different. Let us take an example of the function

    y=(x-1)/(x-2)

    As one would notice that it is difficult to plot the graph of this function as it is non-linear in nature and does not fit the description of any familiar curve and moreover is not defined at x=2 . So, this problem definitely calls for a different approach from the vertical line test.

    So, we begin by letting 

    f(a)=f(b)

    => (a-1)/(a-2)=(b-1)/(b-2)

    =>(a-1)(b-2)=(b-1)(a-2)

    =>ab-2a-b+2=ab-2b-a+2

    => 2a+b=2b+a

    =>2(a-b)=(a-b)             

    This is only possible for a-b=0 or a=b

    So, the function is indeed one to one, and we have proved it without graphing.

    Now, we would want to see when some function fails this test. We might want to test equation of the circle we tested before. We start by writing

    f(a)=f(b)

    f(x) = x2

    => a2=b2

    a2 =b2

    => a=b or a=-b

    Which simply means that there are solutions other than a=b, hence f(x) is not a function.

    IS IT SO DIFFICULT TO PLOT y=(x-1)/(x-2) ?

    We are going to discuss graphing of a function in much greater detail in the upcoming articles but here it is necessary to get familiar with the basics of graphing as it helps immensely with problem solving. A visual interpretation of a calculus problem often makes the problem very easy and knowing how to graph a function is the key to a good visual interpretation.

    So, to plot the graph of (x-1)/(x-2), we begin by making a few critical observations such as

    1. The function becomes 0 at x=1.

    2. The function becomes undefined at x=2 .

    3. The function is positive everywhere except for 1<x<2.

    Because in this interval (x-1) is positive and (x-2) is negative, this makes their ratio negative.

    4. As x goes to -∞ the function nears unity from the lower side, meaning that it goes close to 1 but is always less than 1.

    Because for x<0, (x-1)/(x-2) =(|x|+1)/(|x|+2)<1 as |x|+2>|x|+1

    5. As x goes to +∞ the function nears unity from the upper side, meaning that it goes close to 1 but is always greater than 1.

    6. As x goes to 2 from the left side, the function goes to -∞.

    7. As x goes to 2 from the right side, the function goes to +∞.

    8. The function is always decreasing for x>2.

    PROOF:

    We take two close values of x as (a, b) such that (a, b) >2 and b>a

    now, f(b) – f(a)

    =(b-1)/(b-2)-(a-1)/(a-2)

    ={(b-1)(a-2)-(a-1)(b-2)}/(a-2)(b-2)

    =(a-b)/{(a-2)(b-2)}

    <0 as (a-b)<0 for b>a

    and (a-2)(b-2)> 0 as (a, b)> 2

    This implies f(b)<f(a) for all a>2, in other words f(x) is strictly decreasing for x>2

    • 9. The function is always decreasing for x<2
    • PROOF: same as before. We leave it for you to try.

    Combining these observations makes the graphing quite easy. Combining 4,9 and 6 we can say that as x goes from -∞ to 2, the trace starts from unity and falls gradually to touch 0 at x=1 and falls further to -∞ at x=2. Again combining 7,5 and 8 it is easy to see that as x goes from 2 to +∞, the trace starts falling from +∞ and keeps getting close to unity never really touching it.

    This makes the complete graph look like

    Image8 graph of Function4 1
    Function Theory: Graph of a function_4

    Now it becomes evident that the function is indeed one to one.

    CONCLUSION

    So far we discussed the basics of function theory. We should be now clear on the definitions and types of functions. We also had a little idea of graphical interpretation of functions. Next article will be covering a lot more detail on concepts such as range and domain, inverse functions, various functions and their graphs,  and a lot of worked out problems. To go deeper into the study, you are encouraged to read

    Calculus by Michael Spivak.

    Algebra by Michael Artin.

    For more mathematics article, please click here.

    Thermodynamics Notes: 13 Facts You Should Know

    Thermodynamics Notes

    Thermodynamics: The branch of physics and science that deals with the correlation between heat and other forms of energy that can be transferred from one form and place to another can be defined as thermodynamics. Certain terms to know about when examining thermodynamics can be better understood by following term.

    Heat

    Heat is a form of energy, the transfer of energy from one body to other happens due to temperature difference and heat-energy flows from a hot body to a cold body, to make it thermal equilibrium and plays a very critical role in the principle of thermodynamics.

    Work

    An external force applied in the direction of displacement which enables the object to move a particular distance undergoes a certain energy transfer which can be defined as work in the books of physics or science. In mathematical terms, work can be described as the force applied multiplied by the distance covered. If the displacement is involved at an angle Θ when force is exerted, then the equation can be:

    W = fs

    W = fscosӨ

    Where,

     f= force applied

    s= distance covered

    Ө= displacement angle

    Thermodynamics is a very vital aspect of our daily life. They follow a set of laws to abide by when applied in terms of physics.

    Laws of thermodynamics

    The Universe, though it is defined by many laws, only very few are mighty. The laws of thermodynamics as a discipline were formulated and opened ways to numerous other phenomena varying from refrigerators, to chemistry and way beyond life processes.

    The four basic laws of thermodynamics consider empirical facts and construe physical quantities, like temperature, heat, thermodynamic work, and entropy, that defines thermodynamic operations and systems in thermodynamic equilibrium. They explain the links between these quantities. Besides their application in thermodynamics, the laws have integrative applications in other branches of science. In thermodynamics, a ‘System’ can be a metal block or a container with water, or even our human body, and everything else is called ‘Surroundings’.

    The zeroth law of thermodynamics obeys the transitive property of basic mathematics that if a two systems are in thermal equilibrium with a 3rd system, then these are in thermal equilibrium state with each other too.

    The basic concepts that need to be covered to comprehend the laws of thermodynamics are system and surroundings.

    System and Surroundings

    The collection of a particular set of items we define or include (something as small as an atom to something as big as the solar system) can be called a system whereas everything that does not fall under the system can be considered as the surroundings and these two concepts are separated by a boundary.

    For example, coffee in a flask is considered as a system and surroundings with a boundary.

    Essentially, a system consists of three types namely, opened, closed, and isolated.

    thermodynamics note
    Figure: System and Surroundings in thermodynamics

    Thermodynamics equations

    The equations formed in thermodynamics are a mathematical representation of the thermodynamic principle subjected to mechanical work in the form of equational expressions.

    The various equations that are formed in the thermodynamic laws and functions are as follows:

    ●      ΔU = q + w (first law of TD)

    ●      ΔU = Uf – Ui (internal energy)

    ●      q   =   m Cs ΔT (heat/g)
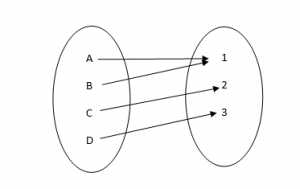
    ●      w   =   -PextΔV (work)
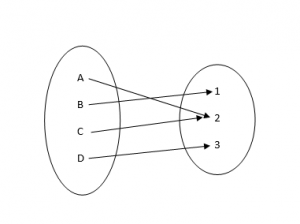
    ●      H = U + PV

    ΔH = ΔU + PΔV

    ΔU = ΔH – PΔV

    ΔU = ΔH – ΔnRT ( enthalpy to internal energy)

    ●      S  =  k ln Ω (second law in Boltzman formula)

    ●      ΔSrxn° = ΣnS° (products) – ΣnS° (reactants) (third law)

    ●      ΔG = ΔH – TΔS (free energy)

    First law of thermodynamics

    The 1st law of thermodynamics elaborate that when energy (as work, heat, or matter) carries in or out of a system, the system’s internal energy will change according to the law of conservation of energy (which means that energy can neither be created nor destroyed and can only be transferred or converted from one form to another), i.e., perpetual motion machine of the 1st kind ( a machine which actually works without energy i/p) are un-attainable.

    For example, lighting a bulb is a law of electrical energy being converted light energy which actually illuminates and some part will be lost as heat energy.

     ΔU= q + w

    • ΔU  is the total internal energy change of a system.
    • q  is the heat transfer between a system and its surroundings.
    • w  is the work done by the system.
    Picture2
    Thermodynamics notes : First law of Thermodynamics

    Second law of thermodynamics

    The second law of thermodynamics defines an important property of a system called entropy. The entropy of the universe is always increasing and mathematically represented as ΔSuniv > 0 where ΔSuniv is the change in the entropy of the universe.

    Entropy

    Entropy is the measurement of the system’s randomness or it is the measure of energy or chaos with in an isolate system, this can be contemplated as a quantitative index that described the classification of energy.

    The second law also gives the upper limit of efficiency of systems and the direction of the process. It is a basic concept that heat does not flow from an object of lesser temperature to an object of greater temperature. For that to happen, and external work input is to be supplied to the system. This is an explanation for one of the fundamentals of the second law of thermodynamics called “Clausius statement of second law “. It states that “It is impossible to transfer heat in a cyclic process from low temperature to high temperature without work from an external source”.

    2nd law 1
    Figure: Second law of thermodynamics Image source : NASA

     A real-life example of this statement is refrigerators and heat pumps. It is also known that a machine that can’t convert all of the energy supplied to a system cannot be converted to work with an efficiency of 100 percent. This then guides us to the following statement called the “Kelvin-Planck statement of second law”. The statement is as follows “It is impossible to construct a device (engine) operating in a cycle that will produce no effect other than extraction of heat from a single reservoir and convert all of it into work”.

    Mathematically, the Kelvin-Planck statement can be written as: Wcycle ≤ 0 (for a single reservoir) A machine that can produce work continuously by taking heat from a single heat reservoir and converting all of it into work is called a perpetual motion machine of the second kind. This machine directly violates the Kelvin-Planck statement. So, to put it in simple terms, for a system to produce to work in a cycle it has to interact with two thermal reservoirs at different temperatures.

    Thus, in layman’s term the 2nd law of thermodynamics elaborates, when energy conversion happens from one to other state, entropy will not decreases but always increases regardless within a closed-system.

    Third law of thermodynamics

    In layman’s terms, the third law states that the entropy of an object approaches zero as the absolute temperature approaches zero (0K). This law assists to find an absolute credential point to obtain the entropy. The 3rd law of thermodynamics has 2 significant characteristics as follows.

    The sign of the entropy of any particular substance at any temperature above 0K is recognized as positive sign, and it gives a fixed reference-point to identify the absolute-entropy of any specific substance at any temp.

    Picture1
    Figure: TS diagram Image source: Wikipedia commons

    Different measures of energy

    ENERGY

    Energy is defined as the capacity to do work. It is a scalar quantity. It is measured in KJ in SI units and Kcal in MKS units. Energy can have many forms.

    FORMS OF ENERGY:

     Energy can exist in numerous forms such as

    • 1. Internal energy
    • 2. Thermal energy
    • 3. Electrical energy
    • 4. Mechanical energy
    • 5. Kinetic energy
    • 6. Potential energy
    • 7. Wind energy and
    • 8. Nuclear energy

    This further categorized in

    (a) Stored energy and (b) Transit energy.

    Stored Energy

    The stored form of energy can be either of the following two types.

    • Macroscopic forms of energy: Potential energy and kinetic energy.
    • Microscopic forms of energy: Internal energy.

    Transit Energy

    Transit energy means energy in transition, basically represented by the energy possessed by a system that is capable of crossing the boundaries

    Heat:

     It is a transfer form of energy that flows between two systems under the temperature difference between them.

    (a) Calorie (cal) It is the heat needed to raise the temperature of 1 g of H2O by 1 deg C

    (b) British thermal unit (BTU) It is the heat needed to raise the temperature of 1 lb of H2O by 1 deg F

    Work:

    An energy interaction between a system and its surroundings during a process can be regarded as work transfer.

    Enthalpy:

    Enthalpy (H) defined as the summation of the system’s internal energies and the product of it’s pressure and volume and enthalpy is a state function used in the field of, physical, mechanical, and chemical systems at a constant pressure, represented in Joules (J) in SI units.

    Relationship between the units of measurement of energy (with respect to Joules, J)

    UnitEquivalent to
    1eV1.1602 x 10-19 J
    1 cal4.184 J
    1 BTU1.055 kJ
    1 W1 J/sec

    Table: Relation table 

    Maxwell’s Relations

    The four most traditional Maxwell relations are the equalities of the second derivatives of every one of the four thermodynamic perspectives, concerning their mechanical variables such as Pressure (P) and Volume (V) plus their thermal variables such as Temperature (T) and Entropy (S).

    lN3F6ycg qCMH2raNFdQs NNj chwCPKYnquRMUnVAI5hPc9NkCiQ7yz mfLNADWrE

    Equation: common Maxwell’s Relations

    Conclusion

    This article on Thermodynamics gives you a glimpse of the fundamental laws, definitions, equations relations, and its few applications, although the content is short, it can be used to quantify many unknowns. Thermodynamics finds its use in various fields as some quantities are easier to measure than others, though this topic is profound by itself, thermodynamics is fundamental, and its fascinating phenomena gives us a deep understanding of the role of energy in this universe

    Some questions related to the field of Thermodynamics

    What are the applications of thermodynamics in engineering?

    There are several applications of thermodynamics in our daily lives as well as in the domain of engineering. The laws of thermodynamics are intrinsically used in the automobile and the aeronautical sector of engineering such as in IC engines and gas turbines in the respective departments. It is also applied in heat engines, heat pumps, refrigerators, power plants, air conditioning, and more following the principles of thermodynamics.

    Why is thermodynamics important?

    There are various contributions of thermodynamics in our daily life as well as in the engineering sector. The processes that occur naturally in our daily life fall under the guidance of thermodynamic laws. The concepts of heat transfer and the thermal systems in the environment are explained by the thermodynamic fundamental which is why the subject is very important to us.

    How long does it take a bottle of water to freeze while at a temperature of 32˚F?

     In terms of a conceptual solution to the given question, the amount of time taken to freeze a bottle of water at a temperature of 32F will be depending upon the nucleation point of the water which can be defined as the point where the molecules in the liquid are gathered to turn into a crystal structure of solid where pure water will freeze at -39C.

    Other factors into consideration are the latent heat of fusion of water which is the amount of energy required to change its state, essentially liquid to solid or solid to liquid. The latent heat of water at 0C for fusion is 334 joules per gram.

    What is cut-off ratio and how does it affect the thermal efficiency of a diesel engine?

    Cut off ratio is inversely proportional to the diesel cycle as there is an increase in efficiency of the cut-off ratio, there is a decrease or reduction in the efficiency of a diesel engine. The cut-off ratio is based on its equation where the correspondence of the cylinder volume before and after combustion is in proportion to each other.

    It goes as follows:

     
    Mj Ib6Mi8W4mf6Q6fJ8ghe0KVGXrgdTjXc6BkTr4nqx6mg 1BqNHIA UVHBQP jCYZ9LoCkxatHjmCa7Fa4Vk8mcDqD0wyMx2QcazAtmsG u WIpjaYZCOGPOj92cjITeSjaEqQ
     Equation 1: Cut-Off Ratio

    What is a steady-state in thermodynamics?

    The current state of a system that contains a flow through it over time and the variables of that particular process remains constant, then that state can be defined as a steady-state system in the subject of thermodynamics.

    What are the examples of fixed boundary and movable boundary in the case of thermodynamics?

    A moveable boundary or in other terms, control mass is a certain class of system where matter cannot move across the boundary of the system while the boundary itself acts as a flexible character that can expand or contract without allowing any mass to flow in or out of it. A simple example of a moveable boundary system in basic thermodynamics would be a piston in an IC engine where the boundary expands as the piston is displaced while the mass of the gas in the cylinder remains constant allowing work to be done.

    5ormIhuE6JPsN Og1pk2xsKt3x3WtRRbpVzne2HBNSTyDGjszLIgEXkLr3BhdWzARk1f2lTSwv XjZHGsH2A79In7X8qqL1csLigCTBzqv3inA NMtg91TiUb0KPO XYD6OUM2qI
    Figure: Piston movement

    Whereas in the case of a fixed boundary, there is no work being permitted as they keep volume constant while the mass is allowed to flow in and out freely in the system. It can also be called a control volume process. Example: gas flowing out of a household cylinder connected to a stove while the volume is fixed.

     What are the similarities and dissimilarities of heat and work in thermodynamics?

    Similarities:

    • ●  Both these energies are considered as path functions or process quantities.
    • ●  They are also inexact differentials.
    • ●  Both the form of energies are not stored and can be transferred in and out of the system following the transient phenomenon.

    Dissimilarities:

    • ●  Heat flow in a system is always associated with the entropy function whereas there is no entropy transfer along with the work system.
    • ●  Heat cannot be converted a hundred percent into work, while work can be converted into heat a 100%.
    • ●  Heat is considered as a low-grade energy meaning, it is easy to convert heat into other forms while work is high-grade energy.

    What is Shear Stress? | Its All Important Concepts

    ezgif 4 85c0bc9cff
    • When force transmits from one body to another, forces parallel to the surface are experienced by the body, such kind of forces produce shear stress.
    • It is vital to know about the shear stresses acting on the material while designing the product. Shear failure is the most common failure which occurs due to inappropriate consideration of shear forces.

    Shear Stress Definition

    • When the applied force is parallel/tangential to the surface area of application, then the stress produced is known as shear stress.
    • Here application of force is tangential to the surface of application.
    •  A component of the stress tensor in the direction parallel to the area of application.
    • Shear stress also occurs in axial loading, bending, etc.

    Shear Stress Formula

     Shear Stress= Force imposed parallel to the area/ Area of cross-section

    ezgif 4 85c0bc9cff

    What is Shear Stress Units ?

    Unit of shear stress is N/m2 or Pa.

    In industries, the unit used to measure shear stress is N/mm2 or MPa (Mega Pascal)

    Shear Stress Symbol | Shear Stress tau

    The symbol used to represent shear stress is τ (Tau). It is also represented by T.

    Shear Stress Diagram

    Shear Stress Diagram
    Shear Stress Diagram

    Shear Stress Notation

    • Symbol τ is used to represent shear stress.
    • To show the applied force and direction of the application area, subscripts are used with the symbol τ as τij.
    • Where i represent the direction of the surface plane on which it is being applied (perpendicular to the surface), and j represents the applied force’s direction.
    • Thus, τij= Shear stress acting on the i-surface in j-direction.

              τji= Shear stress acting on the j-surface in i-direction.

    • We can write it as:
    ezgif 4 237490c9d9

    Shear Stress Direction

    In 2 Dimensions:

    2 1
    Shear Stress Direction
    • In the vector form, shear stress is the ratio of a parallel component of force applied to the unit normal vector of area.

                      τ= F / A

    In 3 Dimensions:

    • In naming xy, which is in the subscript form (subscript convention), index x represents the direction of a vector perpendicular to the application area, and y represents the direction of applied force.
    • In the following figure, it is represented for all three axes.
    Shear Stress Directions
    Shear Stress Direction

    Any of the shear stress can be represented as follow:           

    ezgif 4 ba9ebff8fa

    Shear Stress Sign Convention

    When the shear stress is applied on a surface along the principal axis, the adjacent perpendicular axis experiences the equal amount of shear stress in the opposite direction known as complementary shear stress as shown in the figure:

    Complementary Shear Stress
    Complimentary Shear Stress
    • Shear stress is positive if the shear force applied along the x-axis is in the right direction or clockwise.

    Similarly, Shear stress is positive if the shear force applied along the y-axis is in an upward direction or it is counterclockwise.

    • Shear stress is negative if the shear force applied along the x-axis is in the left direction or in counterclockwise.

    Similarly, Shear stress is negative if the shear force applied along the y-axis is in a downward direction or it is clockwise.

    • Half arrowheads are used to represent shear stress.
    Shear Stress Sign Convention
    Shear Stress Sign Convention

    Shear Strain

    • When the shear stress is applied on a surface, deformation is produced in the material. So, the ratio of deformation to the original length perpendicular to the member’s axes is known as shear strain. It is denoted by γ.
    • It is also defined as the tangent of the strain angle ө.
    • Shear Strain= del l/ h = tangent(Ө)
    Shear Strain
    Shear Strain
    ezgif 4 ba9ebff8fa 1

    Shear Stress and Shear Strain

    • It is noted that shear strain is dependent on shear stress. The relation is expressed as
    ezgif 4 93f4cad4cc

    Modulus of Rigidity | Shear Stress Modulus | Shear Modulus of Rigidity

    • The proportionality constant G is known as Modulus of Rigidity or Shear Stress Modulus or Shear Modulus of Rigidity.
    • Thus,

         Modulus of Rigidity = Shear Stress/ Shear Strain

    ezgif 4 b4bd1d61f4
    • In most of the metals, G is about 0.4 times of Young’s Modulus of Elasticity.

    For isotropic materials, Modulus of Rigidity and Modulus of Elasticity is related to each other according to

          Y = 2*G* (1+ ʋ)

    Where, Y= Modulus of Elasticity

                 G= Modulus of Rigidity

                 ʋ= Poisson’s Ratio

    Shear Strength

    • Shear strength is the maximum value of shear stress that can resist failure due to shear stress.
    • It is a significant parameter while designing and manufacturing machines.
    • Example: While designing bolts and rivets, it is indispensable to know about the material’s shear strength.

    Shear Stress vs Normal Stress

     Shear StressNormal Stress
    1.Force applied is parallel to the surface on which it is being appliedForce applied is perpendicular to the surface on which it is being applied.
    2.Force vector and area vector are perpendicular to each otherForce vector and area vector are parallel to each other.

     Shear Stress from Torque | Shear Stress Due to Torsion

    • Torque is a rotational form of force which makes the object to rotate around an axis. When this torque is applied on a deformable body, it generates shear stress in that body, making that body twist around an axis, known as torsion.
    • This type of stress is significant in shafts. The stresses or deformations induced in the shaft due to this torsion are shear kinds of stresses.
    • The shear strain produced in the following shaft of radius r is represented as follows:

    γ= rdө/dz

    Shear Stress due to Torque
    Shear Stress due to Torque

    Thus, the shear stress produced is represented by

    ezgif 4 8bc39f719b

    Shear Stress Fluid

    • Shear stress produced in any material is due to relative movement of planes on each other.
    • When it comes to fluid, shear stress is produced in the fluids due to relative movement of fluid layers on one another. It is the viscosity which causes shear stress in the fluid.
    • Due to shear stress, fluid cannot be held in one place.
    • Thus, the shear stress produced in the fluid is equal to the  
    ezgif 4 8b515205cb

    Where μ= Dynamic Viscosity

                 u= Flow Velocity

                 y= Height above the boundary

    • This equation is also known as Newton’s Law of Viscosity.

    Read more about Shear Strain and All important facts

    Shear Rate

    • Shear rate is the rate at which one layer of fluid passes on another adjacent layer of fluid; this can find out by both using geometry and speed of the flow.
    • The viscosity of fluid mainly depends upon the shear rate of the fluid.
    • This parameter is very important while designing fluid products like syrups, sunscreen cream, body lotion, etc.

    Shear Stress vs Shear Rate

    • The shear rate is defined as the rate of change of velocity of layers of fluid on one another. For all Newtonian fluids, the viscosity remains constant when there is a change in shear rate, and the shear stress is directly proportional to the shear rate. 
    • Following is a graphical representation of shear stress vs shear for a different type of fluid:
    Shear Stress vs Shear Rate
    Shear Stress vs Shear Rate for Newtonian Fluids

    Shear Stress in Beams

    • If a cantilever beam of diameter d is twisted on its free end, if torsion of magnitude T is applied on its free end, then the shear stress produced in the beam.
    • This shear stress is represented as follows  
    ezgif 4 346eadbff4
    Shear Stress in Beams
    Shear Stress in Beams

    Shear Stress due to Bending

    • For an ideal case, shear stress does not produce due to bending, but in real condition, shear stress occurs in the bending conditions.
    • A varying bending moment along the length of the beam causes movement of one plane on another because shear stress gets produced in the beams.

    Read more about Shear modulus and Modulus of rigidity

    Shear Stress in Bolts

    • Bolts are mainly used to fix two different assembly bodies like joints, two different metal sheets, two different pipes of an assembly etc.
    • The bolt experiences shear load or shear force due to the presence of two different loadings acting in the different directions this causes one plane of the bolt to slip on another plane of the bolt.
    • ; This causes shear failure in joints like cotter joint, knuckle joint, etc. so, while selecting material for different mechanisms, it is essential to know its shear stress.
    • Double shear stress is calculated in bolts.
    Shear Stress in Bolts
    Shear Stress in Bolts

    Shear Stress Steel

    • Steel is one of the most applicable metals in all types of industries. From constructions to machines, steel is used everywhere. Therefore the maximum shear stress value of steel is a significant parameter while designing.
    • It is determined using the ultimate tensile strength of the steel. Von Misses factor is used to determine maximum shear stress. It states that maximum shear stress is 0.577 times of the ultimate tensile strength.
    • In many cases, it is considered as 0.5 times of ultimate tensile strength of the steel. 

    Read more about How to calculate shear strain

    Shear Stress Problems

    Subjective Questions

    What is Shear Stress?

      Ans.: When the applied force is parallel to the surface/area of application, then the stress produced is known as shear stress. Shear stress is a component of the stress tensor in the direction parallel to the area of application.

    What is complementary shear stress?

    Ans.: When the shear stress is applied on a surface along the principal axis the adjacent perpendicular axis experiences the equal amount of shear stress in the opposite direction known as complementary shear stress

    What are the sign conventions for shear stress? | How to decide sign of shear stress?

    Ans.: Shear stress is positive if the shear force applied along the x-axis is in the right direction or clockwise.

    Similarly, Shear stress is positive if the shear force applied along the y-axis is in an upward direction or it is counterclockwise.

    Shear stress is negative if the shear force applied along the x-axis is in the left direction or in counterclockwise.

    Similarly, Shear stress is negative if the shear force applied along the y-axis is in a downward direction or it is clockwise.

    What is the sign for shear stress?

    Symbol τ is used to represent shear stress. To specify the directions of applied force and direction of the application area, subscripts are used with the symbol τ as τij.

    What are examples of shear?

    When a piece of paper is cut with the scissor.

    A bolt and nut tightly fixed with plates.

    Rubbing palm on each other

    Any friction leads to the production of shear.

    What’s an example of shear stress?

    Painting walls using colour.

    Chewing food under the teeth.

    In cotter and knuckle joints, cotter and knuckle experiences shear stress.

    How do you solve shear stress?

    Shear Stress= Force imposed parallel to the area/ Area of cross Section

    ezgif 4 85c0bc9cff 1

    What causes shear stress?

    When force transmits from one body to another, forces parallel to the surface are experienced by the body, such kind of forces produce shear stress.

    What is the difference between shear stress and shear force?

    Shear force is the force applied parallel or tangential to the plane’s surface, whereas shear stress is the shear force experienced by the plane’s surface per unit area.

    What is the difference between shear stress and shear rate?

    When the applied force is parallel to the surface area of application, then the stress produced is known as shear stress whereas the shear rate is the rate at which one layer of fluid passes on another adjacent layer of fluid.   

    What is a positive shear force?

    Shear stress is positive if the shear force applied along the x-axis is in the right direction or clockwise. Similarly, Shear stress is positive if the shear force applied along the y-axis is in an upward direction or it is counterclockwise.

    Positive Shear Stress
    Positive and Negative Shear Stress

    What is average shear stress?

    Actual shear stress is never uniform; it is different for the different unit cross-sectional area. So, to calculate this shear stress, the considered shear stress is the average shear stress.

    Average shear stress is always lesser than maximum shear stress for the given area of cross-section.

    What is Shear Strain?

    When the shear stress is applied on a surface, deformation is produced in the material. So, the ratio of deformation to the original length perpendicular to the member’s axes is known as shear strain. It is denoted by γ.

    Shear Strain
    Shear Strain
    ezgif 4 a23b2427cb

    Is shear strain in radian?

    No. shear strain is the tangent value of del l and h, which is a unitless quantity.

    Objective Questions:

    A block of a material with a shear modulus of rigidity G = 90 KPa is bonded to two rigid horizontal plates. The lower plate is fixed, while the upper plate is subjected to a horizontal force P. knowing that the upper plate moves through 0.04 cm under the force’s action if the height of the block is 2cm, determine the average shearing strain in the material.

    1. 0.04 rad
    2. 0.02 rad
    3. 0.01 rad
    4. 0.08 rad

    Solution: Option 2. Is the answer.                

    ezgif 4 09055c5da6

    A block of a material with a shear modulus of rigidity G = 90 KPa is bonded to two rigid horizontal plates. The lower plate is fixed, while the upper plate is subjected to a horizontal force P. knowing that the upper plate moves through 0.04 cm under the force’s action if the height of the block is 2cm, find the force P exerted on the upper plate.

    1. 180
    2. 360
    3. 720
    4. 90

    Solution: Option 1. is the answer.

    ezgif 4 a111d0d3cd
    ezgif 4 66b0bbae6c

    Find the value of shear stresses developed in the pin A for the bell crank mechanism shown in the figure? Find the safe diameter of the pin if the allowable shear stresses for the pin material is180 MPa.

    1. 3mm
    2. 4mm
    3. 4.5mm
    4. 5mm

    Solution: Answer is option 4.

                       Stresses developed in pin are shear stress and bearing stress.

                       Force at B= 5*0.1/0.15= 3.33KN

    ezgif 4 fc850134cf

    Considering double shear at A

    ezgif 4 76108afe17

    The safe diameter of pin is more significant than 4.6mm.

    Which of the following basic assumption is not considered while deriving torsion equation for a circular member?

    1. The material must be homogenous and isotropic.
    2. A plane perpendicular to the axis remains plane also after the torque application.
    3. Shear strain varies linearly from the central axis in a circular member when subjected to a torque.
    4. The material does not obey Hooke’s law

    Solution: Option 4.

    CONCLUSION 

    In this article all the concepts related to shear stress are discussed in detail. It is very important to know about shear stress while designing any product.

    To learn more on mechanical engineering click here!