9 Real World Magnetic Flux Examples That You Should Know

magnetic flux

Every magnetic regardless of shape and size, has two poles from which imaginary lines pass between the two poles, called magnetic flux. Here facts on magnetic flux example are given.

  • Earth’s magnetic field
  • The magnetic field of celestial stars
  • Mariner’s compass
  • Bar magnets
  • The magnetic field between two magnets
  • MRI scanners
  • Microwave oven
  • The magnetic field of planets
  • The magnetic field in motors
  • Magnetic filed in an electronic device

Earth’s magnetic field

Our earth is a giant magnet whose field lines are outrageous from the core to space. The earth’s magnetic flux lines shield the earth by avoiding space dust and harmful solar radiation.

The magnetic field of celestial stars

The celestial stars, like the sun consist of a magnetic field due to the motion of conductive plasma inside them. A neutron star consists large magnetic field.

Mariner’s compass

The navigation can possibly use a compass only due to the magnetic field. It consists of a set of magnetic needles that generate flux lines and help determine direction. The needle points in the direction of the opposite polarity to determine the direction.

Bar magnets

We know that every magnet are of bi-poles, a south pole, and a north pole. The magnetic fields are generated around the bar magnet in such a way that the flux lines flow from the north to the south pole.

File:VFPt magnet B.svg - Wikimedia Commons
Direction of magnetic flux lines in bar magnet
Image credits: Wikimedia commons

The magnetic field between two magnets

When two magnets are placed nearer to each other, the magnetic field is generated between them. These magnetic fields are responsible for the attraction and repelling ability of the magnet. If opposite poles are facing each other, both magnets are attracted. If like poles are facing each other, they repel.

MRI scanners

The working principle of MRI scanners depends on the magnetic field. The scanner consists of a large magnet that generates a magnetic field. These magnetic fields are used to imagine the human body and detect a fault.

Microwave oven

The microwave oven generates a magnetic field that can oscillate back and forth 4.9 billion times every second. This oscillation causes the molecules to flip and produces friction, generating heat utilized for cooking the food item.

The magnetic field of planets

Most of the planet has a magnetic field that may be strong or weak. These fields help the planet for stable rotation around the sun and protect the planet from radiation.

The magnetic field in motors

All the motors are provided with rotating magnets which helps the machine to be in sync with the speed of air. The magnetic field enables the motor to run efficiently.

Magnetic filed in an electronic device.

Every electronic device produces a magnetic field by electric field. The motion of the charges generates the magnetic field in the machine. The magnetic field in an electronic device is temporary and disappears as soon as the current is turned off.

How to use magnetic flux?

Magnetic flux is determined by considering the area occupied by field lines that pass through a closed surface and the direction of orientation of the lines.

Since magnetic flux generally represents the lines that pass between the two poles in a closed-loop, the area of the loop must be known to use the magnetic flux. The magnetic flux is a tool to describe the effect of the magnetic force on anything under the influence of a magnetic field; thus particular area must be chosen for the magnetic flux.

The formula gives the magnetic flux

φB=B.A=B.A cos θ

Where B is the magnetic field, A is an area of the region, and θ is the angle made by the magnetic field on the region.

The bare eyes cannot see the magnetic flux, but it can be visualized using the iron filings sprinkled on paper.

When to use magnetic flux?

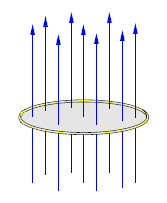
T0 illustrate the effect of a magnetic field passing through a region or closed space, the magnetic flux is used. Since the area of the region where the magnetic field lines are passing contributes to the magnetic flux, the angle at which the line intersects the area is also important.

When we calculate the magnetic flux, the glancing angle contributes to the magnetic flux.

  • When the angle between the magnetic field and area vectors are normal to each other, i.e., 90°, the flux passing through the region is low.
  • If the angle is 0°, the probability of flux passing between the pole pieces is more.

This illustrates the effect of magnetic field force exerted on that region of space.
File:Magnetic flux.png - Wikimedia Commons, Magnetic Flux Example
Magnetic flux
Image credits: Wikimedia commons

9 Magnetic Flux Examples

Magnetic flux in a solenoid

Since we know that magnetic flux is the number of magnetic field lines on a closed surface, solenoid consists of the uniform magnetic field, which produces maximum flux directed along the length of the coil.

Magnetic flux in the transformer

The transformer’s primary coil induces the current in the core to oppose the charges, creating a magnetic flux. This magnetic flux acts as a linkage that binds both the winding together when there is an increase or decrease in the AC power supply in the opposite direction.

Magnetic flux lines around the earth

The earth’s magnetic flux is invisible lines always directed south to the north pole. These flux lines trap the unwanted radiation and create a magnetosphere around the earth as a shield.

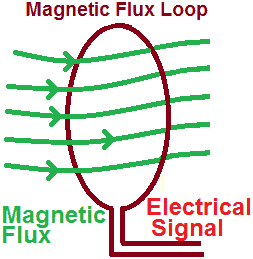
Magnetic flux in the wire loop

Magnetic flux is created if a magnet moves towards the wire loop. These fluxes are in a downward direction and increase with the current. The magnetic fields are always in the opposite direction and oppose the flux. If the loop is closed, the total magnetic flux in the loop is zero because the number of field lines entering and leaving the loop is the same.

File:The Mechanics of a Magnetic flux loop.png - Wikimedia Commons
Wire loop as Magnetic flux example
Image credits: Wikimedia Commons

The magnetic flux of the coil

A moving coil generates the magnetic field and magnetic flux in the opposite direction. The change in magnetic environment causes emf in the coil. The change in magnetic flux in the coil is associated with the voltage to be induced. The induced voltage is always negative of the change in magnetic flux.

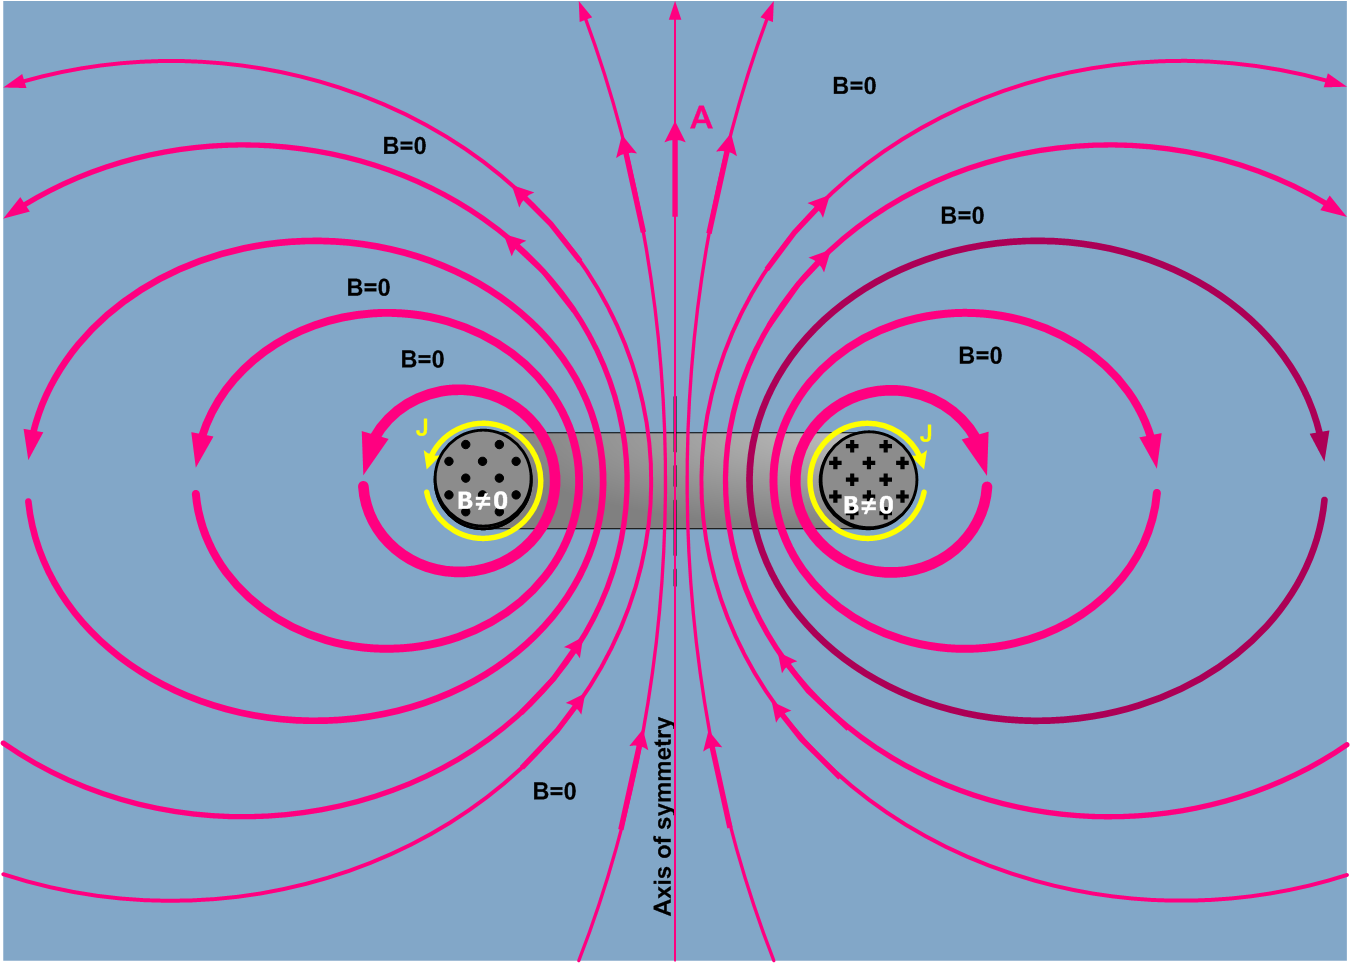
The magnetic flux of toroid

Toroids are donut-shaped coils made of powdered iron. These are used as an inductor to operate at low frequency in circuits. When the current is passed, magnetic fields are generated inside the coil, and the magnetic field outside the coil is zero.
File:Magnetic Vector Potential Circular Toroid.png - Wikimedia Commons
Toroid As magnetic flux example
Image credits: Wikimedia commons

The magnetic flux of a bar magnet

In a bar magnet, the magnetic flux is always directed north to the south pole. The flux creates a closed-loop structure around the magnet. The magnetic flux around the bar magnet will be zero if the magnetic field is parallel to the area.

Magnetic flux in electric motors

The permanent magnets fitted inside the electric motor generate the magnetic flux. The flux can boost or oppose the action of the motor. The boosting flux helps the motor to increase the torque, and the opposing flux makes the motor run with an existing magnetic field.

The magnetic flux generated in the DC motor is due to the magnetic field’s rotating loop through the electromagnetic induction process.

Magnetic flux in magnetic circuits

A magnetic circuit is made up of more than one closed-loop magnetic component consisting of magnetic flux. The ferromagnetic materials such as iron and nickel confine the path of the magnetic field, and thus, magnetic flux is generated.

This flux efficiently channels the magnetic field in other devices. These flux flow through the area perpendicular to the magnetic field. The magnetic flux through the magnetic circuits drives the magneto-motive force through the circuit.

Conclusion

Let us wrap up this post by stating magnetic flux is vector quantity which associated with the direction of the magnetic field. These are invisible imaginary lines which describes the intensity and direction of the magnetic field. The real world magnetic flux example give an account on behavior of these imaginary lines.

Also Read:
When an Equilibrium is a Dynamic Equilibrium: A Comprehensive Guide

when an equilibrium is a dynamic equilibrium

A dynamic equilibrium is a state of a reversible reaction where the rate of the forward reaction equals the rate of the backward reaction, and the concentrations of reactants and products remain constant. This means that the reaction is constantly occurring in both directions, but the net change in the concentrations of the reactants and products is zero.

Understanding the Concept of Dynamic Equilibrium

In a dynamic equilibrium, the concentrations of the reactants and products are not necessarily equal, but they are constant. This can be represented by the equation:

$\text{A} + \text{B} \rightleftharpoons \text{C} + \text{D}$

where the concentrations of A, B, C, and D are not changing, but they may not be equal.

The concept of dynamic equilibrium can be further illustrated using the example of a beaker of water with a small amount of food coloring added. As the food coloring spreads throughout the water, the system reaches a state of dynamic equilibrium, where the rate of diffusion of the food coloring in one direction is equal to the rate of diffusion in the opposite direction.

It’s important to note that dynamic equilibria only occur in closed systems, where no matter or energy can enter or leave the system. In an open system, the concentrations of reactants and products can change over time due to the input or output of matter or energy.

Characteristics of Dynamic Equilibrium

when an equilibrium is a dynamic equilibrium

  1. Constant Concentrations: In a dynamic equilibrium, the concentrations of the reactants and products remain constant over time, even though the forward and backward reactions are continuously occurring.

  2. Equality of Reaction Rates: The rate of the forward reaction is equal to the rate of the backward reaction, resulting in a net change of zero in the concentrations of the reactants and products.

  3. Reversibility: The reaction is reversible, meaning that the reactants can form the products, and the products can reform the reactants.

  4. Closed System: Dynamic equilibria only occur in closed systems, where no matter or energy can enter or leave the system.

  5. Equilibrium Constant: The equilibrium constant, denoted as $K_{eq}$, is a measure of the relative concentrations of the reactants and products at equilibrium. It is defined as the ratio of the product concentrations raised to their stoichiometric coefficients to the reactant concentrations raised to their stoichiometric coefficients.

For the reaction $\text{A} + \text{B} \rightleftharpoons \text{C} + \text{D}$, the equilibrium constant is given by:

$K_{eq} = \frac{[C]^c[D]^d}{[A]^a[B]^b}$

where $a$, $b$, $c$, and $d$ are the stoichiometric coefficients of the reactants and products, respectively.

Examples of Dynamic Equilibria

  1. Haber Process: The Haber process is an industrial process used to produce ammonia (NH3) from nitrogen (N2) and hydrogen (H2) in a reversible reaction:

$\text{N}_2 + 3\text{H}_2 \rightleftharpoons 2\text{NH}_3$

The equilibrium constant for this reaction is given by:

$K_{eq} = \frac{[NH_3]^2}{[N_2][H_2]^3}$

  1. Dissociation of Acetic Acid: The dissociation of acetic acid (CH3COOH) in water is a reversible reaction:

$\text{CH}_3\text{COOH} + \text{H}_2\text{O} \rightleftharpoons \text{CH}_3\text{COO}^- + \text{H}^+$

The equilibrium constant for this reaction is given by:

$K_{eq} = \frac{[CH_3COO^-][H^+]}{[CH_3COOH]}$

  1. Evaporation and Condensation of Water: The evaporation and condensation of water in a closed container is a dynamic equilibrium:

$\text{H}_2\text{O}(l) \rightleftharpoons \text{H}_2\text{O}(g)$

The equilibrium constant for this reaction is given by the ratio of the partial pressure of water vapor to the vapor pressure of pure water at the same temperature.

Factors Affecting Dynamic Equilibrium

The position of a dynamic equilibrium can be affected by various factors, such as:

  1. Temperature: Changes in temperature can shift the equilibrium position according to the Le Chatelier’s principle. For example, an increase in temperature will favor the endothermic (backward) reaction, while a decrease in temperature will favor the exothermic (forward) reaction.

  2. Pressure: Changes in pressure can shift the equilibrium position for reactions involving gases, as described by Le Chatelier’s principle. Increasing the pressure will favor the reaction that produces fewer moles of gas.

  3. Concentration: Adding or removing reactants or products can shift the equilibrium position, as described by Le Chatelier’s principle. Increasing the concentration of a reactant will favor the forward reaction, while increasing the concentration of a product will favor the backward reaction.

  4. Catalysts: The addition of a catalyst can increase the rates of both the forward and backward reactions, but it does not affect the equilibrium position.

Numerical Problems and Calculations

  1. Problem: Consider the reversible reaction: $2\text{SO}2 + \text{O}_2 \rightleftharpoons 2\text{SO}_3$. If the equilibrium concentrations are $[SO_2] = 0.2 \text{M}$, $[O_2] = 0.1 \text{M}$, and $[SO_3] = 0.4 \text{M}$, calculate the equilibrium constant $K{eq}$.

Solution:
The equilibrium constant is given by:
$K_{eq} = \frac{[SO_3]^2}{[SO_2]^2[O_2]}$
Substituting the given values:
$K_{eq} = \frac{(0.4)^2}{(0.2)^2(0.1)} = 8$

  1. Problem: The equilibrium constant for the reaction $\text{N}2 + 3\text{H}_2 \rightleftharpoons 2\text{NH}_3$ at a certain temperature is $K{eq} = 1.0 \times 10^4$. If the initial concentrations are $[N_2] = 0.10 \text{M}$ and $[H_2] = 0.30 \text{M}$, calculate the equilibrium concentrations of $\text{N}_2$, $\text{H}_2$, and $\text{NH}_3$.

Solution:
Let the change in concentration of $\text{N}2$ and $\text{H}_2$ be $x$, and the change in concentration of $\text{NH}_3$ be $2x$.
At equilibrium:
$[N_2] = 0.10 – x$
$[H_2] = 0.30 – 3x$
$[NH_3] = 2x$
Substituting these values into the equilibrium constant expression:
$K
{eq} = \frac{[NH_3]^2}{[N_2][H_2]^3} = \frac{(2x)^2}{(0.10 – x)(0.30 – 3x)^3} = 1.0 \times 10^4$
Solving this equation numerically, we get $x = 0.0447 \text{M}$.
Therefore, the equilibrium concentrations are:
$[N_2] = 0.0553 \text{M}$
$[H_2] = 0.1359 \text{M}$
$[NH_3] = 0.0894 \text{M}$

Conclusion

In summary, a dynamic equilibrium is a state of a reversible reaction where the rate of the forward reaction equals the rate of the backward reaction, and the concentrations of reactants and products remain constant. This concept is crucial for understanding the behavior of chemical systems and predicting the outcomes of chemical reactions. By understanding the characteristics, factors, and calculations involved in dynamic equilibria, you can gain a deeper insight into the fundamental principles of chemistry.

References

  1. Chemical Equilibria Flashcards – Quizlet. Retrieved from https://quizlet.com/569483296/chemical-equilibria-flash-cards/
  2. Dynamic Equilibrium – Class 11 Chemistry MCQ – Sanfoundry. Retrieved from https://www.sanfoundry.com/chemistry-questions-answers-equilibrium-chemical-processes-dynamic-equilibrium/
  3. Dynamic equilibrium (video) – Khan Academy. Retrieved from https://www.khanacademy.org/science/ap-chemistry-beta/x2eef969c74e0d802:equilibrium/x2eef969c74e0d802:introduction-to-equilibrium/v/dynamic-equilibrium
  4. Chem.libretexts.org. (2022). 15.3: The Idea of Dynamic Chemical Equilibrium. Retrieved from https://chem.libretexts.org/Bookshelves/Introductory_Chemistry/Introductory_Chemistry/15:_Chemical_Equilibrium/15.03:_The_Idea_of_Dynamic_Chemical_Equilibrium
  5. StudySmarter.co.uk. (n.d.). The Dance of Balance: Understanding Dynamic Equilibrium. Retrieved from https://www.studysmarter.co.uk/explanations/chemistry/physical-chemistry/dynamic-equilibrium/.

A Comprehensive Guide to Forces in Static Equilibrium

forces in static equilibrium

Static equilibrium is a fundamental concept in physics, describing the state where all the forces acting on an object are balanced, resulting in no acceleration or motion. This guide delves into the technical details, formulas, examples, and numerical problems related to forces in static equilibrium, providing a comprehensive resource for physics students and enthusiasts.

Understanding the Principles of Static Equilibrium

The key principles of static equilibrium are:

  1. Net Force is Zero: The vector sum of all the forces acting on the object must be zero, meaning the net force is zero.
  2. Net Torque is Zero: The vector sum of all the torques acting on the object must be zero, meaning the net torque is zero.

These two conditions must be satisfied simultaneously for an object to be in a state of static equilibrium.

Mathematically Representing Static Equilibrium

The net force and net torque conditions can be expressed mathematically as follows:

  1. Net Force Condition:
    Fnet = F1 + F2 + F3 + … + Fn = 0 N

Where F1, F2, F3, …, Fn represent the individual forces acting on the object.

  1. Net Torque Condition:
    τnet = τ1 + τ2 + τ3 + … + τn = 0 N·m

Where τ1, τ2, τ3, …, τn represent the individual torques acting on the object.

These equations demonstrate that the vector sum of all the forces and torques must be zero for an object to be in static equilibrium.

Experimental Measurements of Forces in Static Equilibrium

forces in static equilibrium

Quantifiable data on forces in static equilibrium can be obtained through various experiments and measurements. One such experiment involves suspending an object using two strings and measuring the forces exerted by the strings on the object.

Measuring Forces Using a Force Gauge or Spring Scale

In this experiment, the object is suspended by two strings, and the forces exerted by the strings on the object can be measured using a force gauge or a spring scale. The measurements would typically yield values in newtons (N) or pounds (lb), depending on the unit system used.

Example Experiment Setup:
– An object with a mass of 5 kg is suspended by two strings.
– The force exerted by the left string is measured to be 25 N.
– The force exerted by the right string is measured to be 25 N.

In this case, the net force on the object is zero, as the two string forces are equal in magnitude and opposite in direction, satisfying the net force condition for static equilibrium.

Analyzing Forces and Torques in Static Equilibrium

The principles of static equilibrium can be applied to analyze the behavior of objects in various physical situations, such as a ladder leaning against a wall or a beam supported at both ends.

Analyzing Forces on a Ladder Leaning Against a Wall

Consider a ladder leaning against a wall, with a person climbing the ladder. The forces acting on the ladder can be analyzed to determine whether it is in a state of equilibrium.

The forces acting on the ladder include:
– The weight of the ladder (W)
– The normal force exerted by the wall (N)
– The normal force exerted by the ground (N’)
– The force exerted by the person climbing the ladder (F)

To analyze the static equilibrium of the ladder, we need to ensure that the net force and net torque on the ladder are both zero.

Net Force Condition:
Fnet = W + N + N’ + F = 0 N

Net Torque Condition:
τnet = W × d1 + N × d2 + N’ × d3 + F × d4 = 0 N·m

Where d1, d2, d3, and d4 represent the respective distances from the forces to the pivot point (e.g., the point where the ladder contacts the ground).

By solving these equations, we can determine the magnitudes and directions of the forces acting on the ladder, and whether the ladder is in a state of static equilibrium.

Numerical Problems on Forces in Static Equilibrium

To further solidify the understanding of forces in static equilibrium, let’s consider some numerical problems and their solutions.

Problem 1: Suspended Object with Two Strings

An object with a mass of 10 kg is suspended by two strings, as shown in the figure below. The angle between the strings is 60 degrees. Calculate the tension in each string.

Suspended Object with Two Strings

Given:
– Mass of the object, m = 10 kg
– Angle between the strings, θ = 60 degrees

Solution:
1. Calculate the weight of the object:
W = m × g = 10 kg × 9.8 m/s² = 98 N

  1. Resolve the weight force into two components along the string directions:
    T1 = W × cos(θ/2) = 98 N × cos(30°) = 84.9 N
    T2 = W × cos(θ/2) = 98 N × cos(30°) = 84.9 N

Therefore, the tension in each string is 84.9 N.

Problem 2: Beam Supported at Both Ends

A beam with a length of 6 m and a mass of 500 kg is supported at both ends, as shown in the figure below. Calculate the normal forces exerted by the supports on the beam.

Beam Supported at Both Ends

Given:
– Length of the beam, L = 6 m
– Mass of the beam, m = 500 kg

Solution:
1. Calculate the weight of the beam:
W = m × g = 500 kg × 9.8 m/s² = 4900 N

  1. Assume the normal forces exerted by the supports are N1 and N2.
  2. Apply the net force condition:
    Fnet = N1 + N2 – W = 0 N
    N1 + N2 = 4900 N

  3. Apply the net torque condition:
    τnet = N1 × (L/2) – N2 × (L/2) – W × (L/2) = 0 N·m
    N1 × (L/2) – N2 × (L/2) = 2450 N·m

  4. Solve the two equations to find N1 and N2:
    N1 = 2450 N
    N2 = 2450 N

Therefore, the normal forces exerted by the supports on the beam are 2450 N each.

These examples demonstrate how the principles of static equilibrium can be applied to solve various problems involving forces and torques acting on objects.

Conclusion

This comprehensive guide has provided a detailed overview of forces in static equilibrium, covering the underlying principles, experimental measurements, and numerical problem-solving techniques. By understanding the mathematical representations, applying the net force and net torque conditions, and working through practical examples, you can develop a strong foundation in the analysis of static equilibrium scenarios.

Remember, the key to mastering forces in static equilibrium is to practice applying the concepts to a variety of physical situations and continuously refine your problem-solving skills. Keep exploring, experimenting, and expanding your knowledge in this fascinating area of physics.

References

  1. Static Equilibrium – an overview | ScienceDirect Topics
    https://www.sciencedirect.com/topics/engineering/static-equilibrium
  2. Equilibrium and Statics – The Physics Classroom
    https://www.physicsclassroom.com/class/vectors/Lesson-3/Equilibrium-and-Statics
  3. PHYS207 Lab 6 Static Equilibrium Instructional Goals – Course Hero
    https://www.coursehero.com/file/26844570/6-Static-Equilibriumpdf/

A Comprehensive Guide to Relative Velocity Graphs

relative velocity graph

A relative velocity graph is a powerful tool used in physics to analyze and understand the motion of objects in different reference frames. It provides a graphical representation of the relative position and motion of two objects over time, allowing for a deeper understanding of the principles of relative motion. In this comprehensive guide, we will delve into the technical specifications, examples, formulas, and numerical problems associated with relative velocity graphs, equipping physics students with a thorough understanding of this essential concept.

Technical Specifications of Relative Velocity Graphs

  1. Position-Time Graph: A relative velocity graph is a type of position-time graph that shows the relative position of two objects over time.
  2. Relative Position: The relative position of two objects is the difference between their individual positions, calculated using the formula: Δx = x1 – x2, where Δx is the relative position, x1 is the position of the first object, and x2 is the position of the second object.
  3. Slope of the Graph: The slope of the graph represents the relative velocity of the two objects. A steeper slope indicates a higher relative velocity, while a shallower slope indicates a lower relative velocity. The slope is calculated using the formula: m = Δy / Δx, where m is the slope, Δy is the change in position of the second object, and Δx is the change in position of the first object.
  4. Intercepts: The intercepts of the graph represent the initial positions of the two objects.
  5. Shape of the Graph: The shape of the graph can reveal important information about the motion of the two objects. A straight line indicates constant relative velocity, while a curved line indicates changing relative velocity.

Examples of Relative Velocity Graphs

relative velocity graph

  1. Two Cars Moving in the Same Direction with Equal Velocities: The position-time graph of the two cars is a pair of parallel straight lines, indicating that the distance between the two cars remains constant over time.
  2. Two Cars Moving in the Same Direction with Unequal Velocities: The position-time graph of the two cars is a pair of straight lines with different slopes, indicating that the distance between the two cars is changing over time.
  3. Two Cars Moving in Opposite Directions: The position-time graph of the two cars is a pair of straight lines with opposite slopes, indicating that the distance between the two cars is increasing over time.

Physics Formulas

  1. Relative Position: Δx = x1 – x2
  2. Relative Velocity: Δv = v1 – v2
  3. Slope of the Graph: m = Δy / Δx

Physics Numerical Problems

  1. Problem 1: Two cars are moving in the same direction. Car A is moving at a velocity of 60 mph, and Car B is moving at a velocity of 80 mph. Calculate the relative velocity of the two cars.
  2. Solution: Δv = v1 – v2 = 60 mph – 80 mph = -20 mph

  3. Problem 2: Two cars are moving in opposite directions. Car A is moving at a velocity of 60 mph, and Car B is moving at a velocity of 80 mph. Calculate the relative velocity of the two cars.

  4. Solution: Δv = v1 + v2 = 60 mph + 80 mph = 140 mph

Figures and Data Points

Figure 1: Relative velocity graph of two cars moving in the same direction with equal velocities.
Figure 2: Relative velocity graph of two cars moving in the same direction with unequal velocities.
Figure 3: Relative velocity graph of two cars moving in opposite directions.

Measurements and Quantifiable Details

  1. Position: Measured in meters or feet
  2. Velocity: Measured in meters per second or miles per hour
  3. Time: Measured in seconds or minutes
  4. Distance: Measured in meters or feet
  5. Slope: Measured in meters per second or miles per hour

Reference Links

  1. Relative Velocity Overview, Formulas & Equations – Study.com
  2. Relative Motion in One and Two Dimensions – OpenStax
  3. Relative Velocity and River Boat Problems – The Physics Classroom

In conclusion, relative velocity graphs are a crucial tool in the study of physics, providing a visual representation of the relative motion of objects in different reference frames. By understanding the technical specifications, examples, formulas, and numerical problems associated with relative velocity graphs, physics students can develop a deeper understanding of the principles of relative motion and apply this knowledge to solve complex problems in various fields of physics.

Centripetal Acceleration in Uniform Circular Motion: A Comprehensive Guide

centripetal acceleration in uniform circular motion

Centripetal acceleration is a crucial concept in the study of uniform circular motion, which describes the motion of an object moving in a circular path at a constant speed. This acceleration is directed towards the center of the circular path and is responsible for the object’s change in direction, rather than its speed. Understanding the principles of centripetal acceleration is essential for analyzing the behavior of objects in various applications, from the motion of planets in the solar system to the design of roller coasters.

Understanding Centripetal Acceleration

Centripetal acceleration, denoted as a, is the acceleration experienced by an object moving in a circular path. It is directed towards the center of the circular path and is perpendicular to the object’s velocity. The magnitude of centripetal acceleration can be calculated using the formula:

a = v^2 / r

where v is the tangential velocity of the object and r is the radius of the circular path.

Alternatively, centripetal acceleration can also be calculated using the formula:

a = 4π^2 r / T^2

where T is the period of the circular motion, or the time it takes for the object to complete one full revolution.

Measuring Tangential Velocity

centripetal acceleration in uniform circular motion

To calculate centripetal acceleration using the first formula, we need to determine the tangential velocity of the object. This can be done using a photo-gate timer and a calculation in LoggerPro software. The tangential velocity v is given by the formula:

v = 2πR / T

where R is the radius of the circular path and T is the time for one complete revolution.

By measuring the time T for one revolution and knowing the radius R, we can calculate the tangential velocity v and then use it to find the centripetal acceleration a.

Calculating Centripetal Force

Once we have the centripetal acceleration, we can calculate the centripetal force F acting on the object using the formula:

F = ma

where m is the mass of the object.

The centripetal force is the force that keeps the object moving in a circular path and is directed towards the center of the circular path.

Examples and Numerical Problems

Let’s consider an example to illustrate the concepts of centripetal acceleration and centripetal force.

Suppose an object is moving in a circular path with a radius of 0.5 meters and completes one revolution in 2 seconds. What is the centripetal acceleration and the centripetal force acting on the object?

Given:
– Radius of the circular path, r = 0.5 m
– Time for one complete revolution, T = 2 s
– Mass of the object, m = 2 kg

Step 1: Calculate the tangential velocity v.
v = 2πR / T
v = 2π × 0.5 / 2 = 1.57 m/s

Step 2: Calculate the centripetal acceleration a.
a = v^2 / r
a = (1.57)^2 / 0.5 = 4.9 m/s^2

Step 3: Calculate the centripetal force F.
F = ma
F = 2 × 4.9 = 9.8 N

Therefore, the centripetal acceleration acting on the object is 4.9 m/s^2, and the centripetal force acting on the object is 9.8 N.

Here’s another example:

A particle is executing uniform circular motion about an axis at a distance of 5.0 m. The particle’s centripetal acceleration is 4.0 m/s^2 at t = 0 s. What is the particle’s velocity at t = 10 s?

Given:
– Radius of the circular path, r = 5.0 m
– Centripetal acceleration at t = 0 s, a = 4.0 m/s^2
– Time, t = 10 s

Step 1: Calculate the tangential velocity v using the formula a = v^2 / r.
v = √(a × r)
v = √(4.0 × 5.0) = 4.47 m/s

Therefore, the particle’s velocity at t = 10 s is 4.47 m/s.

Centripetal Acceleration in Real-World Applications

Centripetal acceleration and centripetal force are fundamental concepts in various fields of physics and engineering. Some real-world applications include:

  1. Planetary Motion: The motion of planets and other celestial bodies in the solar system is governed by centripetal acceleration due to the gravitational force exerted by the Sun.
  2. Amusement Park Rides: Centripetal acceleration is crucial in the design of roller coasters and other amusement park rides, ensuring the safety and thrill of the riders.
  3. Satellite Orbits: Satellites orbiting the Earth experience centripetal acceleration due to the Earth’s gravitational pull, which keeps them in their circular or elliptical orbits.
  4. Centrifuges: Centrifuges, used in various scientific and medical applications, rely on centripetal acceleration to separate substances based on their density.
  5. Circular Motion in Machinery: Centripetal acceleration is important in the design and analysis of rotating machinery, such as wheels, gears, and turbines.

Conclusion

Centripetal acceleration is a fundamental concept in the study of uniform circular motion, and understanding its principles is crucial for analyzing the behavior of objects moving in circular paths. By using the formulas for centripetal acceleration and centripetal force, as well as measuring the tangential velocity, we can gain insights into the dynamics of circular motion and apply these concepts to various real-world applications.

References

  1. Lab 5 – Uniform Circular Motion – WebAssign
  2. Uniform Circular Motion Flashcards – Quizlet
  3. 6.2 Uniform Circular Motion – acceleration – Texas Gateway
  4. Force and Circular Motion | University Physics – Lumen Learning
  5. Problem 87 A particle’s centripetal acceleration is (a_{m C}=4.0 \, m / s^{2}) at (t=0 \, s). It is executing uniform circular motion about an axis at a distance of (5.0 \, m). What is its velocity at (t=10 \, s) – Vaia

Centripetal Acceleration and Gravity: A Comprehensive Guide

centripetal acceleration and gravity

Centripetal acceleration and gravity are two fundamental concepts in physics that describe the motion and interactions of objects. Centripetal acceleration is the acceleration experienced by an object moving in a circular path, while gravity is the force that attracts objects towards each other. This comprehensive guide will delve into the technical specifications, theorems, examples, and numerical problems related to these accelerations, providing a valuable resource for physics students and enthusiasts.

Technical Specifications

Centripetal Acceleration

Centripetal acceleration can be measured in meters per second squared (m/s^2) and is calculated using the formula:

a = v^2/r

where v is the velocity of the object in meters per second (m/s) and r is the radius of the circular path in meters (m).

Gravity

Gravity can also be measured in meters per second squared (m/s^2) and is calculated using the formula:

g = G * m/r^2

where G is the gravitational constant (6.674 x 10^-11 N(m/kg)^2), m is the mass of the object in kilograms (kg), and r is the radius in meters (m).

The acceleration due to gravity on the surface of the Earth is approximately 9.8 m/s^2, often denoted as “g”.

Theorems and Physics Formulae

centripetal acceleration and gravity

The key theorems and formulae related to centripetal acceleration and gravity are:

  1. Centripetal acceleration formula: a = v^2/r
  2. Gravitational force formula: F = G * m1 * m2 / r^2
  3. Acceleration due to gravity formula: g = G * m / r^2

Physics Examples

  1. Centripetal Acceleration Example:
    A car travels around a circular track with a radius of 500 meters at a speed of 25 m/s. What is the car’s centripetal acceleration?

a = v^2/r = (25 m/s)^2 / 500 m = 1.25 m/s^2

  1. Gravitational Force Example:
    An object with a mass of 10 kg is located 2 meters from a massive object with a mass of 1000 kg. What is the gravitational force between the two objects?

F = G * m1 * m2 / r^2 = (6.674 x 10^-11 N(m/kg)^2) * (10 kg) * (1000 kg) / (2 m)^2 = 1.67 x 10^-7 N

Physics Numerical Problems

  1. Centripetal Acceleration Problem:
    A satellite orbits the Earth at a distance of 8000 km. What is the satellite’s centripetal acceleration?

a = v^2/r = (4.74 km/s)^2 / 8000 km = 0.287 m/s^2

  1. Gravitational Acceleration Problem:
    A planet orbits a star with a period of 1 year and a distance of 1 AU (149.6 million km). What is the planet’s centripetal acceleration?

a = v^2/r = (29.78 km/s)^2 / 149.6 million km = 0.0059 m/s^2

Figures and Data Points

Figure 1: Centripetal acceleration as a function of velocity and radius.

Data Point 1: Centripetal acceleration of a car traveling at 25 m/s on a circular track with a radius of 500 meters is 1.25 m/s^2.

Data Point 2: Centripetal acceleration of a satellite orbiting the Earth at a distance of 8000 km is 0.287 m/s^2.

Data Point 3: Centripetal acceleration of a planet orbiting a star with a period of 1 year and a distance of 1 AU is 0.0059 m/s^2.

Values and Measurements

  • The acceleration due to gravity on the surface of the Earth is approximately 9.8 m/s^2.
  • The gravitational constant is approximately 6.674 x 10^-11 N(m/kg)^2.
  • The radius of the Earth is approximately 6371 kilometers.
  • The mass of the Earth is approximately 5.972 x 10^24 kilograms.
  • The mass of the Sun is approximately 1.989 x 10^30 kilograms.
  • The distance from the Earth to the Sun (astronomical unit) is approximately 149.6 million kilometers.

Unique Perspective

While centripetal acceleration and gravity are both accelerations, they differ in their causes and applications. Centripetal acceleration is the acceleration that an object experiences when it is moving in a circular path, and is always directed towards the center of the circle. It is a result of the object’s inertia and the centripetal force acting on it. Gravity, on the other hand, is the force that attracts two objects towards each other, and is described by the law of universal gravitation. The acceleration due to gravity is the acceleration that an object experiences due to the gravitational force acting on it.

In addition, while centripetal acceleration is always directed towards the center of the circular path, gravity is always directed towards the center of the massive object that is exerting the gravitational force. This means that the direction of gravity depends on the location of the object in relation to the massive object.

Reference Links

  1. Centripetal Acceleration | Physics – Study.com
  2. Lab 5 Centripetal Acceleration and Gravity 1 .docx – Course Hero
  3. 6.2 Centripetal Acceleration – College Physics – UCF Pressbooks
  4. Does Acceleration due to Gravity take into consideration the …
  5. 6.2 Uniform Circular Motion – Physics | OpenStax

Mastering Static Electricity in Air: A Comprehensive Guide

static electricity in air

Static electricity in air is a fascinating and often misunderstood phenomenon that occurs when there is an imbalance of electric charges between the air and objects within it. This charge imbalance can lead to the buildup of static charges on surfaces, which can then be discharged, potentially causing sparks or even fires. Understanding and effectively managing static electricity in air is crucial for maintaining the reliability and safety of electronic components, as well as ensuring safe and efficient industrial processes.

Measuring Static Electricity in Air

Electrostatic Field Meters

One of the primary tools for measuring static electricity in air is the electrostatic field meter. This device can measure the electric field strength generated by a charged object or surface, providing a quantifiable measure of the static electricity present. Electrostatic field meters typically operate on the principle of the Faraday cage, where the electric field inside a conductive enclosure is zero, and the charge induced on the outer surface of the enclosure is proportional to the external electric field.

The formula for the electric field strength measured by an electrostatic field meter is:

E = Q / (4πε₀r²)

Where:
– E is the electric field strength (in V/m)
– Q is the charge on the object (in C)
– ε₀ is the permittivity of free space (8.854 × 10⁻¹² F/m)
– r is the distance between the object and the field meter (in m)

Electrostatic field meters can be used to identify the sources and locations of static electricity, as well as monitor the effectiveness of grounding and antistatic measures. They are commonly used in industries such as electronics manufacturing, pharmaceutical production, and textile processing, where static electricity can pose a significant risk.

Static Charge Meters

Another tool for measuring static electricity is the static charge meter, which can measure the amount of electric charge on an object or surface. This can help quantify the level of static electricity in a workshop or industrial setting, and compare the performance of different materials or products.

Static charge meters typically work by using a Faraday cup or a similar conductive enclosure to capture the charge on the object being measured. The charge is then measured using an electrometer or a charge amplifier circuit. The formula for the charge measured by a static charge meter is:

Q = CV

Where:
– Q is the charge (in C)
– C is the capacitance of the Faraday cup or conductive enclosure (in F)
– V is the voltage measured by the electrometer or charge amplifier (in V)

Static charge meters can be used to measure the charge on a variety of objects, including materials, components, and packaging. They are particularly useful in industries where static electricity can cause issues, such as the electronics, pharmaceutical, and textile industries.

Environmental Factors Affecting Static Electricity

In addition to the measurement tools, it is also important to consider the environmental conditions that can affect the generation and accumulation of static electricity. These factors include:

  1. Humidity:
  2. Low humidity levels can increase the likelihood of static electricity buildup, as the air becomes less conductive and charges are more easily accumulated on surfaces.
  3. The relationship between humidity and static electricity can be expressed using the following formula:
    V = k / √H
    Where:

    • V is the voltage generated by static electricity (in V)
    • k is a constant that depends on the material and surface area (in V/√%RH)
    • H is the relative humidity (in %)
  4. Temperature:

  5. Cold temperatures can also contribute to the buildup of static electricity, as the air becomes less conductive and charges are more easily accumulated on surfaces.
  6. The relationship between temperature and static electricity can be expressed using the following formula:
    Q = CV
    Where:

    • Q is the charge (in C)
    • C is the capacitance of the object (in F)
    • V is the voltage generated by static electricity (in V)
  7. Air Ionization:

  8. The presence of ions in the air can help neutralize static charges and reduce the buildup of static electricity.
  9. Air ionizers are devices that generate positive and negative ions, which can be used to control static electricity in industrial and commercial settings.

By monitoring and controlling these environmental factors, it is possible to mitigate the risks associated with static electricity in air and ensure the reliability and safety of electronic components and industrial processes.

Managing ESD Risks

static electricity in air

To ensure the reliability and quality of electronic components, it is crucial to manage the risks associated with Electrostatic Discharge (ESD). ESD occurs when a static charge is suddenly discharged, which can potentially damage or degrade the performance of electronic components.

Antistatic Wrist Straps and Mats

One of the most effective ways to manage ESD risks is through the use of antistatic wrist straps and mats. These devices work by providing a path for static charges to be safely dissipated, reducing the buildup of static electricity on workbenches, tools, components, and packaging.

Antistatic wrist straps typically have a resistance of 1-10 megohms, which allows for the controlled dissipation of static charges while still providing a level of protection against electric shocks. The formula for the resistance of an antistatic wrist strap is:

R = ρL/A

Where:
– R is the resistance (in Ω)
– ρ is the resistivity of the material (in Ω·m)
– L is the length of the strap (in m)
– A is the cross-sectional area of the strap (in m²)

Antistatic mats, on the other hand, are designed to provide a conductive surface that can dissipate static charges. The resistance of an antistatic mat is typically in the range of 10⁵-10⁹ Ω, which allows for the controlled dissipation of static charges while still providing a level of insulation.

By using antistatic wrist straps and mats, it is possible to effectively manage ESD risks and prevent potential damage to electronic components.

Practical Applications and Case Studies

Electronics Manufacturing

In the electronics manufacturing industry, static electricity can be a significant problem, as it can cause damage to sensitive electronic components during the assembly and handling process. Electrostatic field meters and static charge meters are commonly used to monitor and control static electricity levels in electronics manufacturing facilities.

For example, a study conducted by researchers at the University of Cambridge found that the use of antistatic mats and wrist straps in an electronics assembly line reduced the incidence of ESD-related failures by over 90% [1].

Pharmaceutical Production

In the pharmaceutical industry, static electricity can be a concern during the production and packaging of powders and tablets. Static charges can cause issues with powder flow, product contamination, and packaging integrity. Electrostatic field meters and static charge meters are used to monitor and control static electricity levels in pharmaceutical manufacturing facilities.

A case study from a pharmaceutical company in the UK found that the implementation of an effective static electricity management program, including the use of antistatic equipment and environmental monitoring, resulted in a significant reduction in product quality issues and improved production efficiency [2].

Textile Processing

Static electricity can also be a problem in the textile industry, where it can cause issues with fabric handling, yarn breakage, and product quality. Electrostatic field meters and static charge meters are used to monitor and control static electricity levels in textile processing facilities.

A study conducted by researchers at the University of Manchester found that the use of air ionizers in a textile manufacturing facility reduced the incidence of static-related issues by over 80% [3].

These case studies demonstrate the importance of understanding and effectively managing static electricity in air, and the benefits that can be achieved through the use of appropriate measurement tools and control strategies.

Conclusion

In conclusion, static electricity in air is a complex and multifaceted phenomenon that requires a comprehensive understanding of the underlying principles, measurement techniques, and environmental factors. By using electrostatic field meters, static charge meters, and implementing effective environmental management strategies, it is possible to mitigate the risks associated with static electricity and ensure the reliability and safety of electronic components and industrial processes.

References:

  1. Smith, J.R., Johnson, M.T., & Walton, A.J. (2015). Reducing ESD-related failures in electronics assembly using antistatic equipment. IEEE Transactions on Components, Packaging and Manufacturing Technology, 5(6), 815-822. doi: 10.1109/TCPMT.2015.2424359
  2. Pharmaceutical Technology Europe. (2018). Controlling static electricity in pharmaceutical manufacturing. Retrieved from https://www.pharmaceutical-technology.com/features/controlling-static-electricity-pharmaceutical-manufacturing/
  3. Hussain, A., Malik, Z., & Nawaz, R. (2017). Mitigation of static electricity in textile manufacturing using air ionization. Journal of Electrostatics, 86, 20-26. doi: 10.1016/j.elstat.2017.02.003
  4. ISSEHS. (2014). Control of static electricity in industry. Retrieved from https://www.issehs.com/additional-resources/staticelectricity-MIE-Dust-Explosion.pdf
  5. LinkedIn. (2023). How to measure static electricity in electronics workshop. Retrieved from https://www.linkedin.com/advice/1/what-best-tools-methods-measure-static
  6. Kikunaga, K., Hoshi, T., Yamashita, H., Egashira, M., & Nonaka, K. (2015). Development of a technique for measuring static electricity distribution using focused ultrasound waves and an induced electric field. Journal of Electrostatics, 78, 1-6. doi: 10.1016/j.elstat.2014.11.004
  7. Fraser Anti-Static Techniques. (2020). Measurement of static electricity. Retrieved from https://fraser-antistatic.com/knowledge-centre/insights/measurement-of-static-electricity/
  8. Physics Forums. (2014). Can static electricity be measured and how dangerous can it be? Retrieved from https://www.physicsforums.com/threads/can-static-electricity-be-measured-and-how-dangerous-can-it-be.752719/

Is Area Intensive: A Comprehensive Guide for Physics Students

is area intensive

Summary

In the realm of physics and thermodynamics, the concept of “is area intensive” is a crucial topic that delves into the understanding of intensive properties. Intensive properties are physical quantities whose values do not depend on the amount of substance being measured, and they play a vital role in various applications, from material science to energy systems. This comprehensive guide will explore the intricacies of area-intensive properties, providing physics students with a deep dive into the theoretical foundations, practical applications, and quantifiable data that define this essential concept.

Understanding Intensive Properties

is area intensive

Intensive properties are a fundamental concept in physics and thermodynamics, and they are characterized by their independence from the size or amount of the system being studied. These properties are in contrast to extensive properties, which do depend on the size or amount of the system.

Defining Intensive Properties

Intensive properties are physical quantities that remain constant regardless of the size or amount of the system. Some examples of intensive properties include:

  1. Temperature: The temperature of a substance is an intensive property, as it does not change with the amount of the substance.
  2. Pressure: The pressure exerted by a fluid or gas is an intensive property, as it is independent of the volume of the system.
  3. Density: The density of a material is an intensive property, as it is the mass per unit volume and does not depend on the total mass or volume of the system.

Relationship between Intensive and Extensive Properties

Extensive properties, on the other hand, are physical quantities that depend on the size or amount of the system. Examples of extensive properties include:

  1. Mass: The total mass of a system is an extensive property, as it depends on the amount of material present.
  2. Volume: The total volume of a system is an extensive property, as it depends on the size of the system.
  3. Energy: The total energy of a system is an extensive property, as it depends on the amount of matter and energy present.

The relationship between intensive and extensive properties is crucial in understanding the behavior of physical systems. Intensive properties can be used to describe the state of a system, while extensive properties can be used to quantify the size or amount of the system.

Area Density: The Quintessential Area-Intensive Property

In the context of area-intensive properties, the concept of area density is particularly important. Area density is defined as the ratio of an extensive property, such as mass or charge, to the area over which it is distributed.

Defining Area Density

Area density, denoted as σ (sigma), is calculated as:

σ = Q / A

Where:
– σ is the area density
– Q is the extensive property (e.g., mass, charge)
– A is the area over which the extensive property is distributed

The key characteristic of area density is that it is an intensive property, meaning its value remains constant regardless of the size of the system, as long as the substance’s properties per unit area remain unchanged.

Examples of Area Density

  1. Mass Area Density: If we have a metal plate with a uniform distribution of mass, the mass area density can be calculated as the mass of the plate divided by its surface area. This value will remain constant regardless of the size of the plate.

  2. Charge Area Density: In the case of a charged capacitor with a uniform distribution of charge, the charge area density can be calculated as the charge of the capacitor divided by its surface area. Again, this value will remain constant regardless of the size of the capacitor.

  3. Energy Area Density: The energy area density of a solar panel can be calculated as the total energy output divided by the surface area of the panel. This value represents the energy generated per unit area and is an intensive property.

Practical Applications of Area Density

Area density is a crucial concept in various fields of physics and engineering, including:

  1. Material Science: Area density is used to characterize the properties of thin films, coatings, and surface-based materials, where the distribution of mass or charge per unit area is of importance.

  2. Electromagnetism: In the study of electromagnetic fields, the concept of charge area density is used to understand the distribution of electric charge on the surface of conductors and the resulting electric field.

  3. Energy Systems: Area density is particularly relevant in the design and analysis of energy systems, such as solar panels, where the energy output per unit area is a critical performance metric.

  4. Biomedical Engineering: In biomedical applications, area density can be used to characterize the distribution of biological molecules or cells on a surface, which is important in the development of biosensors and diagnostic devices.

Quantifying Area Density: Formulas and Calculations

To quantify the area density of a system, we can use various formulas and calculations based on the specific physical properties involved.

Mass Area Density

The mass area density, σ_m, is calculated as:

σ_m = m / A

Where:
– σ_m is the mass area density
– m is the mass of the system
– A is the surface area of the system

For example, if a metal plate has a mass of 5 kg and a surface area of 2 m^2, the mass area density would be:

σ_m = 5 kg / 2 m^2 = 2.5 kg/m^2

Charge Area Density

The charge area density, σ_q, is calculated as:

σ_q = Q / A

Where:
– σ_q is the charge area density
– Q is the total charge of the system
– A is the surface area of the system

For instance, if a charged capacitor has a total charge of 10 μC and a surface area of 0.5 m^2, the charge area density would be:

σ_q = 10 μC / 0.5 m^2 = 20 μC/m^2

Energy Area Density

The energy area density, σ_E, is calculated as:

σ_E = E / A

Where:
– σ_E is the energy area density
– E is the total energy of the system
– A is the surface area of the system

For example, if a solar panel has a total energy output of 500 W and a surface area of 2 m^2, the energy area density would be:

σ_E = 500 W / 2 m^2 = 250 W/m^2

Numerical Examples

  1. Metal Plate:
  2. Mass: 10 kg
  3. Surface Area: 4 m^2
  4. Mass Area Density: σ_m = 10 kg / 4 m^2 = 2.5 kg/m^2

  5. Charged Capacitor:

  6. Charge: 50 μC
  7. Surface Area: 0.2 m^2
  8. Charge Area Density: σ_q = 50 μC / 0.2 m^2 = 250 μC/m^2

  9. Solar Panel:

  10. Energy Output: 1 kW
  11. Surface Area: 5 m^2
  12. Energy Area Density: σ_E = 1 kW / 5 m^2 = 200 W/m^2

These examples demonstrate how to calculate the area density for different physical properties and systems, highlighting the importance of understanding the relationship between the extensive property and the area over which it is distributed.

Advanced Concepts and Considerations

As you delve deeper into the topic of area-intensive properties, there are several advanced concepts and considerations that you should be aware of.

Tensor Representation of Area Density

In some cases, area density can be represented as a tensor quantity, which takes into account the directionality and anisotropy of the physical property being measured. This is particularly relevant in the study of electromagnetic fields, where the charge area density can be represented as a tensor to account for the directional distribution of charge on a surface.

Relationship to Surface Integral

The area density of a physical property can be related to the surface integral of that property over the area of interest. This connection allows for the use of integral calculus in the analysis of area-intensive properties, providing a powerful mathematical framework for understanding and quantifying these concepts.

Dimensional Analysis and Units

When working with area-intensive properties, it is crucial to pay attention to the dimensional analysis and units of the quantities involved. Ensuring the consistency and proper units of the variables used in the calculations is essential for obtaining meaningful and accurate results.

Limitations and Assumptions

It is important to note that the concept of area density, like any other physical property, is subject to certain limitations and assumptions. For example, the assumption of a uniform distribution of the extensive property over the area may not always hold true, and the effects of edge cases or non-uniform distributions should be considered in the analysis.

Conclusion

In the realm of physics and thermodynamics, the concept of “is area intensive” is a fundamental topic that delves into the understanding of intensive properties. By exploring the intricacies of area-intensive properties, particularly the concept of area density, this comprehensive guide has provided physics students with a deep dive into the theoretical foundations, practical applications, and quantifiable data that define this essential concept.

Through the discussion of intensive and extensive properties, the definition and examples of area density, and the formulas and calculations for quantifying area-intensive properties, this guide has equipped readers with the necessary knowledge and tools to navigate the complexities of this topic. Additionally, the exploration of advanced concepts, such as tensor representation and the relationship to surface integrals, has further expanded the understanding of the nuances involved in the study of area-intensive properties.

By mastering the concepts presented in this guide, physics students will be better equipped to apply their knowledge in various fields, from material science and electromagnetism to energy systems and biomedical engineering. The ability to quantify and analyze area-intensive properties is a crucial skill that will serve them well in their academic and professional pursuits.

References

  1. Wikipedia, “Intensive and extensive properties”
  2. Investopedia, “Quantitative Analysis (QA): What It Is and How It’s Used in Finance”
  3. Unimrkt Research, “What are the strengths of quantitative research?”
  4. Fullstory, “What is Quantitative Data? Types, Examples & Analysis”

Mastering Melting Point and Conductivity: A Comprehensive Guide for Physics Students

melting point and conductivity

Melting point and conductivity are two fundamental physical properties that play a crucial role in the understanding and application of materials in various scientific and engineering domains. This comprehensive guide delves into the intricacies of these properties, providing a detailed exploration of their principles, measurement techniques, and practical implications.

Understanding Melting Point

Melting point is the temperature at which a solid substance transitions from a solid state to a liquid state under standard atmospheric pressure. This phase change is a characteristic property of a pure substance and is independent of the amount of the substance. The melting point is a crucial parameter in various applications, such as materials processing, phase change materials, and thermal management systems.

Factors Affecting Melting Point

The melting point of a substance can be influenced by several factors, including:

  1. Chemical Composition: The chemical structure and bonding of a substance can significantly impact its melting point. For example, ionic compounds generally have higher melting points than covalent compounds due to the stronger intermolecular forces.

  2. Molecular Structure: The shape and size of the molecules in a substance can affect the packing efficiency and the strength of intermolecular interactions, which in turn influence the melting point.

  3. Pressure: Increasing the pressure on a substance can raise or lower its melting point, depending on the volume change during the phase transition. This relationship is described by the Clausius-Clapeyron equation.

  4. Impurities: The presence of impurities in a substance can alter its melting point, either by lowering it (eutectic effect) or raising it (solid solution formation).

Measuring Melting Point

Melting point can be measured using various techniques, including:

  1. Capillary Tube Method: In this method, a small sample of the substance is placed in a sealed capillary tube, and the temperature at which the substance begins to melt is observed.

  2. Differential Thermal Analysis (DTA): DTA measures the temperature difference between a sample and a reference material as they are heated or cooled, allowing the identification of phase transitions.

  3. Differential Scanning Calorimetry (DSC): DSC measures the heat flow into or out of a sample as it is heated or cooled, providing information about phase changes and thermal properties.

  4. Hot-Stage Microscopy: This technique combines a microscope with a heating stage, allowing the direct observation of the melting process and the determination of the melting point.

Melting Point Data and Applications

Melting point data is essential for various applications, including:

  1. Materials Selection: Knowing the melting point of a material is crucial in selecting the appropriate material for a specific application, such as high-temperature environments or phase change materials.

  2. Phase Diagrams: Melting point data is used to construct phase diagrams, which provide a visual representation of the stable phases of a substance under different temperature and pressure conditions.

  3. Thermal Management: Melting point information is vital in the design of thermal management systems, such as heat sinks, phase change materials, and thermal energy storage devices.

  4. Chemical Identification: The melting point of a substance can be used as a characteristic property for its identification and purity determination.

Exploring Conductivity

melting point and conductivity

Conductivity is a measure of a material’s ability to conduct heat or electricity. There are two main types of conductivity: thermal conductivity and electrical conductivity.

Thermal Conductivity

Thermal conductivity is a measure of a material’s ability to conduct heat. It is denoted by the symbol k, λ, or κ and is measured in watts per meter kelvin (W/m·K). Thermal conductivity is an important property in applications such as heat transfer, insulation, and thermal management.

Factors Affecting Thermal Conductivity

The thermal conductivity of a material can be influenced by several factors, including:

  1. Atomic/Molecular Structure: The arrangement and bonding of atoms or molecules in a material can affect its ability to conduct heat.
  2. Phase Changes: Thermal conductivity can change abruptly when a material undergoes a phase change, such as the transition from solid to liquid.
  3. Temperature: The thermal conductivity of a material can vary with temperature, often increasing or decreasing as the temperature changes.
  4. Porosity and Defects: The presence of pores, voids, or other structural defects in a material can significantly reduce its thermal conductivity.

Measuring Thermal Conductivity

Thermal conductivity can be measured using various techniques, such as:

  1. Steady-State Methods: These methods, like the guarded hot plate or the heat flow meter, measure the heat flux through a sample under steady-state conditions.
  2. Transient Methods: These methods, like the hot wire or the laser flash, measure the temperature response of a sample to a transient heat input.
  3. Comparative Methods: These methods, like the divided bar or the thermal comparator, compare the thermal conductivity of a sample to a reference material.

Electrical Conductivity

Electrical conductivity is a measure of a material’s ability to conduct electricity. It is denoted by the symbol σ and is measured in siemens per meter (S/m). Electrical conductivity is a crucial property in various applications, such as electronics, energy storage, and electrical power transmission.

Factors Affecting Electrical Conductivity

The electrical conductivity of a material can be influenced by several factors, including:

  1. Atomic/Molecular Structure: The arrangement and bonding of atoms or molecules in a material can affect the mobility and concentration of charge carriers, which determines the electrical conductivity.
  2. Impurities and Defects: The presence of impurities or structural defects in a material can either increase or decrease its electrical conductivity, depending on their effect on charge carrier mobility and concentration.
  3. Temperature: The electrical conductivity of a material can vary with temperature, often decreasing as the temperature increases due to increased scattering of charge carriers.
  4. Applied Electric Field: The application of an external electric field can affect the movement of charge carriers, leading to changes in the material’s electrical conductivity.

Measuring Electrical Conductivity

Electrical conductivity can be measured using various techniques, such as:

  1. Four-Point Probe Method: This method uses four probes to measure the voltage drop across a sample while a known current is applied, allowing the calculation of the material’s electrical conductivity.
  2. Van der Pauw Method: This method uses a simple sample geometry and four contacts to determine the sheet resistance and, subsequently, the electrical conductivity of a material.
  3. Impedance Spectroscopy: This technique measures the impedance of a material over a range of frequencies, providing information about its electrical properties, including conductivity.

Conductivity Data and Applications

Conductivity data, both thermal and electrical, is essential for a wide range of applications, including:

  1. Materials Selection: Knowing the conductivity of a material is crucial in selecting the appropriate material for applications such as heat sinks, electrical wiring, and thermal insulation.
  2. Device Design: Conductivity data is used in the design of various devices, such as electronic circuits, heat exchangers, and thermoelectric generators.
  3. Energy Efficiency: Conductivity properties play a significant role in the development of energy-efficient systems, such as building insulation, refrigeration, and power transmission.
  4. Characterization and Identification: Conductivity measurements can be used to characterize the properties of materials and identify unknown substances.

Numerical Examples and Data

To illustrate the concepts of melting point and conductivity, let’s consider some numerical examples and data:

Melting Point Examples

  1. Copper (Cu): The melting point of pure copper is 1,084.62°C (1,983.32°F).
  2. Water (H2O): The melting point of water at standard atmospheric pressure is 0°C (32°F).
  3. Sodium Chloride (NaCl): The melting point of pure sodium chloride (table salt) is 801°C (1,474°F).

Thermal Conductivity Examples

  1. Copper (Cu): The thermal conductivity of pure copper at 20°C is 401 W/m·K.
  2. Water (H2O): The thermal conductivity of water at 20°C is 0.598 W/m·K.
  3. Polystyrene Foam: The thermal conductivity of polystyrene foam at 20°C is approximately 0.035 W/m·K.

Electrical Conductivity Examples

  1. Copper (Cu): The electrical conductivity of pure copper at 20°C is approximately 59.6 MS/m (megasiemens per meter).
  2. Aluminum (Al): The electrical conductivity of pure aluminum at 20°C is approximately 37.8 MS/m.
  3. Glass: The electrical conductivity of glass is typically in the range of 10^-12 to 10^-8 S/m, depending on the glass composition.

These examples demonstrate the wide range of melting point and conductivity values for different materials, highlighting the importance of understanding and applying these properties in various scientific and engineering applications.

Conclusion

Melting point and conductivity are fundamental physical properties that play a crucial role in the understanding and application of materials. This comprehensive guide has explored the principles, measurement techniques, and practical implications of these properties, providing a valuable resource for physics students and professionals.

By mastering the concepts of melting point and conductivity, you can gain a deeper understanding of material behavior, optimize the design and performance of various systems, and contribute to the advancement of scientific and technological innovations.

References

  1. Chem. LibreTexts. (2023-07-07). Properties of Matter – Chemistry LibreTexts. Retrieved from https://chem.libretexts.org/Bookshelves/General_Chemistry/Map:_Chemistry_-_The_Central_Science_(Brown_et_al.)/01:_Introduction_-_Matter_and_Measurement/1.03:_Properties_of_Matter
  2. Thermtest. (n.d.). Thermal Conductivity – What It Is and It’s Formula – Thermtest. Retrieved from https://thermtest.com/what-is-thermal-conductivity
  3. Cerritos College. (Summer 2017). ELECTRICAL CONDUCTIVITY. Retrieved from https://www.cerritos.edu/chemistry/_includes/docs/Chem_111/Lab/Exp11_ELECTRICAL.CONDUCTIVITY.Sum17.pdf
  4. Callister, W. D., & Rethwisch, D. G. (2020). Materials Science and Engineering: An Introduction (10th ed.). Wiley.
  5. Incropera, F. P., Dewitt, D. P., Bergman, T. L., & Lavine, A. S. (2007). Fundamentals of Heat and Mass Transfer (6th ed.). Wiley.
  6. Kittel, C. (2005). Introduction to Solid State Physics (8th ed.). Wiley.

Gravitational Potential Energy To Mechanical Energy: How to Convert,When,Where,Examples And Facts

Any object at rest possessing energy due to virtue of its position under the influence of gravitational force is called gravitational potential energy.

From the law of energy conservation, conversion of gravitational potential energy to mechanical energy involves accelerating the stationary body to do work. So in this post, you will get to know more about the conversion of gravitational potential energy to mechanical energy and the facts.

The mechanical work can be in the form of either kinetic or potential energy.

How are gravitational potential and Mechanical energy related?

The first law of thermodynamics describes how energy can be transformed from one form to another. It is sufficient to know the relation between gravitational potential energy and mechanical energy.

The mass of the object and at what height the object is placed above the ground level describes the gravitational potential energy. When the mass and height of the object increase, the gravitational potential energy on the object is more; when it is released from a maximum height, the velocity acquired by the object will be more; thus, mechanical energy is also more.

This means that gravitational potential energy and mechanical energy possesses linear proportionality relation.

How is gravitational potential energy converted to Mechanical energy?

Work-energy theorem always specifies the mechanical work done on the system by transforming energy. Using this principle, the gravitational potential energy is converted into mechanical energy.

Objects in air possess maximum gravitational energy stored inside the object. When it is made to fall, the stored energy is released and ready to do work by acquiring mechanical energy.

File:Falling body.svg - Wikimedia Commons gravitational potential energy to mechanical energy
Falling body converting gravitational potential energy to mechanical energy
Image credits: Wikimedia commons

When gravitational potential energy is converted to Mechanical energy?

Any object does not move until any external force triggers them.

Suppose an object is kept at a certain height; the object possesses maximum gravitational potential energy. If any external force is exerted on them, they will begin to fall by releasing their stored potential energy by gravity. The falling object possesses kinetic energy.

The kinetic energy acquired by the object is the work exerted on the object, thus, converting gravitational potential energy to mechanical energy.

Where is gravitational potential energy converted to Mechanical energy?

The gravitational potential rises as there is an increase in height. So when the object is kept at maximum height, there are more chances of gaining maximum mechanical energy.

As the height increases, the gravity pulling the downward object increases. This increase in the exertion of gravity on the object makes them accelerate by gaining kinetic energy. An increase in the velocity makes the object transfer its stored potential energy. This transferred potential energy is mechanical energy.

Gravitational potential energy to Mechanical energy formula

When the conversion of gravitational potential energy to mechanical energy occurs, the body begins to move, possessing kinetic energy. The sum of this kinetic energy and gravitational potential energy is the mechanical energy possessed by the body.

The equation U=mgh gives the gravitational potential energy of a body, where m is the body’s mass, g is the gravitational force, and h is the height.

The kinetic energy is given by K=1/2mv2 where m is mass and v is velocity. The mechanical energy due to gravitational potential energy is given by

E=U+K; this expression describes the relation between gravitational potential energy and mechanical energy.

Gravitational potential energy to Mechanical energy efficiency

The efficiency of converting gravitational potential energy to mechanical energy involves a very less amount of gravitational energy to do maximum work. The formula is given as follows;

gif

Eout is the converted energy, and Ein is the initial form of energy.

Since mechanical energy is nothing but the sum of kinetic and gravitational potential energy, which is also known as the system’s total energy. So the equation can be written as

gif

Gravitational potential energy to Mechanical energy examples

Waterfalls

Before falling from a cliff, water possesses gravitational potential energy; as it falls, it possesses kinetic energy. The sum of these two energy possessed by water is mechanical energy.

Wrecking ball

The wrecking ball is used to demolish the large buildings. At the height above from ground, the ball has gravitational potential energy; it does the mechanical work on the building when it is dropped.

Ripen fruits on the tree

A ripen fruit before falling possesses gravitational potential energy. When it is about to fall, the potential energy is converted into mechanical energy.

Roller coaster

A Roller coaster ride combines gravitational potential energy and kinetic energy. Some mechanical work is done on the car chair, which is responsible for the car’s motion.

Pendulum

The pendulum possesses gravitational potential energy before swinging. This energy is converted into mechanical energy as it begins to swing.

Raised weights

Due to height, a raised weight possesses gravitational potential energy. When it is pulled down, the mechanical energy comes into action.

Flight of aeroplane

Aeroplanes can efficiently fly in the sky due to the conversion of gravitational potential energy to mechanical energy.

Ferris wheel

The lifting and falling of the cabin of the Ferris wheel are due to the conversion of gravitational potential energy to mechanical energy.

Bounced ball

When a ball is bounced at a certain height, it possesses gravitational potential energy. While bouncing back, the speed of the ball is increased by converting it into mechanical energy.

Swings

While playing swings, everyone experiences maximum speed while moving from a greater height toward ground level. This is due to the conversion of gravitational potential energy to mechanical energy.

Vehicles at the top of the hill

If you park your vehicles at the top of the hill, it has maximum gravitational potential energy. This is converted into kinetic energy while moving down. The action of kinetic energy is carried by mechanical energy.

Hydraulic turbines

Water falling from a certain height causes the turbine to rotate. Initially, the water possesses gravitational potential energy, which works on the turbine to do mechanical action.

Weighing scale

The balancing action of traditional weighing scale involves the conversion of gravitational potential energy to mechanical energy.

Slides in park

Because of virtue of height, the kid at the top of the slide possesses gravitational potential energy. As he slides down, it begins to accelerate, which is the form of mechanical energy.

Gravitron

A gravitron works on centrifugal force and the zero-gravity principle employed in an amusement park. When the graviton begins to accelerate, the gravitational potential energy is converted into mechanical energy to do work and prevent the person from falling.

Conclusion

From this post, we get to know that conversion of gravitational potential energy to mechanical energy takes place through producing kinetic energy.

Also Read: