Characteristics of Function Graphs
Characteristics of Function Graphs, this article will discuss the concept of graphical presentation of functions in addition to the value of a variable present in a function. So that the readers can easily understand the methodology.
Which graph represents the functions f(X) = |x-2| – 1 ?
One look at the right hand side expression makes us wonder, what are those two bars around -2 ? Well those bars are the notation for a very special function in mathematics, known as the modulus function or the absolute value function. This function is so important in function theory that it is worth a few words on its origin.
Let us say we are to decide the time required to go from one city to another. In this case, won’t we only be interested in the distance between the two cities? Will the direction be of any importance? Similarly, in the study of calculus, we are often required to analyze the closeness of two numbers, which is the absolute value of their difference. We don’t care if the difference is positive or negative. German mathematician Karl Weierstrass was the one who realized the necessity of a function which would express the absolute value of a number. In the year 1841, Weierstrass defined the Modulus function and used the two bars as its symbol.
f(x) = x for all x>0
=-x for all x<0
= 0 for x=0
Abbreviated as f(x) = |x|
From the definition, it is clear that this function does not have any effect on a positive number. It however changes a negative number to a positive number having the same absolute value. Hence
|5| = 5
7-2 = 5
|-5| = 5
|2-7| = 5
To draw the graph of |x|, we should start with the graph of f(x) = x which simply is a straight line through the origin, inclined at 45 degrees to the positive side of the X axis
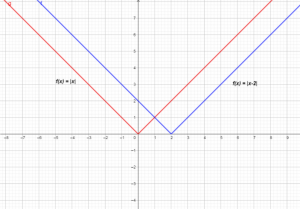
It can be said that the upper half of this graph will be retained by f(x) = |x| as this function doesn’t change positive numbers. The lower half of the graph, however, has to change side, because |x| must always be positive. So, all the points on the lower half of f(x)=x will now be replaced on the upper half, keeping the same distance from the X axis. In other words, the entire LEFT HALF OF f(x) = |x| IS ACTUALLY THE REFLECTION OF THE LOWER HALF OF f(x) = x about the X axis.

In the above figure, the right half shows the graphs of |x| and x superimposed, while the left half shows one as the reflection of another. It is essential to note that this technique may be stretched to any function. In other words, it is easy to imagine the graph of |f(x)| if we already know the graph of f(x). Replacing the lower half with its reflection about the X axis is the key.
Now we know how to plot |x|. But our original problem demands the plot of |x-2|. Well, this is nothing but a shift of origin from (0,0) to (2,0) as it simply decreases the X reading of all points by 2 units, thus transforming f(x) into f(x-2).
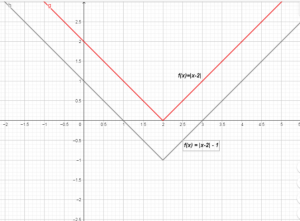
Now the -1 is the only remaining thing to be taken care of. It means subtracting 1 from all points on |x-2|. In other words, it means pulling the graph vertically down by 1 unit. So, the new vertex would be (2,-1) instead of (2,0)
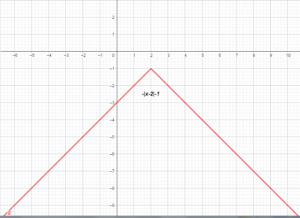
Which graph represents the functions f(X)= -|x-2| – 1 ?
Well, that should be quite easy after the analysis we just did. The only difference here is a minus sign before |x-2|. The minus sign simply inverts the graph of |x-2| with respect to the X axis. So, we can restart the previous problem just after the point where we had graph of |x-2|. But, this time before considering the -1, we shall invert the graph.

After this, we shall drag it down by one unit to incorporate the -1. And it is done.
The graph of a function must be linear if it has what characteristic?
What is a straight line? Normally it is defined as the minimum distance between two points on a plane surface. But it can also be defined from another angle. Since the X-Y plane is a collection of points, we can consider any line on this plane to be the locus or trace of a moving point, or a point whose X,Y co-ordinates are changing.
Moving along a straight line implies that the movement is happening without a change in direction. In other words, if a point starts moving from a given point and moves only in one given direction, then it is said to be following a straight line. So, if we are to express the linear graph as a function, then we must find an equation for the constant direction condition.
But how to express direction mathematically? Well, as we already have two axes of reference in the X-Y plane, a direction of a line may be expressed by the angle it makes with any of the two axes. So, let us assume that a straight line is inclined at an angle α. But that would mean a family of parallel lines and not just a single one. So, α cannot be the only parameter to a line.

Note that the lines differ only in their Y intercept. The Y intercept is the distance from the origin of the point where the line meets the Y axis. Let us call this parameter, C. So, we have two parameters, α and C. Now, let us try to derive the equation of the line.
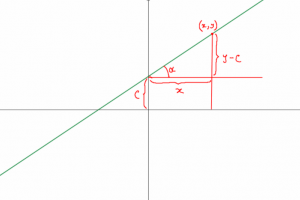
From the figure it should be clear from the right triangle, that for any point (x,y) on the line the governing condition has to be
(y-c)/x = tanα.
⟹ y = xtanα + c
⟹y = mx + c where m=tanα
Hence, any equation of the form y=ax+b must represent a straight line. In other words f(x) = ax + b is the desired form of a function in order to be linear.
The same can be derived also from the conventional definition of a straight line which states that a line is the shortest path between two points on a plane surface. So, let (x1,y1) and (x2,y2) be two points on a straight line.
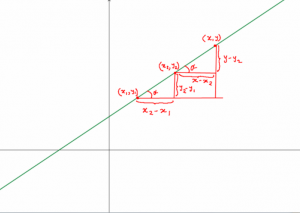
For any other point on the line, a condition can be derived by equating the slopes of the two line segments formed by the three points as the line must maintain it s slope at all segments. Hence the equation
(y-y1)/(x-x1)= (y2-y1)/(x2-x1)
⟹y(x2-x1) + x(y1-y2) + (x1y2-y1x2) = 0
This equation is of the form Ax + By + C = 0 which may be written in the form, y=ax+b, which we know as the form of a linear function.
Which graph is used to show change in a provided variable when a second variable is changed?
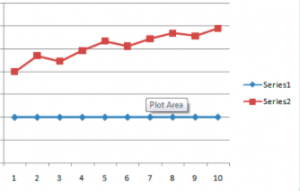
To draw an ideal graph of a function, we would need either a definite algebraic expression or infinite number of data points. In real life, both are not available most of the times. The data we have is scattered. In other words, we may have a list of (x,y) points which may be plotted on the graph, but the points may not be very densely located. But we have to connect those points anyways, as there is no other way to look at the pattern or the trend of the variables. A graph thus obtained is known as a line graph.
It is so named because neighboring points are joined with straight lines. This graph is best suited for illustrating a connection between two variables where one is depending on the other and are both changing. Time-series graphs are examples of line-graph where the X axis represents time in units of hours/days/months/years and the Y axis represents the variable whose value changes over time.
| Sales | 2010 | 2011 | 2012 | 2013 | 2014 | 2015 | 2016 | 2017 | 2018 | 2019 |
| Year | 4000 | 4700 | 4450 | 4920 | 5340 | 5120 | 5450 | 5680 | 5560 | 5900 |
Periodic function
When the dependant variable repeats its value at a definite period or interval of the independent variable, the function is called periodic. The interval is called the period or fundamental period, sometimes as basic period or prime period also. The criteria for a function to be periodic is for some real constant T, f(x+T) = f(x). Which means f(x) is repeating its value after every T units of x. We may note the value of the function at any point, and we will find the same value at T units right and left to that point. That is the characteristic of a periodic function.
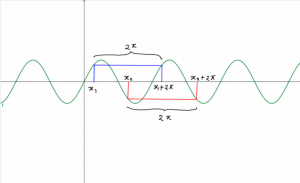
The above figure depicts the periodic behavior of Sinx. We take two random values of x, as x1 and x2 and draw lines parallel to the x axis from sin(x1) and sin(x2). We note that both the lines meet the graph again at a distance of exactly 2π. Hence the period of Sinx is 2π. So we can write sin(x+2 π) = sinx for any x. The other trigonometric functions are also periodic. Cosine has the same period as Sin and so do Cosec and Sec. Tan has a period π and so does Cot.
Which term gives the number of cycles of a periodic function that happen in one horizontal unit?
One full period is called a cycle. So, there is exactly one cycle in T units of x. Hence there are 1/T cycles in one unit of x. The number 1/T is of particular significance in the study of periodic functions since it tells how frequently the function is repeating its values. Hence the term ‘frequency’ is assigned to the number 1/T. Frequency is denoted by ‘f’, which is not to be confused with the ‘f’ of function The higher the frequency the more number of cycles are there per unit. Frequency and period are inversely proportional to each other, related as f = 1/T or T = 1/f. For Sin(X), the period is 2π, so frequency would be 1/2π.
Examples:
- Calculate the period and frequency of Sin(3x)
As Sin(x) has one cycle in 2π, Sin(3x) will have 3 cycles in 2π as x progresses 3 times faster in Sin(3x). So frequency would be 3 times that of Sin(x) , that is 3/2π. That makes the period 1/(3/2π) = 2π/3
- Calculate the period of Sin2x+sin3x
Note that any integer multiple of the fundamental period is also a period. In this problem, there are two components of the function. First has a period of π and the second one 2π/3. But these two are different, so neither can be the period of the composite function. But whatever is the period of the composition, it has to be a period of the components also. So, it has to be a common integer multiple to both of them. But there could be infinitely many of those. Hence the fundamental period would be the least common multiple of the periods of the components. In this problem that is Lcm(π,2π/3) = 2π

- Calculate the period of (Sin2x + Sin5x)/(Sin3x + Sin4x)
It is trivial but quite interesting to observe that the rule that we invented in the previous problem, does actually apply for any composition of periodic functions. So, in this case also the effective period would be the LCM of the periods of the components. That is LCM(π,2π/5,2π/3, π/2) = 2π
- Calculate the period of Sinx + sin πx
At first, it seems obvious that the period should be LCM(2π,2), but then we realize that such a number does not exist as 2π is irrational so are its multiples and 2 is rational and so are its multiples. So, there could be no common integer multiple to these two numbers. Hence, this function is not periodic.
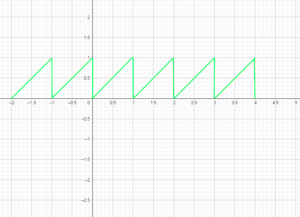
The fractional part function {x} is periodic.
f(x)={x}
This is known as the fractional part function. It leaves the greatest integer portion of a real number and leaves out only the fractional part. So, its value is always between 0 and 1 but never equal to 1. That graph should make it clear that it has a period 1.
CONCLUSION
So far we discussed the Characteristics of Function Graphs. We should be now clear on the Characteristics and different types of graphs. We also had a idea of graphical interpretation of functions. Next article will be covering a lot more detail on concepts such as range and domain, inverse functions, various functions and their graphs, and a lot of worked out problems. To go deeper into the study, you are encouraged to read below
Calculus by Michael Spivak.
Algebra by Michael Artin.
For more mathematics article, please click here.

The lambdageeksScience Core SME Team is a group of experienced subject matter experts from diverse scientific and technical fields including Physics, Chemistry, Technology,Electronics & Electrical Engineering, Automotive, Mechanical Engineering. Our team collaborates to create high-quality, well-researched articles on a wide range of science and technology topics for the lambdageeks.com website.
All Our Senior SME are having more than 7 Years of experience in the respective fields . They are either Working Industry Professionals or assocaited With different Universities. Refer Our Authors Page to get to know About our Core SMEs.
