Shear Strain Vs Shear Stress: Comparative Analysis And Exhaustive Facts

Stress and strain are key mechanical properties affecting how materials change under force. Stress is the force per unit area applied to a material, strain is the resulting deformation. These two concepts are closely linked.

When a force is applied, stress occurs. It’s proportional to deformation and can be calculated using Hooke’s law – stress is directly proportional to strain within the elastic limit of the material. This is shown graphically as a stress-strain curve.

Strain is the relative change in size or shape of an object due to stress. It’s a dimensionless quantity and can be expressed in terms of axial, shear, or volumetric strain. Axial strain is elongation or compression, shear is when layers slide past each other, and volumetric change in volume.

Every material has its own mechanical properties determining how it responds to stress and strain. This includes the modulus of elasticity, yield strength, and ultimate tensile strength.

What is stress?

Stress is the amount of load experienced by the material per unit cross sectional area. To find the magnitude to stress, we need the magnitude of force and the cross sectional area of the material on which stress is applied.

Stress is of many types- Normal stress, shear stress and volumetric stress. We will discuss about types of stresses in further section of this article.

What is strain?

Strain is the ratio of change in length to the original length of the work piece. The change in length occurs as a result of stress applied to the work piece.

Strain shows the amount of change in dimensions of the material in terms of percentage. Mathematically, strain can be given as-

where,

epsilon is the strain

l is the original length of work piece

Shear strain vs shear stress

Stress and strain are two different concepts in material science. Stress is the force per unit area applied to an object, while a strain is the deformation caused by stress. In other words, stress is how much force is being applied and strain is how the object responds to that force.

To better understand the difference between stress and strain, take a look at this table:

Stress Strain
Definition Force per unit area applied to an object. Deformation experienced by an object due to stress.
Measurement Pressure or force per unit area. Elongation, compression, or torsion tests.
Types Tensile stress, compressive stress, shear stress, etc. Tensile strain, compressive strain, shear strain, etc.
Effect Causes structural failure or deformation in materials. Shows how well a material can handle external loads.

It’s important to note that stress can be either positive (tension) or negative (compression). The same holds true for strain, which can have positive (elongation) or negative (contraction) values.

To really understand stress and strain, you need to know their relationship and how they impact different materials. To learn more, read our comprehensive material science and engineering articles. Discover the powerful forces that shape our world!

Relationship Between Stress and Strain

Stress and strain are key concepts in materials science and engineering. Stress is the force applied to a material, while a strain is the deformation or change in shape that results. To understand how stress and strain work together, let us consider a metal rod as an example. When a force is applied, it experiences stress which then causes the rod to deform, resulting in strain. This relationship is quantified by Young’s modulus, the ratio of stress to strain, also known as the modulus of elasticity.

By measuring the amount of stress and strain, engineers can determine the material’s Young’s modulus. This knowledge is significant for constructing structures that can bear loads without deforming.

Furthermore, understanding stress and strain allows us to analyze material behavior beyond the elastic limit. Excessive stress or deformation can cause plastic behavior or fracture. By examining how stresses and strains form under different conditions, researchers can gain insight into failure mechanisms and enhance material performance.

Don’t miss out on grasping this fundamental concept – it is vital for many engineering applications. So whether you’re designing buildings or creating advanced materials for aerospace, a good grasp of stress and strain is essential. Start exploring this exciting field now and uncover the secrets of the relationship between stress and strain!

Types of Stress

XFwnQDmVUql2 yy H9fRkgNBIq7qWxlzPp3G8nJEmpSY6IFAelgNHvKJciySHLpJc5NolS56C4CX vBhjWxXHLzPpMQ7TWYvgUQa9bNJqR2rUomEtYsWqd wQNPQt8

To understand the different types of stress, let’s delve into the world of mechanical properties. In order to distinguish between stress and strain, we need to explore their definitions and characteristics. Within this section, we will focus on three key sub-sections: tensile stress, compressive stress, and shear stress. Each one plays a unique role in determining the behavior of materials under different loading conditions.

Tensile Stress

Tensile stress is a pulling force that can cause a material to stretch or elongate. It is commonly seen in structures such as bridges and buildings, and everyday items like ropes and cables.

The elastic limit of a material indicates the maximum amount of stress it can withstand without permanent deformation. Tensile strength, on the other hand, is the maximum stress the material can handle before breaking.

For example, steel can take up to 250MPa of stress before deforming, and up to 400MPa of stress before breaking. Aluminum has an elastic limit of 100MPa and a tensile strength of 200MPa. Nylon, meanwhile, can take up to 60MPa of stress without deforming, and 80MPa of stress before breaking.

In a distant mountain village, a bridge of steel stood tall. Despite its exposure to heavy loads and extreme weather conditions, it persevered. One stormy night, a massive tree fell onto the bridge, creating a strong pulling force. However, the bridge did not break. It stretched and flexed under tension, showcasing the remarkable strength of tensile stress. This enabled it to endure, providing safe passage for all who relied on it.

Even rocks know the struggle of compressive stress; it’s like being squeezed into a tight pair of jeans but without the option of unbuttoning them.

Compressive Stress

Compressive Stress has some interesting facts. Check out the table below for key info:

Material Strength Capacity Durability
Steel 250 MPa 500 GPa 30 yrs
Concrete 25 MPa 20 GPa 50 yrs
Wood 7 MPa 12 GPa 100 yrs

The table shows that different materials have different levels of strength, capacity, and durability when exposed to compressive stress. Steel has the highest strength capacity of 250 MPa, concrete has 25 MPa and wood has 7 MPa. The elastic modulus or Young’s modulus measures a material’s ability to resist compression. Steel is the strongest in this regard.

Compressive stress can have real-life impacts. For example, a bridge with concrete columns may suffer from compressive stress due to heavy loads and environmental conditions. This can cause cracks and weaken the structure. This case highlights the importance of understanding compressive stress and its effects on materials.

Shear Stress

Let’s delve into the concept of shear stress. It’s the ratio of shear force to cross-sectional area and measured in Pascal (Pa). Shear stress is used in many fields, such as civil engineering, material science, and fluid dynamics. To give a real-world example, it can be seen when you slide one layer of playing cards over another layer with force applied parallel to the surface.

Shear stress is significant. It affects materials’ strength and stability. Plus, it alters deformation and failure mechanisms. Thus, it is a key factor in engineering designs.

To ensure optimum performance and safety, here are some tips to mitigate shear stress issues:

  1. Choose materials with high shear strength.
  2. Reinforce materials with fibers or bars.
  3. Use appropriate geometries and load distribution techniques.
  4. Do regular inspections to detect excessive shear stress.

Follow these suggestions and engineers can effectively manage shear stress. Moreover, they can guarantee structure and components’ longevity. Understanding shear stress is important in various engineering disciplines. It enables optimal design and functionality.

Types of Strain

NgJcFdqmx6HxuwskKwGOaJF0TchAUmypN4VfxrxvSELqFL2 Kp7cDZDX NuZYfbIsB0 2Bskyv3d7uDBimblyUgWzgxG vfWjArj8OANHmOjOJ6w5gteTRf8bqjVWPNJ GKDeLaRyL2jJWV1pL3nVp4

To understand types of strain – longitudinal, shear, and volumetric strain – we explore how materials deform under different loading conditions. 

A longitudinal strain occurs when an object elongates or compresses along the direction of the applied force. Shear strain denotes the deformation resulting from forces acting parallel but in opposite directions. Volumetric strain describes changes in the material’s volume due to applied forces. These distinct forms of strain provide insights into the mechanical properties of materials.

Longitudinal Strain

Take a peek at this table to have a better grasp of Longitudinal Strain:

Material Strain
Steel 0.002
Aluminum 0.0035
Wood 0.0015
Concrete 0.0012

Each material has a special ability to oppose deformation under exerted forces. Note that the figures are only examples and may change due to various elements such as type of material, composition, and environment.

Longitudinal strain comprehension is important in engineering and construction since it helps engineers understand the behavior of materials when under pressure. Having this information enables them to build structures that can survive expected forces and avoid structural disasters.

Do you want to pursue a career in engineering or construction? Knowing longitudinal strain and its effects can help you become successful in these industries and help make safer construction projects. Don’t miss this opportunity!

Shear strain: For those who love a good twist, this strain will surprise you and leave you wondering if everything is still intact.

Shear Strain

Shear strain is a type of deformation in materials when two forces act in opposite directions. It’s an important concept in mechanics and materials science. Let’s get a better understanding with an example. We have an initial length of 100 cm and a change in length of 5 cm. Divide the change in length by the initial length to get the shear strain (∆L/L).

It’s worth noting that the shape and size of the material don’t affect shear strain. It only depends on the forces applied and the displacement between layers. When calculating shear strain, make sure to use accurate measurements and consider any external factors that may affect the material.

Pro Tip: When it comes to volumetric strain, expanding your horizons is actually a good thing – unless, of course, you’re a balloon and someone hands you a sharp object.

Volumetric Strain

Volumetric strain is when the volume of material changes under stress. It’s a way of measuring how much an object’s shape and size have changed due to external forces. It’s a key concept in materials engineering and is used to analyze material behavior in different conditions.

To understand volumetric strain, let’s look at the table below:

Property Description
Formula Change in vol./original vol.
Unit Unitless
Calculation Ex. If the original vol. is 10 cm³ and the change is 2 cm³, then vol. strain = (2/10) = 0.2
Significance Helps engineers determine material behavior and potential weaknesses

Volumetric strain shows how a material responds to different types and magnitudes of stress. So, engineers can choose materials wisely, design strong structures, and foresee potential failures.

Reminder: When calculating volumetric strain, it’s crucial to use precise measurements for the original volume and the change in volume. Tiny measurement errors can affect the accuracy of your results.

Stress-Strain Curve 

gqNLA

Stress-strain curve

Image Credit-Nicoguaro, Stress strain ductile, CC BY 4.0

To understand the stress-strain curve with its sub-sections, let’s dive into each phase briefly. Beginning with the elastic region, we’ll explore its behavior within the proportional limit. Moving on, we’ll discuss the elastic limit and the significance of the yield point. Then, we’ll examine the characteristics and behavior of the plastic region. Finally, we’ll touch upon the concept of ultimate tensile strength.

Elastic Region

Welcome to the wild world of the Elastic Region! Here, materials can be put under stress and strain, but still return to their original shape when the load is gone. This region follows Hooke’s Law, which states that stress is proportional to strain – and it shows in the stress-strain curve as a straight line with a positive slope.

We measure the stiffness of a material in this region with the modulus of elasticity or Young’s modulus. At a molecular level, this phase is reversible – atoms move apart when a force is applied, and when it’s removed, they shift back to their original positions.

To get a better handle on this concept, let’s take a look at this Table:

Property Description
Stress Proportional to the applied load
Strain Proportional to deformation strain
Modulus of Elasticity Measures stiffness
Yield Point Limit at which permanent deformation begins

This table helps us understand the properties of the Elastic Region – such as stress, strain, and modulus of elasticity.

The history of this phenomenon dates back to 1678 when Robert Hooke conducted experiments on spring mechanics. His findings proved how a spring exhibits proportional deformations within its elastic limits.

To wrap up, materials in the Elastic Region behave elastically according to Hooke’s Law. This knowledge helps us predict material behavior and design structures with enough flexibility and stability.

Proportional Limit

The point where a material stops behaving linearly and starts deforming plastically is known as the proportional limit. At this stage, the stress put on the material is proportional to its strain.

Here is what is seen at the proportional limit:

Property Definition
Stress The force per unit area felt by the material
Strain The measure of deformation experienced by the material
Elasticity The material’s ability to go back to its original shape after deformation
Plasticity The permanent deformation the material experiences when subjected to stresses beyond its elastic limit

Also, materials that are within their elastic limit can go back to their original shape when the stress is removed. But, going beyond this point results in permanent deformations and possibly irreversible damage.

So, understanding and calculating the proportional limit of a material is essential in designing structures and making sure they can withstand external forces without surpassing their capacity. Ignoring this could result in disastrous failures or dangerous working conditions.

To learn more about how materials behave in different scenarios, further analysis and testing are necessary. Learn more about stress-strain curves and gain knowledge on how materials respond to different conditions. Take advantage of uncovering their incredible characteristics!

Elastic Limit

The Elastic Limit is the maximum amount a material can bend before it changes permanently. To show this, here’s a table with materials and their limits:

Material Elastic Limit (MPa)
Steel 250
Alum. 150
Rubber 5

When a material is stressed beyond its Elastic Limit, it goes through a phase called plastic deformation. In this phase, the material can’t return to its original shape after the stress is relieved.

Different materials have different Limits due to their properties and atomic structures. Metals have higher Limits than more flexible materials like rubber.

Tip: Engineers and designers must understand and design within a material’s Elastic Limit, to prevent structural failures and ensure safe performance.

Yield Point

Stress-strain curves feature an important point: the yield point. This is where a material starts to deform plastically under stress, instead of returning to its original shape once the stress is removed. Let’s take a look at the yield point’s significance with a table.

Material Yield Strength (MPa)
Steel 250
Aluminum 150
Titanium 900

As the table shows, different materials have different yield strengths. Steel has a higher yield strength than aluminum and titanium. This means steel can handle more stress before permanently deforming.

The yield point is a big transition in material behavior. Before it, materials usually just have elastic deformation. This means they return to their original shape after the stress is gone. Past the yield point, materials start to have plastic deformation, where the shape changes even when stress is no longer there.

To make sure structures are safe and do their job, it’s important to consider the yield point. Here are some tips to help:

  1. Know Yield Strength: Learn about yield strengths and how they correspond to the intended use. This helps select materials and design structures.
  2. Safety Margins: When designing, think about potential stresses beyond the expected limit. This can stop unforeseen deformations or failures.
  3. Material Testing: Test materials under conditions like what they will experience. This helps determine exact yield points and make sure applications work.

Following these tips helps engineers and designers use yield points to create strong structures that can handle expected stress levels and stay safe. If stress were a superhero, the plastic region would be its alter ego, a flexible and slightly twisted version that likes to push boundaries just for fun!

Plastic Region

The plastic region of a stress-strain curve is the stage where materials undergo permanent deformation after their yield point. Properties like ductility and strain hardening in this region are key for various industries.

Ductility is the ability to deform plastically without breaking. Strain hardening is when a material becomes stronger as it is deformed.

Analyzing the plastic region of stress-strain curves is valuable for engineers. It helps them design structures that can withstand stress and strain.

Uncover how materials behave in the plastic region! Discover new possibilities in design and innovation. Find out how materials reach their breaking point – just like your will to live after a stressful day.

Ultimate Tensile Strength

Know the ultimate tensile strength of materials? It’s essential for engineering design and structural analysis. What is it? It’s the maximum stress endured by a material before it breaks when tested in a tensile testing machine. This test adheres to standards such as ASTM A370.

Need a break from stress? Bend over backward and let the Modulus of Elasticity prove that materials have limits. Unlike your sanity…which has no limits!

Modulus of Elasticity

To understand the concept of modulus of elasticity, let’s explore the relationship between stress and strain in the elastic region. We’ll start by defining the modulus of elasticity, which is a crucial mechanical property that describes a material’s ability to deform under stress. This sub-section will shed light on how stress and strain behave in the elastic region, providing insights into the material’s response to external forces.

Definition of Modulus of Elasticity

Modulus of elasticity is a measure of a material’s ability to stretch or compress when a force is applied. It is the ratio of stress to strain in the elastic region and is used to predict how materials will act under different conditions. It is also the slope of a stress-strain curve during the linear elastic deformation phase. Materials with high modulus values are rigid and less likely to deform, while those with low modulus values are more flexible.

Thomas Young, an English polymath, introduced this concept in the early 19th century. He observed the behavior of different materials under tension and compression, discovering that each has its own stiffness or elasticity.

Bridge engineering is an example of where understanding the modulus of elasticity is important. Engineers must consider load distribution and structural integrity when designing a bridge. By selecting appropriate materials with suitable moduli of elasticity, they can prevent excessive deflection or collapse.

Relationship Between Stress and Strain in Elastic Region

In materials science, understanding stress and strain in the elastic region is key. Let’s explore this connection! Visualize it with a table:

Stress (in Pascals) Strain (unitless)
Increase in stress = proportional increase in strain.

This linear relationship displays a material’s elasticity within its limit of proportionality.

Note that this correlation applies only to linearly elastic materials. These deform reversibly when force stays within limits. Use these insights when assessing a material’s elasticity for structures, mechanical components, and other applications.

Remember, stress-strain behavior can vary across different materials and situations. Consider this when evaluating their viability. Mechanical Properties of Materials: Like a bad relationship, materials can have a breaking point – the modulus of elasticity, the drama queen of science.

Mechanical Properties of Materials

XYnPblQPTRIb0zU6IGK6S7Pk 0UMfaAAqQB0aN0kHRgLuaZe5xhAZKfuw3egfwrAxjqUWu 42Sl0VuSQjqvrzqIXI4IfHqoaPhyoRZtpJkwPAMJEcTtu x0Cr8vej 8XlGp4 wGsNeXyEU2wjPNzry0

To understand the mechanical properties of materials, let’s dive into the section “Mechanical Properties of Materials” and explore the sub-sections: Yield Strength, Ductility, Hardness, Elasticity, and Plasticity. These sub-sections will offer insights into the various characteristics and behaviors of materials, shedding light on their resilience, flexibility, and ability to undergo deformation or retain their shape under external forces.

Yield Strength

Many factors can affect the yield strength of a material – composition, production process, and temperature. To help us understand, let’s look at a table:

Material Yield Strength (MPa)
Steel 250
Aluminum 150
Titanium 900
Copper 200

It’s clear from the table that Titanium has the highest yield strength of 900 MPa, while Aluminum is lower at 150 MPa. This allows engineers to pick materials based on their strength and durability needs.

To increase yield strength, we can consider:

  1. Alloying: Adding elements to the metal can create solid solution strengthening or precipitation hardening, increasing yield strength.
  2. Cold Working: Applying plastic deformation to the material at low temperatures can cause dislocation movement and grain refinement, leading to higher yield strength.
  3. Heat Treatment: Controlling heating and cooling processes can change the microstructure, offering potential to raise yield strength through phase transformation.

Working these suggestions into material selection and production processes will help boost engineering performance and reliability.

Ductility

Ductile materials, such as copper and aluminum, show huge plastic deformation when under tension. They can be drawn into thin wires or rolled into sheets without breaking. Therefore, these materials have great malleability. This enables the production of intricate components in industries like aerospace and automotive.

The ductility of materials is also key for their structural integrity. Ductile elements can absorb energy before failure, making them great for applications that need resilience. Steel, for example, has great ductility, meaning that structures can handle sudden impacts/loads.

To make sure materials have adequate ductility, here are some tips:

  • Reduce impurities: Impurities can hinder plastic deformation, so eliminating them increases ductility.
  • Grain refinement: Smaller grain sizes allow for uniform deformation and restrict dislocation movement, thereby increasing ductility.
  • Temperature control: Heat helps atoms move more freely in the lattice structure, thus improving plastic deformation.

These suggestions work by improving the structure and composition of materials. If impurities and grain size are minimized, the risk of crack initiation is reduced and ductility levels increase. Temperature control ensures better atom mobility within the lattice structure, which promotes plastic deformation without fracture.

Hardness

Let’s take a look at the hardness of different materials. Steel has a hardness of 120-600, aluminum 15-120, copper 30-250, glass 400-800, and diamond has an impressive 7000 on the Brinell scale.

Johan August Brinell, a Swedish engineer, developed a method to measure hardness in the early 1800s. His technique included pressing a steel ball into a metal surface and measuring the indentation. This began the standardization of hardness testing and opened up new possibilities in material science.

Remember, materials with great elasticity can be like running into an ex at the grocery store – they have the ability to snap back at you!

Elasticity

A table displaying materials and their elastic moduli shows us how elasticity works. This modulus tells us how much a material can bend under pressure, then return to its original shape. Here are some examples:

Material Elastic Modulus (GPa)
Steel 200
Aluminum 70
Rubber 0.01

Viscoelasticity is an elasticity that can be seen in fluids like honey or molasses.

Robert Hooke, an English scientist from the 17th century, has helped us understand elasticity better. His law, known as Hooke’s Law, tells us that a force is directly proportional to the displacement of a spring when it’s being stretched or compressed. This law has helped make many engineering and tech advances.

Note: Plasticity is not about how easily your credit card bends, it’s about a material’s ability to deform without breaking.

Plasticity

Let’s take a deeper look at plasticity. We can see from the table above that stress and strain have nonlinear behavior in polymeric materials, meaning they don’t follow simple equations.

Moreover, temperature, strain rate, and other environmental factors can influence plastic deformation. For instance, some metals become more plastic when heated due to thermal activation processes.

To make materials more pliable, engineers use alloying elements or additives to modify the microstructure and promote dislocation movement. Heat treatment like annealing can also relieve internal stresses and increase ductility.

The Stress-Strain curve is useful for understanding our breaking point and how to be most efficient. It helps us both in engineering and in life.

Shear stress vs shear strain graph

The graph showing the relationship between shear stress and shear strain is called as the shear stress- shear strain curve or shear stress vs shear strain graph.

The graph is shown below-

shear strain vs shear stress
Image: Shear stress Vs Shear strain curve

Image credits: NicoguaroStress strain ductileCC BY 4.0

Here we can see different regions where the curve changes it slope.

  • Region 1 (Up to yield strength)– This is region is the proportionality limit of the material. In this region, the shear strain is directly proportional to the shear stress applied.
  • Region 2 (Up to ultimate strength)-This region determines the ultimate stress of the material. It is the maximum stress that the material can withstand without breaking.
  • Region 3 (Up to fracture)– This region defines the fracture point of the material. Here the material breaks down.

Shear stress vs shear strain curve for mild steel

Mild steel is a ductile material. The shear stress vs shear strain graph for ductile materials is shown in above section.

  • Upper yield strength– It shows the proportionality limit if the material. The shear strain is directly proportional to the shear stress applied.
  • Lower yield strength-This point shows the elastic limit of the material. The material will not regain its original shape if stress is applied beyond this limit.
  • Strain hardening-Beyond this point, the material shows plastic behaviour that is even with slight increase in stress, the strain increases drastically.
  • Fracture-It is the fracture point of the material. At this point the material breaks down.

Shear stress and shear strain in fluid

Anything which has a tendency to flow is called as fluid. Fluids flow in layers. The uppermost layer being the fastest and the lower most layer which is next to the surface slowest.

The shear stress in fluid is given by-

where, tau is the shear stress experienced by fluid.

u is the velocity of the fluid

x is the distance between the layer of fluid and the surface

The shear strain rate in fluid is given by-

Where, phi is the shear strain rate

v is the velocity of fluid in Y plane

u is the velocity of fluid in X plane

How do you relate shear stress and shear strain

Shear strain and shear stress are related to each other. Shear strain is the result of application of shear stress on the workpiece.

Mathematically, both related by the equation given below-

where,

G is shear modulus of rigidity

Tau is shear stress

Phi is shear strain

Applications of Stress-Strain Curve

To better understand the applications of the stress-strain curve, let’s explore how it influences material selection and structural design. By examining these two sub-sections, we can gain insights into the practical implications of stress and strain on different materials and the considerations involved in creating sturdy and efficient structures.

Material Selection

Material Properties and Performance Requirements must be considered when making a selection. Strength, Toughness, Elasticity, and Ductility are all taken into account. Cost, availability, and compatibility with manufacturing processes also play an important role. The material should be able to handle the stress without excessive deformation or failure, so reliability and durability are key.

Material selection is not a one-size-fits-all approach. Different industries and applications have unique requirements, leading to varied choices of materials. For example, the aerospace industry prioritizes lightweight materials with high strength-to-weight ratios.

The journal article “Materials Selection for Biomedical Devices: Case Studies” emphasizes the importance of careful material selection in biomedical device design. This ensures compatibility with human tissues and minimizes adverse reactions. So, Jenga-like, the wrong move could lead to architectural disaster – choose wisely!

Structural Design

Structural Design involves selecting materials based on strength, durability, and cost. It also requires calculating the forces on a structure and making sure it won’t collapse or deform.

Moreover, engineers consider environmental conditions (e.g. wind or earthquakes) and functional needs (e.g. occupant comfort). They use computer-aided design to model how a structure will perform.

Structural engineers collaborate with architects and other professionals to make sure the final structure meets safety codes. Moreover, they continually innovate to keep up with advancing technologies.

As an example, when designing a high-rise building in an earthquake-prone area, the engineer analyzed data, ran simulations, and consulted seismologists. The result was a structure that could handle even severe seismic activity while keeping its function and looks.

To conclude, Structural Design is essential for our built environment. Through careful analysis and innovative solutions, engineers create structures that are safe, sustainable, and aesthetically pleasing.

Conclusion

Stress and strain are integral concepts in the world of mechanical properties of materials. Stress is a force/area and strain is a change in shape because of it. The relationship between them is described by a stress-strain curve.

Different types of stress include tensile, compressive, and shear. Different types of strain are longitudinal, shear, and volumetric.

Importantly, stress and strain are proportional until the proportional limit or elastic limit. After this, the material may not come back to its original shape – this is plastic behavior. The yield point is where this happens. Elasticity is the ability to return to its original shape.

Stress is measured in units like pascals and pounds per square inch. Strain is a percentage or decimal.

The mechanical behavior and performance of materials depend on understanding stress and strain. The stress-strain relationship of a material reveals its strength, ductility, elasticity, and other mechanical properties.

Pro Tip: When interpreting a stress-strain curve, pay attention to values like yield strength (the max stress for plastic behavior) and ultimate tensile strength (the max stress before failure). This information gives insight into a material’s performance.

Frequently Asked Questions

Q: What is the difference between stress and strain?

A: Stress is the force per unit area while strain is the deformation that a material undergoes due to stress. Stress is the cause, while strain is the effect.

Q: What is a strain curve?

A: A strain curve shows the relationship between stress and strain for a particular material. It is used to determine the material’s behavior when subjected to external forces.

Q: What is deformation?

A: Deformation refers to the change in the shape or size of a material due to the application of a deforming force.

Q: How is strain defined?

A: Strain is defined as the change in length or volume of a material per unit of its original length or volume.

Q: What is the perpendicular area of the object?

A: The perpendicular area of an object is the area of the cross-section of the material that is perpendicular to the direction of force.

Q: How do you determine stress and strain?

A: Stress is determined by dividing the applied force by the area of the material, while strain is determined by dividing the change in length by the original length of the material.

Q: What is the proportionality limit?

A: The proportionality limit is the point beyond which stress is no longer directly proportional to strain, and the material starts to exhibit plastic deformation.

Q: What is the yield point of a material?

A: The yield point of a material is the stress point beyond which the material exhibits significant plastic deformation or permanent deformation.

Q: What is the difference between elastic and plastic deformation?

A: Elastic deformation is temporary, and the material returns to its original shape after the force is removed. Plastic deformation is permanent, and the material does not return to its original shape after the force is removed.

Q: How do you draw a graph of stress versus strain?

A: The stress is plotted on the y-axis, and strain is plotted on the x-axis. The resulting curve is the strain curve for the material.

Q: What is the neck of a material?

A: The neck of a material is the region where it undergoes the largest deformation when subjected to a deforming force.
Reversible Adiabatic Expansion: Process,Formula,Work,Example And Exhaustive FACTS

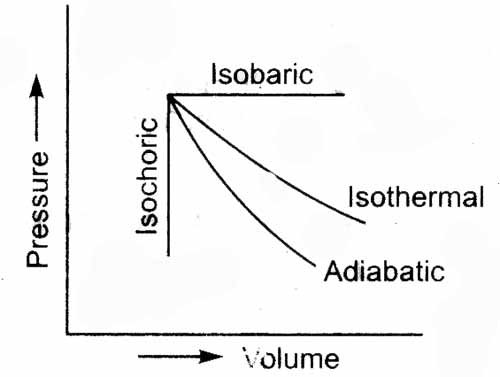
Adiabatic.svg 300x258 1

This article discusses about reversible adiabatic expansion in detail. An adiabatic process is a process in which the heat transfer across the walls of system does not take place.

Reversible process are those processes which are ideal. One can trace back the entire path which was followed by the working fluid that means if a process 1-2 takes place then it can go from 2-1 following the same path. This means that there are no losses inside the system.

What is reversible adiabatic expansion?

As discussed above, reversible processes are ideal processes and adiabatic processes are those in which heat transfer does not take place. Reversible processes are infinitesimally slow that is in a piston cylinder arrangement, the piston moves at a very slow speed such that it appears stationary.

Reversible adiabatic expansion is the process in which the volume of the gas expands or increases after the process is completed. The temperature of the working fluid or the system decreases as a result of expansion.

Reversible adiabatic expansion formula

The formula for adiabatic expansion shows the relationship between volume and temperature. The temperature reduces with increase in volume.

The formula is given below-

T2-T1 = (V1/V2)γ-1/γ

Reversible adiabatic expansion temperature

The temperature decreases with increase in volume. Hence, in reversible adiabatic expansion process the temperature decreases.

The temperature in reversible adiabatic expansion process decreases with increase in volume. The relationship between volume and temperature is discussed above sections.

Reversible adiabatic expansion entropy

Entropy is the measure of randomness or degree of disorder. It is a very important quantity in thermodynamics. The efficiency or quality of any thermodynamic cycle depends on entropy.

In reversible adiabatic expansion, the entropy of the system is zero. For any reversible adiabatic process, the entropy of the system remains zero.

Reversible adiabatic expansion of an ideal gas

A gas is considered ideal when it is frictionless and incurs no losses while any thermodynamic process is taking place. While dealing with problems in thermodynamics, the gas is usually considered ideal for easy calculations.

The important formulae relating to ideal gas when it undergoes reversible adiabatic expansion are given below-

T2-T1 = (V1/V2)γ-1/γ

and for pressure-temperature relationship,

T2-T1 = (P2/P1)γ-1/γ

Reversible adiabatic expansion of a real gas

A real gas is non ideal in nature that is they do not obey the ideal gas laws. They show compressible effects, they are not frictionless, they have variable specific heat capacities etc. Hence, the work done by a real gas is always lesser than work done by ideal gas.

Van Der Wall’s equation for a real gas is given below-

(p + an2/V2)(V – nb) = nRT

Clearly the work obtained while doing reversible adiabatic expansion of real gas is much lower than that obtained from ideal gas.

Assumptions made for ideal gas

A gas can never be ideal. All gases are real in some or the other way. Although, some assumptions can be made regarding an ideal gas which helps us get an idea of how ideal a particular gas is. The assumptions made for ideal gas are given below-

  • Zero inter particle interactions– The gas atoms don’t collide with each other.
  • Frictionless– The gas won’t be affected by friction in its entire course of thermodynamic process.
  • Incompressible– The density of the gas remains constant throughout, it does not change with change in surrounding pressure or temperature.
  • Tends to fail at lower temperatures and high pressures– This happens because the inter molecular interactions become significant at this stage.

In practical situations, all the gases are ideal in nature and the closest gas to ideal gas is Helium gas due to its inert nature.

Characteristics of a real gas

The characteristics of the real gas are everything that is not ideal in nature. This happens due to inter molecular interactions, friction and other variable. The characteristics of ideal gas are as follows-

  • Compressible– The real gases are compressible meaning their density can be changed.
  • Variable heat capacity– Their heat capacities are not constant, they can change with change in surroundings.
  • Van Der Walls forces– These forces arise due to distance dependent interaction between the molecules. In the for formula for real gas, there is a correction factor for both pressure and volume effects.
  • Non equilibrium thermodynamic effects.

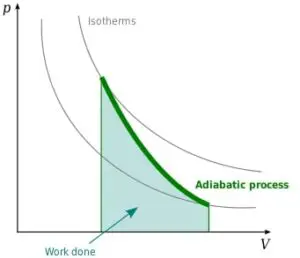
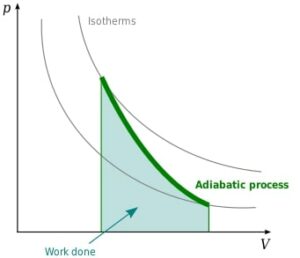
Work done in reversible adiabatic process

The heat transfer is zero in reversible adiabatic process. So the work is not transferred in the form of heat but change in volume.

The formula representing the work done in a reversible adiabatic process is given below-

W = nR(T1-T2)/γ-1

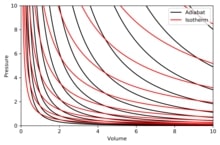
reversible adiabatic expansion
Image: Work done in adiabatic process

Image credits: User:StanneredAdiabaticCC BY-SA 3.0

Reversible adiabatic expansion enthalpy

Enthalpy is a function of heat. It changes with the amount of heat transfer taking place.

Enthalpy depends on the rate of heat transfer taking place. Since, in an adiabatic process, the change in heat content is zero so the enthalpy change is also zero.

Reversible adiabatic expansion final temperature

During an adiabatic expansion process, the final temperature is always lesser than the initial temperature as a result of expansion process.

The final temperature can be calculated from the temperature-volume relationship given below-

T2/T1 = (V1/V2)γ-1/γ

The final temperature can also be calculated from the temperature-pressure relationship given below-

T2/T1 = (p2/p1)γ-1/γ

Reversible adiabatic expansion example

No process is completely reversible or adiabatic, however the closest we can get to reversible adiabatic process is propagation of sound wave in fluids.

In Carnot cycle (again an ideal cycle) uses reversible adiabatic expansion and reversible adiabatic compression for expansion and compression purposes.

Why entropy change for a reversible adiabatic process is zero

The entropy of a system changes if heat content of the system changes. Since, the heat transfer is prohibited by the walls of adiabatic system, the net entropy change is also zero.

Graphically, the properties which form a closed path are zero. That means the starting point and ending points are same. In the case of entropy, since it is following a reversible cycle the entropy gets back to the same path to its original position. Hence, it is zero.

Wet Adiabatic Lapse Rate: Detailed Insight And Facts

Introduction to Wet Adiabatic Lapse Rate

gif

The Wet Adiabatic Lapse Rate is an important concept in meteorology that helps us understand how the temperature of a rising air parcel changes as it ascends through the atmosphere. It is a key factor in determining cloud formation, atmospheric stability, and weather forecasting.

Definition of Wet Adiabatic Lapse Rate

The Wet Adiabatic Lapse Rate (WALR) refers to the rate at which the temperature of a rising air parcel changes when it is saturated with moisture. It is also known as the Saturated Adiabatic Lapse Rate (SALR). Unlike the Dry Adiabatic Lapse Rate (DALR), which applies to unsaturated air parcels, the WALR takes into account the condensation of water vapor and the release of latent heat.

To understand the WALR, we need to first grasp the concept of adiabatic processes. In thermodynamics, an adiabatic process occurs when there is no exchange of heat between a system and its surroundings. When an air parcel rises, it expands due to the decrease in atmospheric pressure. As the parcel expands, it does work on its surroundings, causing its temperature to decrease. This is known as adiabatic cooling.

However, when the air parcel is saturated with moisture, it reaches its condensation level, where the water vapor begins to condense into liquid droplets, releasing latent heat. This latent heat offsets some of the cooling caused by adiabatic expansion, resulting in a slower decrease in temperature compared to the DALR. The WALR is typically around 5 to 9 degrees Celsius per kilometer.

Explanation of the Term “Wet” and “Lapse”

The term “wet” in Wet Adiabatic Lapse Rate refers to the presence of atmospheric moisture in the form of water vapor. As the air parcel rises and cools, it eventually reaches its dew point, which is the temperature at which the air becomes saturated and condensation begins. This condensation leads to the formation of clouds and precipitation.

On the other hand, the term “lapse” refers to the decrease in temperature with increasing altitude. The lapse rate describes the rate at which the temperature changes as we move vertically through the atmosphere. The WALR specifically focuses on the temperature changes of a rising air parcel that is saturated with moisture.

It is important to note that the WALR is not a constant value and can vary depending on factors such as the amount of moisture in the air, the temperature gradient of the environment, and the stability of the atmosphere. Understanding the WALR is crucial for meteorologists in analyzing atmospheric conditions, predicting weather patterns, and assessing the potential for convective instability.

In summary, the Wet Adiabatic Lapse Rate plays a significant role in the formation of clouds, precipitation, and overall atmospheric stability. By considering the effects of moisture and condensation on the temperature changes of rising air parcels, meteorologists can gain valuable insights into weather patterns and make more accurate weather forecasts.

Understanding Moist Adiabatic Lapse Rate

The moist adiabatic lapse rate is an important concept in meteorology that helps us understand the relationship between temperature and altitude in moist air. It plays a crucial role in weather forecasting and the study of atmospheric stability.

Definition of Moist Adiabatic Lapse Rate

The moist adiabatic lapse rate refers to the rate at which the temperature of a rising air parcel changes with increasing altitude when it is saturated with moisture. It is different from the dry adiabatic lapse rate, which applies to unsaturated air parcels. The moist adiabatic lapse rate takes into account the condensation of water vapor and the release of latent heat, which affects the temperature profile of the rising air parcel.

To better understand the concept, let’s compare the moist adiabatic lapse rate with the dry adiabatic lapse rate. The dry adiabatic lapse rate is approximately 9.8°C per kilometer, which means that the temperature of a rising unsaturated air parcel decreases by 9.8°C for every kilometer it ascends in the atmosphere. This rate is primarily influenced by the adiabatic process, where the air parcel expands and cools as it rises due to decreasing atmospheric pressure.

In contrast, the moist adiabatic lapse rate is lower than the dry adiabatic lapse rate due to the release of latent heat during condensation. As the rising air parcel becomes saturated with moisture and reaches its condensation level, water vapor starts to condense into liquid droplets, releasing latent heat into the surrounding air. This latent heat release slows down the cooling of the air parcel, resulting in a lower rate of temperature decrease with altitude compared to the dry adiabatic lapse rate.

Relationship between Temperature and Altitude in Moist Air

In moist air, the temperature profile with increasing altitude is influenced by various factors, including the environmental lapse rate, the dew point, and the moisture content of the air. The environmental lapse rate refers to the actual rate at which the temperature changes with altitude in the surrounding atmosphere. It can vary depending on atmospheric conditions and can be either higher or lower than the moist adiabatic lapse rate.

When the environmental lapse rate is lower than the moist adiabatic lapse rate, the atmosphere is considered conditionally unstable. This means that a rising air parcel will be warmer than its surrounding environment, leading to convective instability and the potential for cloud formation and precipitation. On the other hand, when the environmental lapse rate is higher than the moist adiabatic lapse rate, the atmosphere is considered stable, and the air parcel will be cooler than its surroundings, inhibiting vertical motion and cloud development.

Understanding the relationship between temperature and altitude in moist air is crucial for meteorologists in predicting weather patterns and identifying atmospheric stability. By analyzing the moist adiabatic lapse rate and its interaction with the environmental lapse rate, meteorologists can gain insights into the potential for cloud formation, precipitation, and the overall stability of the atmosphere.

In summary, the moist adiabatic lapse rate plays a significant role in understanding the temperature changes with altitude in moist air. It accounts for the condensation of water vapor and the release of latent heat, which affects the rate of temperature decrease in rising air parcels. By considering the relationship between the moist adiabatic lapse rate and the environmental lapse rate, meteorologists can better predict weather patterns and assess atmospheric stability.

Calculation of Wet Adiabatic Lapse Rate

The wet adiabatic lapse rate is a term used in meteorology to describe the rate at which the temperature of a rising air parcel changes as it becomes saturated and condenses. It is an important concept in weather forecasting and understanding atmospheric stability.

Formula for Calculating Wet Adiabatic Lapse Rate

The formula for calculating the wet adiabatic lapse rate is as follows:

WALR = SALR - frac{{(L cdot text{{moisture advection rate}})}}{{(C_p cdot text{{temperature gradient}})}}

Where:
– WALR
refers to the wet adiabatic lapse rate
– SALR
is the saturated adiabatic lapse rate
– L is the latent heat of condensation
– Cp is the specific heat of air at constant pressure

To understand the wet adiabatic lapse rate, we first need to understand the saturated adiabatic lapse rate (SALR). The SALR is the rate at which a rising air parcel cools when it is saturated and condenses. It is approximately 5.5°C per 1000 meters. This rate is slower than the dry adiabatic lapse rate (DALR), which is approximately 9.8°C per 1000 meters.

Factors Affecting the Value of Wet Adiabatic Lapse Rate

Several factors can affect the value of the wet adiabatic lapse rate. These factors include:

  1. Moisture Advection: The rate at which moisture is transported horizontally in the atmosphere can impact the wet adiabatic lapse rate. If there is a high moisture advection rate, it can lead to a decrease in the wet adiabatic lapse rate.

  2. Temperature Gradient: The temperature gradient in the atmosphere plays a role in determining the wet adiabatic lapse rate. A steeper temperature gradient can result in a higher wet adiabatic lapse rate.

  3. Latent Heat of Condensation: The latent heat of condensation, denoted by L, is the energy released or absorbed when water vapor condenses or evaporates. It affects the wet adiabatic lapse rate by influencing the cooling or warming of the air parcel.

  4. Environmental Lapse Rate: The environmental lapse rate refers to the actual rate at which the temperature changes with altitude in the atmosphere. It can influence the wet adiabatic lapse rate by interacting with the temperature gradient.

Understanding the wet adiabatic lapse rate is crucial for meteorologists as it helps in predicting cloud formation, determining atmospheric stability, and analyzing weather patterns. By considering the various factors that affect the wet adiabatic lapse rate, meteorologists can make more accurate weather forecasts and gain insights into the thermodynamics of the atmosphere.

Wet Adiabatic Lapse Rate and Aviation

Importance of Wet Adiabatic Lapse Rate in Aviation

In aviation, understanding the concept of the wet adiabatic lapse rate is crucial for pilots, meteorologists, and flight planners. The wet adiabatic lapse rate refers to the rate at which the temperature of a rising air parcel changes when it is saturated and condensation occurs. This lapse rate is influenced by various factors such as atmospheric pressure, humidity, and temperature gradients.

One of the key reasons why the wet adiabatic lapse rate is important in aviation is its role in cloud formation. When an air parcel rises and cools, it eventually reaches its dew point, which is the temperature at which condensation occurs. This leads to the formation of clouds, which can have significant implications for flight operations. Pilots need to be aware of the altitude at which the condensation level occurs to anticipate potential cloud formations along their flight path.

Role of Wet Adiabatic Lapse Rate in Aircraft Performance

The wet adiabatic lapse rate also plays a crucial role in aircraft performance. As an aircraft ascends or descends through different layers of the atmosphere, it encounters varying atmospheric temperatures. These temperature changes can affect the aircraft’s engine performance, lift generation, and overall aerodynamic characteristics.

For example, a steep wet adiabatic lapse rate indicates a rapid decrease in temperature with increasing altitude. This can result in a higher density altitude, which affects engine performance by reducing its power output. Pilots need to consider these temperature changes and adjust their flight plans accordingly to ensure optimal aircraft performance and fuel efficiency.

Impact of Wet Adiabatic Lapse Rate on Flight Planning and Safety

The wet adiabatic lapse rate has significant implications for flight planning and safety. Understanding the temperature changes associated with the wet adiabatic lapse rate allows pilots to anticipate potential weather conditions and make informed decisions during flight planning.

By analyzing the wet adiabatic lapse rate, meteorologists can provide valuable information for weather forecasting. This information helps pilots and flight planners determine the stability of the atmosphere, the likelihood of convective instability, and the potential for turbulence or severe weather conditions. It also aids in identifying areas of moisture advection, which can impact visibility and aircraft performance.

Flight safety is paramount, and being aware of the wet adiabatic lapse rate allows pilots to anticipate and avoid hazardous weather conditions. By considering the impact of temperature changes on aircraft performance, pilots can make informed decisions to ensure the safety of their passengers and crew.

In conclusion, the wet adiabatic lapse rate is a critical concept in aviation. Its understanding is vital for pilots, meteorologists, and flight planners as it influences cloud formation, aircraft performance, and flight planning decisions. By considering the temperature changes associated with the wet adiabatic lapse rate, aviation professionals can enhance safety and optimize flight operations.

Comparison between Dry and Wet Adiabatic Lapse Rate

Definition of Dry Adiabatic Lapse Rate

In meteorology, the adiabatic lapse rate refers to the rate at which the temperature of an air parcel changes as it rises or descends in the atmosphere. The dry adiabatic lapse rate (DALR) specifically refers to the rate of temperature change for a rising or descending air parcel that is not saturated with moisture. It is an important concept in weather forecasting and understanding atmospheric stability.

The dry adiabatic lapse rate is primarily influenced by the thermodynamic properties of the air parcel and the surrounding atmospheric conditions. As an air parcel rises, it expands due to the decrease in atmospheric pressure. This expansion leads to a decrease in temperature, resulting in a cooling effect. Conversely, as an air parcel descends, it compresses due to the increase in atmospheric pressure, leading to an increase in temperature.

The dry adiabatic lapse rate is approximately 9.8 degrees Celsius per kilometer (or 5.4 degrees Fahrenheit per 1000 feet) and is considered a constant value under normal atmospheric conditions. This lapse rate is a result of the adiabatic process, which assumes that no heat is exchanged between the air parcel and its surroundings.

Key Differences between Dry and Wet Adiabatic Lapse Rate

While the dry adiabatic lapse rate applies to unsaturated air parcels, the wet adiabatic lapse rate (WALR) comes into play when an air parcel becomes saturated and condensation occurs. The WALR is also known as the saturated adiabatic lapse rate (SALR).

The main difference between the two is that the WALR is lower than the DALR. This is because when an air parcel is saturated, the release of latent heat due to condensation offsets some of the cooling caused by expansion. As a result, the temperature of a saturated air parcel changes at a slower rate compared to a dry air parcel.

Another important distinction is that the WALR is not a constant value like the DALR. It varies depending on the amount of moisture present in the air parcel and the rate of condensation. On average, the WALR is around 5 to 6 degrees Celsius per kilometer (or 2.7 to 3.3 degrees Fahrenheit per 1000 feet).

The difference between the DALR and WALR is crucial for understanding cloud formation and atmospheric stability. When the environmental lapse rate (ELR) is steeper than the DALR, the atmosphere is considered unstable, and vertical motion is enhanced. Conversely, when the ELR is closer to the DALR or WALR, the atmosphere is more stable, inhibiting vertical motion.

In summary, the dry adiabatic lapse rate applies to unsaturated air parcels, while the wet adiabatic lapse rate is relevant to saturated air parcels undergoing condensation. The DALR remains constant at around 9.8 degrees Celsius per kilometer, while the WALR varies depending on moisture content. Understanding these differences is essential for analyzing weather patterns, predicting cloud formation, and assessing atmospheric stability.

Application of Wet Adiabatic Lapse Rate in Geography

Definition of Wet Adiabatic Lapse Rate in the Context of Geography

In the field of geography, the wet adiabatic lapse rate plays a crucial role in understanding atmospheric processes. It refers to the rate at which the temperature of a rising air parcel changes as it ascends through the atmosphere and becomes saturated with moisture. This lapse rate is influenced by various factors such as atmospheric pressure, condensation level, and the interplay between dry and saturated adiabatic lapse rates.

To comprehend the significance of the wet adiabatic lapse rate, it is essential to understand the concept of adiabatic processes. Adiabatic processes occur when there is no exchange of heat between the air parcel and its surroundings. As a rising air parcel expands due to decreasing atmospheric pressure, it cools down at a specific rate known as the dry adiabatic lapse rate. However, when the air parcel reaches its condensation level and becomes saturated with moisture, the release of latent heat through condensation alters the cooling rate. This modified rate is referred to as the wet adiabatic lapse rate.

Significance of Wet Adiabatic Lapse Rate in Understanding Atmospheric Processes

The wet adiabatic lapse rate is of great importance in meteorology and weather forecasting. It helps in analyzing the stability of the atmosphere and predicting the formation of clouds and the occurrence of precipitation. By comparing the wet adiabatic lapse rate with the environmental lapse rate, which is the actual rate at which the temperature changes with altitude in the atmosphere, meteorologists can determine the potential for cloud formation and the likelihood of convective instability.

The wet adiabatic lapse rate also aids in understanding the movement of atmospheric moisture. As air parcels rise and cool, their temperature gradient determines the amount of moisture they can hold. If the temperature cools at a rate slower than the wet adiabatic lapse rate, the air parcel becomes unstable, leading to the formation of clouds and potentially severe weather conditions. On the other hand, if the temperature cools at a rate faster than the wet adiabatic lapse rate, the air parcel remains stable, inhibiting cloud formation.

Furthermore, the wet adiabatic lapse rate helps in determining the dew point depression, which is the difference between the temperature and the dew point. This measurement is crucial in assessing the level of humidity in the atmosphere and predicting the likelihood of fog formation or the potential for precipitation.

In summary, the application of the wet adiabatic lapse rate in geography provides valuable insights into atmospheric processes. It aids in understanding cloud formation, atmospheric stability, moisture advection, and weather forecasting. By considering the interplay between the wet adiabatic lapse rate and other factors such as temperature gradients and atmospheric moisture, geographers and meteorologists can gain a deeper understanding of the complex dynamics of the Earth’s atmosphere.

Importance of Moist Adiabatic Lapse Rate in Meteorology

The moist adiabatic lapse rate is a crucial concept in meteorology that helps us understand the behavior of air parcels as they rise or descend in the atmosphere. It plays a significant role in determining the stability and moisture content of the atmosphere, which in turn influences weather patterns and cloud formation.

Calculating Moist Adiabatic Lapse Rate

To calculate the moist adiabatic lapse rate, we need to consider the physical properties of the rising air parcel, such as its temperature, pressure, and moisture content. The formula for calculating the moist adiabatic lapse rate takes into account the condensation level, the saturation point at which the air parcel becomes saturated and starts to form clouds.

Formula for Calculating Moist Adiabatic Lapse Rate

The formula for calculating the moist adiabatic lapse rate is as follows:

Moist Adiabatic Lapse Rate = (g / Cp) * (1 + (L / Cp) * (dq / dt))

Where:
g is the acceleration due to gravity
Cp is the specific heat capacity at constant pressure
L is the latent heat of condensation
dq / dt is the rate of change of specific humidity with temperature

By using this formula, meteorologists can determine the rate at which the temperature of a rising air parcel changes with height, taking into account the release of latent heat due to condensation. This information is crucial for understanding atmospheric stability and the potential for cloud formation.

The moist adiabatic lapse rate differs from the dry adiabatic lapse rate, which assumes that no condensation occurs during the parcel‘s ascent or descent. The moist adiabatic lapse rate takes into account the release of latent heat during condensation, which affects the temperature gradient of the rising air parcel.

Understanding the moist adiabatic lapse rate is essential for weather forecasting and predicting atmospheric conditions. It helps meteorologists determine the potential for convective instability and the likelihood of cloud development. By analyzing the temperature gradient of the atmosphere and comparing it to the moist adiabatic lapse rate, meteorologists can assess the stability of the atmosphere and predict the formation of severe weather phenomena such as thunderstorms.

In summary, the moist adiabatic lapse rate is a fundamental concept in meteorology that helps us understand the behavior of air parcels as they rise or descend in the atmosphere. By considering the condensation level and the release of latent heat, we can calculate the rate at which the temperature of a rising air parcel changes with height. This information is crucial for understanding atmospheric stability, cloud formation, and predicting weather patterns.

Impact of Wet Adiabatic Lapse Rate on Weather and Climate

Benefits of Understanding Wet Adiabatic Lapse Rate

The wet adiabatic lapse rate plays a crucial role in understanding and predicting weather patterns. By comprehending this concept, meteorologists and climatologists can make more accurate forecasts and gain insights into the behavior of the atmosphere. Here are some key benefits of understanding the wet adiabatic lapse rate:

  1. Weather Forecasting: The wet adiabatic lapse rate helps in determining the stability of the atmosphere, which is essential for weather forecasting. It provides valuable information about the vertical temperature changes and the potential for cloud formation and precipitation. By analyzing the lapse rate, meteorologists can anticipate the likelihood of thunderstorms, heavy rain, or other weather phenomena.

  2. Cloud Formation: Understanding the wet adiabatic lapse rate is crucial for comprehending cloud formation. As air rises and cools, it reaches its dew point, leading to condensation and the formation of clouds. The lapse rate helps determine the altitude at which condensation occurs, known as the condensation level. This knowledge is vital for predicting cloud types, such as cumulus, stratus, or cirrus, and their associated weather patterns.

  3. Atmospheric Stability: The wet adiabatic lapse rate is an indicator of atmospheric stability. If the environmental lapse rate (the actual rate of temperature change in the atmosphere) is less than the wet adiabatic lapse rate, the atmosphere is considered stable. Conversely, if the environmental lapse rate exceeds the wet adiabatic lapse rate, the atmosphere is unstable. This information helps in assessing the potential for severe weather events like thunderstorms and tornadoes.

Impact of Wet Adiabatic Lapse Rate on Weather Forecasting

Specific humidity
Umidaderelativa

Weather forecasting relies on a thorough understanding of the wet adiabatic lapse rate. By considering the impact of this lapse rate, meteorologists can make more accurate predictions about upcoming weather conditions. Here are some ways in which the wet adiabatic lapse rate influences weather forecasting:

  1. Temperature Gradient: The wet adiabatic lapse rate provides insights into the vertical temperature changes in the atmosphere. By analyzing these changes, meteorologists can identify areas with significant temperature gradients. Such gradients often indicate the presence of weather fronts, which are boundaries between air masses of different temperatures. Weather fronts play a crucial role in the formation of storms and other weather disturbances.

  2. Atmospheric Moisture: The wet adiabatic lapse rate is closely related to atmospheric moisture. As air rises and cools, it reaches its dew point, leading to condensation and the formation of clouds. By understanding the wet adiabatic lapse rate, meteorologists can assess the moisture content in the atmosphere and predict the likelihood of precipitation. This knowledge is essential for forecasting rain, snow, or other forms of precipitation accurately.

  3. Atmospheric Stability: The wet adiabatic lapse rate helps in determining the stability of the atmosphere. If the environmental lapse rate is less than the wet adiabatic lapse rate, the atmosphere is stable, and weather conditions are likely to be calm. On the other hand, if the environmental lapse rate exceeds the wet adiabatic lapse rate, the atmosphere becomes unstable, increasing the potential for severe weather events. By considering the stability of the atmosphere, meteorologists can anticipate the development of thunderstorms, tornadoes, or other hazardous weather phenomena.

Importance of Wet Adiabatic Lapse Rate in Climate Studies

The wet adiabatic lapse rate is not only significant for weather forecasting but also plays a crucial role in climate studies. By understanding the impact of this lapse rate, climatologists can gain insights into long-term climate patterns and changes. Here are some reasons why the wet adiabatic lapse rate is important in climate studies:

  1. Thermodynamics and Climate: The wet adiabatic lapse rate is a fundamental concept in atmospheric thermodynamics, which is essential for understanding climate processes. By studying the lapse rate, climatologists can analyze the energy exchange and heat transfer within the atmosphere. This knowledge helps in comprehending the factors influencing climate patterns, such as the distribution of temperature and moisture across different regions.

  2. Moisture Advection: The wet adiabatic lapse rate is closely linked to moisture advection, which refers to the horizontal transport of moisture in the atmosphere. By considering the impact of the lapse rate, climatologists can assess the movement of moist air masses and their influence on climate patterns. Moisture advection plays a crucial role in determining the distribution of precipitation and the formation of weather systems like monsoons or tropical cyclones.

  3. Atmospheric Stability and Climate Change: The wet adiabatic lapse rate provides insights into the stability of the atmosphere, which is essential for studying climate change. Changes in the lapse rate can indicate shifts in atmospheric stability, potentially leading to alterations in weather patterns and climate regimes. By monitoring and analyzing the wet adiabatic lapse rate, climatologists can detect long-term changes in atmospheric stability and their implications for climate variability and change.

In conclusion, the wet adiabatic lapse rate has a significant impact on weather forecasting and climate studies. Understanding this concept enables meteorologists and climatologists to make more accurate predictions, assess atmospheric stability, and gain insights into long-term climate patterns. By considering the influence of the wet adiabatic lapse rate, we can enhance our understanding of the complex dynamics of the atmosphere and its role in shaping weather and climate.

Frequently Asked Questions

What is the Wet Adiabatic Lapse Rate?

The Wet Adiabatic Lapse Rate refers to the rate at which the temperature of a rising air parcel changes as it becomes saturated and condensation occurs. It is also known as the Saturated Adiabatic Lapse Rate.

How is the Wet Adiabatic Lapse Rate Defined in Geography?

In geography, the Wet Adiabatic Lapse Rate is defined as the rate at which the temperature of a rising air parcel changes when it is saturated and condensation occurs. It is influenced by the amount of moisture present in the air and the rate at which the air parcel cools as it rises through the atmosphere.

How Can I Calculate the Wet Adiabatic Lapse Rate?

The calculation of the Wet Adiabatic Lapse Rate involves considering the thermodynamic properties of the rising air parcel. It can be determined by using the following equation:

Wet Adiabatic Lapse Rate = (Lifting Condensation Level Temperature – Dew Point Temperature) / (Lifting Condensation Level Altitude – Initial Altitude)

What is the Difference between the Dry and Wet Adiabatic Lapse Rate?

The main difference between the Dry and Wet Adiabatic Lapse Rate lies in the presence of moisture in the air parcel. The Dry Adiabatic Lapse Rate refers to the rate at which the temperature of a rising air parcel changes when no condensation occurs. On the other hand, the Wet Adiabatic Lapse Rate considers the cooling effect of condensation and the release of latent heat.

How Does Adiabatic Cooling Relate to the Wet Adiabatic Lapse Rate?

Adiabatic cooling is a process in which the temperature of a rising air parcel decreases due to expansion as it moves to higher altitudes. The Wet Adiabatic Lapse Rate takes into account the cooling effect of adiabatic processes, as well as the additional cooling caused by condensation and the release of latent heat.

What is the Wet Adiabatic Lapse Rate per 1000 Feet?

The Wet Adiabatic Lapse Rate is approximately 3.3 degrees Celsius per 1000 feet. This value may vary depending on atmospheric conditions, such as the amount of moisture present in the air and the stability of the atmosphere.

How Does the Wet Adiabatic Lapse Rate Affect Aviation?

The Wet Adiabatic Lapse Rate plays a crucial role in aviation, particularly in weather forecasting and flight planning. Pilots and meteorologists use this rate to assess the stability of the atmosphere and predict the formation of clouds, turbulence, and other weather phenomena. Understanding the Wet Adiabatic Lapse Rate helps pilots make informed decisions regarding flight routes and altitudes.

What is the Equation for the Moist Adiabatic Lapse Rate?

The equation for the Moist Adiabatic Lapse Rate is as follows:

Moist Adiabatic Lapse Rate = (g / Cp) * (1 + (Lv * r) / (Rv * T))

Where:
– g is the acceleration due to gravity
– Cp is the specific heat capacity at constant pressure
– Lv is the latent heat of vaporization
– r
is the mixing ratio of water vapor to dry air
– Rv
is the specific gas constant for water vapor
– T
is the temperature of the air parcel

Understanding the Wet Adiabatic Lapse Rate and its relationship to atmospheric processes is essential in meteorology and weather forecasting. It helps us comprehend the behavior of air parcels as they rise and cool, leading to cloud formation and changes in atmospheric stability.

How Does the Wet Adiabatic Lapse Rate Relate to Atmospheric Stability?

Atmospheric stability refers to the tendency of the atmosphere to resist vertical motion. The wet adiabatic lapse rate is an important factor in determining atmospheric stability. It describes the rate at which the temperature of a rising air parcel changes as it becomes saturated with moisture.

How Does the Wet Adiabatic Lapse Rate Affect Cloud Formation and Precipitation?

Cloud formation and precipitation are closely linked to the wet adiabatic lapse rate. When air rises, it expands and cools due to decreasing atmospheric pressure. The rate at which the temperature changes during this ascent is known as the lapse rate. In the case of unsaturated air, the dry adiabatic lapse rate applies. However, when the air becomes saturated and condensation occurs, the wet adiabatic lapse rate comes into play.

The wet adiabatic lapse rate is influenced by the condensation level, which is the altitude at which condensation begins. As the air parcel rises and cools, it reaches its dew point temperature, causing water vapor to condense into visible water droplets or ice crystals, forming clouds. The wet adiabatic lapse rate is typically lower than the dry adiabatic lapse rate due to the release of latent heat during condensation.

To better understand the relationship between the wet adiabatic lapse rate and atmospheric stability, let’s compare it to the environmental lapse rate. The environmental lapse rate refers to the actual change in temperature with altitude in the surrounding atmosphere. If the environmental lapse rate is less than the wet adiabatic lapse rate, the atmosphere is considered stable. This means that a rising air parcel will cool more slowly than its surroundings, inhibiting vertical motion and leading to stable atmospheric conditions.

On the other hand, if the environmental lapse rate exceeds the wet adiabatic lapse rate, the atmosphere is considered unstable. In this case, the rising air parcel cools more rapidly than its surroundings, leading to buoyancy and upward motion. Unstable atmospheric conditions are favorable for cloud development and the formation of convective clouds, such as cumulus clouds, which can lead to precipitation.

In weather forecasting and meteorology, understanding the wet adiabatic lapse rate is crucial for predicting cloud formation, precipitation, and the potential for severe weather events. By analyzing the temperature gradient and moisture advection in the atmosphere, meteorologists can assess the stability of the atmosphere and make predictions about the likelihood of cloud formation and precipitation.

In summary, the wet adiabatic lapse rate plays a significant role in atmospheric stability and its influence on cloud formation and precipitation. By understanding how temperature changes in a rising air parcel that becomes saturated with moisture, meteorologists can gain insights into the behavior of the atmosphere and make more accurate weather forecasts.

Frequently Asked Questions

What is the difference between wet adiabatic lapse rate and dry adiabatic lapse rate?

The dry adiabatic lapse rate refers to the rate at which the temperature of a parcel of dry, or unsaturated, air changes as it moves upward or downward without exchanging heat with its surroundings. The wet adiabatic lapse rate, on the other hand, refers to the rate at which the temperature of a parcel of saturated air changes as it moves upward or downward. The wet adiabatic lapse rate is typically less than the dry adiabatic lapse rate due to the release of latent heat during condensation.

How is the wet adiabatic lapse rate calculated per 1000 feet?

The wet adiabatic lapse rate varies depending on the moisture content of the air and the temperature. However, it is typically around 5 degrees Fahrenheit per 1000 feet. This is less than the dry adiabatic lapse rate, which is 9.8 degrees Celsius per 1000 meters or about 5.5 degrees Fahrenheit per 1000 feet.

What does the term “moist adiabatic lapse rate” mean?

The moist adiabatic lapse rate is the rate at which the temperature of a parcel of moist or saturated air changes as it ascends or descends in the atmosphere. This rate is less than the dry adiabatic lapse rate due to the release of latent heat during condensation.

How does the wet adiabatic lapse rate affect the formation of clouds?

When a parcel of air rises and cools at the wet adiabatic lapse rate, it can reach its dew point, the temperature at which the air becomes saturated. When this happens, water vapor in the air condenses to form cloud droplets, leading to cloud formation.

What is the significance of the moist adiabatic lapse rate in weather forecasting?

In weather forecasting, understanding the moist adiabatic lapse rate is crucial for predicting cloud formation, precipitation, and storm intensity. If the environmental lapse rate is between the dry and moist adiabatic lapse rates, conditional instability exists, which can lead to the formation of thunderstorms if the air is lifted to its level of free convection.

How does the wet adiabatic lapse rate relate to atmospheric stability?

Atmospheric stability is determined by comparing the environmental lapse rate (the actual temperature change with height) with the dry and moist adiabatic lapse rates. If the environmental lapse rate is less than the moist adiabatic lapse rate, the atmosphere is considered stable because air parcels will be cooler and denser than their surroundings if they rise, and will therefore tend to sink back to their original positions.

What is the role of the moist adiabatic lapse rate in the adiabatic process?

In the adiabatic process, air parcels change temperature as they rise or fall without exchanging heat with their surroundings. If the air parcel is saturated, it will cool or warm at the moist adiabatic lapse rate. This process is crucial in the formation of clouds and precipitation.

How does the wet adiabatic lapse rate affect aviation?

In aviation, understanding the wet adiabatic lapse rate is important for predicting weather conditions such as cloud ceilings and visibility. It can also affect aircraft performance, as the temperature and moisture content of the air can influence engine efficiency and lift.

Why is the moist adiabatic lapse rate lower than the dry adiabatic lapse rate?

The moist adiabatic lapse rate is lower than the dry adiabatic lapse rate because when a parcel of air is saturated and rises, it cools at a slower rate. This is due to the release of latent heat during the condensation of water vapor, which offsets some of the cooling.

How can one calculate the moist adiabatic lapse rate?

The moist adiabatic lapse rate is not a constant value like the dry adiabatic lapse rate, as it depends on the temperature and pressure of the air parcel. It can be calculated using complex thermodynamic equations that take into account the specific heat capacity of air, the latent heat of vaporization, and the saturation vapor pressure.

What Is Dry Adiabatic: Detailed Insight And Facts

This article discusses about what is dry adiabatic rate. Lapse refers to a decrease in quantity. Anything which lapses decreases in quantity or number. It represents negative slope in quantity vs time graph.

Lapse rate in adiabatic process refers to decrease in temperature in Earth’s atmosphere with altitude. Here, the temperature is the decreasing quantity. The rate at which it decreases is called as the lapse rate.

What is dry adiabatic rate?

Adiabatic process means a process in which there is no heat transfer across the walls of system and surroundings. Heat cannot escape the walls of adiabatic system and cannot enter through the walls of adiabatic system.

Dry represents the absence of water or moisture content in atmosphere. The rae of decrease in temperature with altitude when the air inside the system is dry is called as dry adiabatic rate.

How to calculate dry adiabatic lapse rate?

To calculate dry adiabatic lapse rate, one needs to know the gravitational pull and the specific heat at constant pressure of the local air.

Dry adiabatic rate can be calculated as-

gif

Where,

The Greek symbol Gamma refers to lapse rate in SI units that is temperature, T divided by altitude, Z (in m).

g represents gravitational pull and Cp represents specific heat at constant pressure.

Dry adiabatic lapse rate formula

As discussed above, the formula for calculating dry adiabatic lapse rate requires local specific heat and gravitational pull.

The formula of dry adiabatic lapse rate can be given as-

gif

Where,

The Greek symbol Gamma refers to lapse rate in SI units that is temperature, T divided by altitude, Z (in m).

g represents gravitational pull and Cp represents specific heat at constant pressure.

Is dry adiabatic rate constant?

The dry adiabatic rate can be considered constant because no heat is transferred from the moving parcel of air.

Even in the formula of dry adiabatic rate, we can see that gravity,g and specific heat, Cp remains constant.

What is moist adiabatic rate?

Moisture means anything having water content. More water content means more moisture.

Moist adiabatic rate means the rate of decrease of temperature with altitude when the air in the system has water content in it.

What is the formula for moist adiabatic rate?

The moist adiabatic rate can be given as-

gif

Where,

Greek letter Gamma represents wet lapse rate

g is Earth’s gravitational acceleration

Hv is heat of vapourisation

R in the numerator represents specific heat of dry air

R in the denominator represents specific heat of wet air

Cpd is the specific heat of dry air at constant pressure

T is temperature in K

What is environmental lapse rate?

Just like dry adiabatic lapse rate and moist adiabatic lapse rate, environmental lapse rate is also related to rate of decrease in temperature.

The rate of decrease of temperature with altitude in a stagnant surrounding atmosphere is called as environmental lapse rate or ELR.

What is an adiabatic system?

A system is the three dimensional space that is taken under observation. The system is differentiated from the surroundings by walls or system boundary.

An adiabatic system is a system whose boundaries doesn’t allow heat to pass through it. This means that heat cannot enter or exit the system and stays constant.

Mathematically,

Del Q= 0

Where, Del represents change in quantity and,

Q represents heat inside the system.

What are different types of thermodynamic systems?

The type of boundaries decide the characteristic features of the system. On the basis of type of boundary of the system, thermdynamic systems can be classified into following types-

  • Open system– An open system is one in which both mass and heat transfer can take place. The boundary of system is such that it allows both mass and heat to enter or exit from the system. An example of open system is water reservoir which is open from top.
  • Closed system– A closed system is one in which no mass can enter but heat transfer can take place. An example of this system is water filled inside a plastic bottle.
  • Isolated system– In this system, no mass or heat transfer can take place. An example of this system is hot beverage stored in thermos flask.
  • Adiabatic system- In this system, mass can flow through the system but heat transfer cannot take place. An example of this system is Nozzle. In nozzle, hot gases enter through the inlet and exit from the outlet, the heat transfer does not take place across the walls of nozzle.

Mathematical representation of thermodynamic systems

The mathematical representations of different thermodynamic systems is given below-

  • Open system- In open system, both mass and heat transfer can take place.

So,

gif

and,

gif
  • Closed system- In closed system, only heat transfer takes place and no mass transfer takes place.

So,

This image has an empty alt attribute; its file name is gif.latex

and,

gif
  • Isolated system- In isolated system, no heat transfer as well as no mass transfer can take place.

So,

gif

and,

gif
  • Adiabatic system- In adiabatic system, only mass transfer takes place and no heat transfer takes place.

So,

gif

and,

gif

Where,

m is the mass and Q is the heat content in the system.

Types of thermodynamic processes

There are different types of thermodynamic processes a working fluid may undergo. Different thermodynamic processes means different properties will be achieved by the working fluid.

  • Isothermal process- In isothermal process, the temperature of the system remains constant.

Mathematically,

gif

Where, T is the temperature

  • Adiabatic process- In adiabatic process, the heat content of the system remains constant.

Mathematically,

gif

Where, Q is the heat content

  • Isobaric process- In isobaric process, the pressure remains constant inside the system.

Mathematically,

gif

Where, P is the Pressure in the system

  • Isochoric process- In isochoric process, the volume remains constant inside the system.

Mathematically,

gif

V is the Volume

Work done in different thermodynamic processes

As the working fluid takes different path in different thermodynamic system, the amount of work done also changes from process to process

The work done by different thermodynamic processes are given below-

W = nRTln(V2/V1)

Where,

R is the universal gas constant

V2 and V1 are volume after the isothermal process and before the process respectively

  • Work done in isobaric process-
gif
  • Work done in isochoric process-
gif

W = nR(T2-T1)/γ-1

The Greek letter Gamma represents specific heat index

What is adiabatic index?

Adiabatic index is ratio of specific heat of gas at constant pressure to specific heat of gas constant volume.

Mathematically it can be given as,

γ = Cp/Cv

It is a very important ratio as it is used in finding the slopes and work done in different thermodynamic processes.

Graphical representation of different thermodynamic processes

The general equation of any thermodynamic process is given below-

PVn = C

Different thermodynamic processes can be plotted in graph as shown below-

what is dry adiabatic
Image: Graphical representations of thermodynamic processes

Image credits: toppr.com

The slopes of these processes is different because of adiabatic index, n.

What Is Adiabatic Cooling: Working, Process, Several Facts Around It

It is not necessary for a system to transfer heat in order to perform work. This article discusses about what is adiabatic cooling.

In adiabatic cooling, the pressure inside the system reduces due to which volume increases. This causes the system to do work on the surroundings. In adiabatic process, heat is not transferred but work is still done in the form of moving walls or boundary of the system.

What is adiabatic cooling system?

Adiabatic cooling is a type of thermodynamic process in which the temperature of the working fluid reduces without any transfer of heat between system and surroundings.

This happens when pressure of the system reduces and volume expands. The walls of system are adiabatic so they do not let heat escape or enter the system. Though they can move in order to perform work.

Types of adiabatic cooling?

Though cooling takes place, it is not necessary that heat transfer takes place. In adiabatic cooling, heat transfer does not take place but temperature of the system decreases.

There are three types of adiabatic cooling process, they are-

  • Direct adiabatic cooling: This is also called as wet bulb cooling. In this process, there is direct interaction between air and water.
  • Indirect adiabatic cooling: This is also called as evaporative cooling. In this process, water is evaporated in a column of air that is different from the air which is used for cooling.
  • Two stage adiabatic cooling: As the name suggests, it uses two stages to complete the cooling process. First stage is indirect adiabatic cooling and other stage is direct adiabatic cooling. Combining both the processes helps us achieve cooling faster.

What are the advantages for adiabatic chiller cooling?

The benefits of air-cooled chillers are as follows-

  • The process is automated so the need of human interference is reduced so it does not need continuous inspection or operator.
  • Energy savings are higher so it is cost effective and gets more profit to the company.
  • It is greener technology and has very less impact on environment. This is because it creates minimal waste while operating.
  • These systems are cost effective and easy to use. Hence, the installation process and setting up time does not take much time.
  • The user interface is very simple making it easy to use.

Above benefits make air cooled chillers a desirable device for cooling purposes. Many industries use air chillers and save huge sum of money by using cost effective chillers.

How does adiabatic air cooling occur?

The adiabatic air cooling occurs when the pressure of the system is reduced which results in volume expansion.

The adiabatic walls of the system prevent heat to enter or escape. Due to the pressure drop, work is done on the system reducing the internal energy of the system. Internal energy being function of temperature, temperature also decreases as internal energy decreases.

This way adiabatic air cooling takes place.

What is adiabatic cooling extrusion?

Extrusion means squeezing out the working material into a cavity to make desirable shapes. For example, wires can be made out of extrusion.

Adiabatic means no heat transfer takes place. Extrusion is done by pushing the working material into a cavity or out of cavity with the use of an extruder. In adiabatic cooling extrusion, the extruder operates without the input or extraction of heat.

Adiabatic cooling vs evaporative cooling

Adiabatic cooling and evaporative cooling are different. Below section explains in brief about what is adiabatic cooling and what is evaporative cooling.

  • Adiabatic cooling: Adiabatic cooling is the process in which temperature is reduced at the expense of change in air pressure and increase in volume.
  • Evaporative cooling: In evaporative cooling, a large fan draws warm air through moisture rich pads. The temperature of air is reduced as the water inside the pad is evaporated.

What do you mean lapse rate?

The word lapse refers to decrease in certain quantity. In adiabatic process, lapse rate refers to decrease in certain quantity. In this case, usually temperature in Earth’s atmosphere.

The lapse rate can be defined as the rate at which a particular parameter usually temperature decreases with altitude.

Mathematically, lapse rate can be defined as-

gif

Where,

The Greek symbol Gamma refers to lapse rate in SI units that is temperature, T divided by altitude, Z (in m).

What is the dry adiabatic rate of cooling for rising air?

Dry refers to the absence of water content in air. Dry air has a dryness fraction of 100% and wetness fraction of 0%.

The dry adiabatic rate of cooling for rising air is given below-

gif

Where,

The Greek symbol Gamma refers to lapse rate in SI units that is temperature, T divided by altitude, Z (in m).

g represents gravitational pull and Cp represents specific heat at constant pressure.

What is moist adiabatic lapse rate?

The word moist refers to anything which contains water content in it. Moist adiabatic lapse rate.Water has a certain latent heat of vaporisation due to which it affects the rate of convection in Earth’s atmosphere.

Mathematically, moist adiabatic lapse rate can be written as-

gif

Where,

Greek letter Gamma represents wet lapse rate

g is Earth’s gravitational acceleration

Hv is heat of vapourisation

R in the numerator represents specific heat of dry air

R in the denominator represents specific heat of wet air

Cpd is the specific heat of dry air at constant pressure

T is temperature in K

What is environmental lapse rate?

Environmental lapse rate or ELR can be defined as the rate of decrease of temperature with altitude in stagnant atmosphere.

The international standard atmosphere has a temperature lapse rate of 6.50 degrees celsius/km from sea level to an altitude of 11km.  However, the temperature of the air in atmosphere doesn’t always reduce at uniform rate with height as there can be inversions layer of air in which the temperature increases with altitude.

Overall, the concept of lapse rate was meant for troposphere only. Eventually it was confirmed that it can be used in any parcel of gas that is affected by gravity.

what is adiabatic cooling
Image: Latent heat of vapourisation adds energy to cloud formation

Image credits: Wikipedia

7 Adiabatic Process Example:Different Types,Adiabatic System

adiabatic process example

This article discusses in detail about the adiabatic example that means examples of adiabatic process. An adiabatic process is one of the many important thermodynamic processes.

The term adiabatic means no heat and mass transfer. In an adiabatic process, no heat or mass transfer takes place across the walls or boundary of system.

What is an adiabatic process?

An adiabatic process is a type of thermodynamic process in which there is no heat and mass transfer between the system and its surroundings that is no amount heat or mass can exit or enter the system.

The energy transfer from an adiabatic system takes place in the form of work done. Transfer of heat is prohibited by the adiabatic walls of system. The working fluid inside the system can perform work by moving the walls of system to and fro or up and down. For example piston.

Mathematically, an adiabatic process can be represented as-

Del Q= 0 and Del m = 0

Where Q represents heat transfer

And

m represents mass transfer

What is work done in adiabatic process?

Few parameters are required to calculate the work done in adiabatic process. These parameters are specific ratio, start and end temperatures of the process or start and end pressure values of the process.

Mathematically,

Work done in adiabatic system is given by-

W = R/1-γ x (T2 – T1)

Where,

Y is the specific heat ratio

R is the universal gas constant

T1 is the temperature before the start of adiabatic process

T2 represents temperature after completion of adiabatic process

Applications of adiabatic assumptions

First law of thermodynamics for a closed system can be written as, dU=Q-W. Where, U is the internal energy of the system, Q is the heat transfer and W is the work done by the system or on the system.

  • If system has rigid walls, volume cannot be changed hence W=0. And the walls are not adiabatic, then the energy is added in terms of heat such that temperature rises.
  • If system has rigid walls such that pressure and volume does not change, then the system may undergo isochoric process for energy transfer. In this case also, the temperature rises.
  • If system has adiabatic walls and rigid walls, then the energy is added in non viscous, frictionless pressue volume work where no phase change takes place and only temperature rises, this is termed as isentropic process (or constant entropy process). It is an ideal process or reversible process.
  • If the walls are non adiabatic then heat transfer takes place. This results in increase in randomness of the system or entropy of the system.

Example of adiabatic processes

The temperature of gas increases when adiabatic compression takes place and temperature of the gas decreases when adiabatic expansion takes place.

Detailed discussion is given about adiabatic cooling and adiabatic heating in below section.

Adiabatic cooling– When the pressure of an adiabatic isolated system is decreased, the gas expands causing the gas to do work on surroundings. This results in decrease in temperature. This phenomenon is responsible for formation of lenticular clouds in the sky.

Adiabatic cooling

Adiabatic heating- When work is done on an adiabatic isolated system, the pressure of the system increases and hence the temperature increases. Adiabatic heating finds its applications in diesel engine during the compression stroke to increase the fuel vapour temperature enough to ignite it.

Adiabatic heating

Example of adiabatic compression

Lets assume data of gasoline engine during its compression stroke as-

Uncompressed volume of cylinder- 1 L

Specific heat ratio-7/5

Compression ratio of engine- 10:1

Temperature of uncompressed gas- 300K

Pressure of uncompressed gas- 100kpa

Calculate the final temperature after adiabatic compression.

The solution to above problem can be given as-

P1V1γ = C = 6.31Pa.m.21/5

Also,

P2V2γ = C = 6.31Pa.m.21/5 = P x (0.0001m3)7/5

So the final temperature can be found using equation given below-

T = PV/constant = 2.51 x 106 x 10-4m3/0.333Pa.m3K-1

Plotting adiabats

Adiabat is the curve of constant entropy on P-V diagram. Y axis denotes pressure, P and X axis denotes volume, V.

  • Similar to isotherms, adiabats also approaches P and V axis asymptotically.
  • Each isotherm and adiabat intersect once.
  • Both isotherm and adiabat look similar except during free expansion where an adiabat has steeper inclination.
  • Adiabats are towards east North-east if Isotherms are towards North-east direction.

The adiabats can be shown in the diagram below-

adiabatic
Image: Graph showing adiabat and isotherm

Image credits: AugPiEntropyandtempCC BY-SA 3.0

Red curves represents Isotherms and black curve represents adiabats.

Examples of adiabatic processes in industry

There are several places where adiabatic process can take place. The examples of adiabatic process are as given below-

  • Releasing of air from a pneumatic tire is an example of gas compression with heat generation.
adiabatic process example
  • Nozzles, compressors, and turbines use adiabatic efficiency for their design. This can be considered as the most imortant applications of adiabatic process. 
  • Oscillating pendulum in a vertical plane is a perfect example of adiabatic process.
Oscillating pendulum in a vertical plane
  • Quantum harmonic oscillator is also an example of adiabatic process or system.
  • Icebox prevents heat to enter or exit from the system. This is also an example of adiabatic system.

Difference between isothermal and adiabatic process

The difference between isothermal process and adiabatic process is given below-

Isothermal processAdiabatic process
 Isothermal process is a process in which the temperature of the system does not change. The entire process takes place at a constant temperature.Adiabatic process is a thermodynamic process in which no heat transfer takes place between system and surroundings meaning there is no exchange of heat across the walls of system.
Work done is because of net heat transfer in the system. Work done is because of net internal energy change inside the system.
Temperature cannot be changed.Temperature can be variable in adiabatic process.
Heat transfer can take place.Heat transfer cannot take place.
Table: Difference between isothermal process and adiabatic process

What happens when a cylinder containing high pressure gas explodes?

Whenever a cylinder containing gas high pressure gas expodes. The undergoes two types of changes. They are-

  • Irreversible adiabatic change.
  • Temperature of the gas decreases due to expansion.

Pressure-temperature relationship for an adiabatic process

Pressure and temperature are related to each other by the equation discussed in below section.

The relation between pressure and temperature makes it easier for us to calculate temperature if pressure points are given or pressure if temperature points are given.

The relation between temperature and pressure is given by-

T2/T1 = (P2/P1)γ-1/γ

Where, T2 is the final temperature after the process

T1 is the temperature before adiabatic process

P2 is the final pressure

P1 is the initial pressure

How To Measure Clamping Pressure: Exhaustive Detailed Insights

Injection moulding

Introduction to Clamping Pressure

Clamping pressure is a fundamental concept in various fields, including manufacturing, woodworking, and physics. It plays an essential role in processes such as injection molding, where it helps control the quality and consistency of the final product.

Importance of Clamping Pressure

Clamping pressure is crucial in many applications. For instance, in injection molding, the clamping pressure must be carefully controlled to ensure the mold is completely filled with the material. Too much pressure can cause damage to the mold or the product, while too little pressure may result in an incomplete or flawed product.

In woodworking, clamping pressure is used to hold pieces of wood together while glue dries. The pressure must be distributed evenly to ensure a strong bond and prevent warping or splitting of the wood.

Clamping pressure also plays a vital role in the functioning of various clamping devices and systems, such as hydraulic and mechanical clamping systems. These systems use pressure to hold objects securely in place for various operations.

Definition of Clamping Pressure

Clamping pressure can be defined as the force applied by a clamp to hold or secure an object. It is typically measured in pounds per square inch (psi) or pascals (Pa) in the metric system.

The clamping force can be calculated using the formula:

Clamping Force = Pressure x Area

Where:
– Pressure is the force applied per unit area, measured in psi or Pa.
– Area
is the surface area over which the pressure is applied, measured in square inches or square meters.

For example, if a clamp applies a force of 100 pounds over an area of 10 square inches, the clamping pressure would be 10 psi.

Clamping Pressure in Manufacturing

In manufacturing processes like injection molding, the clamping pressure is used to keep the mold closed during the injection and cooling stages. The pressure control in this process is crucial to achieve high-quality products.

High pressure clamping is often required to ensure the mold is completely filled and to prevent the material from flowing back out of the mold. However, the pressure must be carefully regulated to avoid damaging the mold or the product.

Pressure sensors are typically used in these systems to monitor and adjust the clamping pressure as needed. The pressure distribution within the mold can also be analyzed to optimize the process and improve the quality of the final product.

Clamping Pressure in Woodworking

In woodworking, clamps are used to hold pieces of wood together while glue dries. The clamping pressure must be applied evenly and not too forcefully to prevent warping or splitting of the wood.

For example, when gluing two pieces of wood together, the clamps should be positioned so that the pressure is distributed evenly across the joint. Too much pressure in one area can cause the wood to warp or split, while too little pressure may result in a weak bond.

Special woodworking tools, such as pressure distribution plates, can be used to help achieve an even pressure distribution. These tools spread the clamping force over a larger area, reducing the risk of damage to the wood.

In conclusion, understanding and correctly applying clamping pressure is crucial in many fields, including manufacturing and woodworking. Whether it’s ensuring the quality of injection molded products or creating strong, durable wood joints, clamping pressure plays a vital role.

Understanding Clamping Pressure in Different Contexts

Clamping pressure is a crucial concept in various fields, from manufacturing to woodworking. It refers to the force applied by a clamp to hold or secure objects together. The amount of clamping pressure required can vary depending on the context, such as the materials involved, the purpose of clamping, and the specific technique used.

Clamping Pressure in CNC Machine

In the context of CNC (Computer Numerical Control) machines, clamping pressure is a critical factor in ensuring the accuracy and quality of the final product. CNC machines use mechanical clamping or hydraulic clamping systems to secure the workpiece during machining processes.

The clamping force needs to be sufficient to prevent the workpiece from moving during machining, but not so high that it deforms the workpiece. The clamping force calculation involves considering the cutting forces, the size and shape of the workpiece, and the rigidity of the clamping system and the machine itself.

For example, in a milling operation, if the clamping pressure is too low, the workpiece might move, leading to inaccuracies in the final product. On the other hand, if the clamping pressure is too high, it might deform the workpiece or damage the clamping devices.

Clamping Pressure in Injection Moulding

Injection moulding is another area where clamping pressure plays a vital role. In this process, melted plastic is injected into a mould under high pressure. The clamping unit then applies force to keep the mould closed during the injection and cooling process.

The injection molding pressure needs to be carefully controlled. Too much pressure can cause the plastic to flash, which means it escapes from the intended cavity and forms excess material on the part. Too little pressure can lead to short shots, where the mould cavity isn’t completely filled.

The clamping force in injection moulding is typically calculated based on the projected area of the part being moulded and the pressure of the plastic melt. High-pressure clamping is often required to counteract the injection pressure and keep the mould closed.

Clamping Pressure for Wood Glue

In woodworking, clamping pressure is applied when joining pieces of wood together using wood glue. The purpose of the clamp is to hold the pieces securely in place while the glue dries.

The amount of pressure to apply depends on the type of wood and the glue used. Too much pressure can squeeze out too much glue, leading to a weak joint. On the other hand, too little pressure might not spread the glue evenly, resulting in a poor bond.

A good rule of thumb for woodworkers is to apply just enough pressure to see a thin line of glue squeeze out along the joint. This indicates that the glue is being evenly distributed across the joint.

Clamping Pressure of Bolts

Bolts are another common application of clamping pressure. When a bolt is tightened, it stretches slightly. This stretching creates a clamping force that holds the bolted parts together.

The amount of clamping force a bolt can generate depends on its material, size, and how much it’s tightened. Too much clamping force can strip the threads or even break the bolt, while too little can lead to the bolted parts coming loose.

In many cases, the desired clamping force is achieved by tightening the bolt to a specified torque. Torque wrenches are often used for this purpose, as they allow for precise control of the tightening force.

In conclusion, clamping pressure is a fundamental concept in various fields. Understanding how to control and apply it correctly is crucial for achieving the desired results, whether you’re machining a part, moulding a plastic component, gluing wood, or tightening a bolt.

Calculation of Clamping Pressure

Clamping Pressure Calculation

Clamping pressure, a critical factor in many manufacturing and woodworking processes, is the force applied to hold two or more objects together. It’s crucial to calculate it accurately to ensure the quality of the final product and the safety of the process.

The clamping pressure can be calculated using the formula:

Clamping Pressure = Force / Area

Where:
– Force is the total force applied by the clamping device, measured in Newtons (N).
– Area is the contact area between the clamping device and the object, measured in square meters (m²).

For example, if a clamping device applies a force of 1000 N over an area of 0.01 m², the clamping pressure would be 100,000 Pascal (Pa).

How to Calculate Clamping Force from Torque?

In mechanical clamping, torque is often used to generate the clamping force. The relationship between torque (T), force (F), and radius (r) is given by the formula:

Torque = Force x Radius

Rearranging this formula, we can calculate the clamping force from the applied torque and the radius of the bolt or screw used:

Force = Torque / Radius

For instance, if a torque of 50 Nm is applied to a bolt with a radius of 0.01 m, the resulting clamping force would be 5000 N.

How to Calculate Clamping Pressure in Injection Moulding?

In injection moulding, clamping pressure is crucial for the production of high-quality parts. The clamping force in an injection moulding machine is given by:

Clamping Force = Injection Pressure x Projected Area

Where:
– Injection Pressure is the pressure applied by the injection unit, typically in Pascal (Pa).
– Projected Area is the largest area viewed from the direction of the draw, typically in square meters (m²).

For example, if the injection pressure is 1500 Pa and the projected area is 0.02 m², the clamping force would be 30 N.

Clamping Pressure Equation

The general equation for clamping pressure, applicable in various scenarios like hydraulic clamping, high pressure clamping, or pressure regulation, is:

Clamping Pressure = Force / Area

However, in specific cases like mechanical clamping or injection moulding, the force is calculated differently. For mechanical clamping, the force is derived from the applied torque and radius of the bolt or screw. In injection moulding, the force is the product of the injection pressure and the projected area of the mould.

Remember, accurate calculation of clamping pressure is essential for quality control, safety, and efficiency in manufacturing processes. It helps in pressure management, pressure distribution, and in making necessary adjustments in the clamping system.

What is Clamping Tonnage?

Clamping tonnage is a critical concept in the field of injection molding. It refers to the force applied to the mold to keep it closed during the injection process. The clamping tonnage is measured in tons, and it’s crucial to ensure that the correct amount of force is applied to prevent defects in the final product.

The clamping force is generated by either a hydraulic clamping system or a mechanical clamping system. The choice between these two systems depends on several factors, including the size and complexity of the mold, the type of material being injected, and the specific requirements of the manufacturing process.

In a hydraulic clamping system, the force is generated by the pressure of a fluid, typically oil, which is controlled by a pressure control system. On the other hand, in a mechanical clamping system, the force is generated by mechanical components such as gears, levers, and springs.

The distribution of clamping force across the mold is also an important consideration. It must be evenly distributed to ensure that the entire mold is properly filled and that the final product has a uniform shape and size. This is achieved by careful clamp pressure adjustment, often assisted by pressure sensors and advanced clamping technology.

How to Calculate Clamping Tonnage for Injection Molding?

The calculation of clamping tonnage for injection molding is a critical task that requires a deep understanding of the molding process and the properties of the material being injected. The formula for calculating the clamping force is:

Clamping Force = Projected Area x Injection Pressure

The projected area is the largest area viewed from the direction of the clamping force, and it’s typically measured in square inches. The injection pressure is the pressure applied to the material during the injection process, and it’s typically measured in pounds per square inch (psi).

For example, if the projected area is 100 square inches and the injection pressure is 10,000 psi, the clamping force would be 1,000,000 pounds, or 500 tons.

It’s important to note that the clamping force must be greater than the injection pressure to prevent the mold from opening during the injection process. This is known as the “rule of thumb” in injection molding, and it’s a critical aspect of pressure management in the molding process.

Example of Clamping Tonnage Calculation

Let’s consider an example to illustrate the calculation of clamping tonnage. Suppose we have a mold with a projected area of 150 square inches and we’re injecting a material with an injection pressure of 15,000 psi.

Using the formula mentioned above, the clamping force would be:

Clamping Force = 150 square inches x 15,000 psi = 2,250,000 pounds

To convert this to tons, we divide by 2000 (since there are 2000 pounds in a ton), giving us a clamping force of 1125 tons. This is the minimum clamping force required to keep the mold closed during the injection process.

In conclusion, understanding and correctly calculating clamping tonnage is crucial in injection molding. It ensures the quality of the final product and the efficiency of the molding process. Whether you’re using hydraulic clamping, mechanical clamping, or a combination of both, a thorough grasp of clamping mechanics and pressure regulation is essential.

Measurement and Tools for Clamping Pressure

Clamping pressure is a crucial factor in many industrial processes, including injection molding, woodworking, and mechanical clamping. It’s the force applied to hold two or more objects together for a specific purpose. The clamping force must be accurately measured and controlled to ensure the quality and integrity of the final product.

Clamping Pressure Sensor

A clamping pressure sensor is a device that measures the force exerted by a clamp. These sensors are often used in high-pressure clamping systems where precise pressure control is essential. They work by converting the mechanical force into an electrical signal that can be read and interpreted by a control system.

For example, in an injection molding process, the clamping pressure sensor helps to monitor and regulate the pressure applied to the mold. This is crucial to ensure the plastic is correctly formed and that the mold isn’t damaged by excessive pressure.

Clamping Pressure Gauge

A clamping pressure gauge is another tool used to measure the clamping force. It’s often used in hydraulic clamping systems where the clamping force is generated by hydraulic pressure. The gauge measures this pressure and provides a reading, usually in pounds per square inch (psi) or bar.

For instance, in woodworking, a woodworker might use a clamping pressure gauge to ensure they’re applying the right amount of force when gluing pieces of wood together. Too much pressure can cause the wood to warp or the glue to squeeze out, while too little pressure might not provide a strong enough bond.

How to Measure Clamping Pressure?

Measuring clamping pressure involves using tools like pressure sensors and gauges. The specific method depends on the type of clamping system and the materials involved.

In a hydraulic clamping system, for example, you would typically use a pressure gauge connected to the hydraulic line. The gauge provides a direct reading of the hydraulic pressure, which can be converted into clamping force using the formula:

Clamping Force = Hydraulic Pressure x Area of the Cylinder

In a mechanical clamping system, you might use a load cell or pressure sensor placed between the clamp and the object being clamped. The sensor measures the force exerted by the clamp and converts it into an electrical signal. This signal can then be read by a control system and used to adjust the clamping force if necessary.

Clamping Pressure Measuring Tools

There are various tools available for measuring clamping pressure, including:

  • Pressure Sensors: These devices convert mechanical force into an electrical signal. They’re often used in high-force clamping systems where precise pressure control is necessary.
  • Pressure Gauges: These tools measure the pressure in a hydraulic system and provide a reading in psi or bar. They’re commonly used in hydraulic clamping systems.
  • Load Cells: These devices measure force or load. They’re often used in mechanical clamping systems to measure the clamping force directly.
  • Pressure Distribution Systems: These systems use a special film or sensor array to measure and visualize the pressure distribution across the clamping surface. They’re useful for ensuring even pressure distribution and identifying any high-pressure spots that could damage the object being clamped.

In conclusion, accurate measurement and control of clamping pressure are vital in many industrial processes. By using the right tools and understanding how to interpret their readings, you can ensure your clamping system is working effectively and producing high-quality results.

Practical Applications and Considerations of Clamping Pressure

Clamping pressure is a fundamental aspect in various fields, including injection molding, woodworking, and medical procedures. It involves the use of devices like hydraulic and mechanical clamps to apply force on an object to hold it in place. Understanding the principles of clamping pressure, its application, and considerations is crucial in achieving optimal results in these fields.

Injection Molding and Clamping Pressure

In injection molding, clamping pressure is a critical factor. The clamping force must be sufficient to keep the mold closed against the high-pressure injection of molten material. This pressure is controlled by hydraulic clamping or mechanical clamping systems.

The clamping pressure in manufacturing, particularly in injection molding, is calculated using the projected area of the custom part and the injection pressure. The clamping force calculation is essential to ensure that the mold halves are kept together to prevent flash, which is excess material that escapes from the mold cavity.

Woodworking and Clamping Pressure

In woodworking, clamping pressure is used in various processes, such as gluing pieces of wood together. The pressure applied must be enough to make the glue spread evenly, ensuring a strong bond. However, too much pressure can squeeze out all the glue, leading to a weak joint.

Woodworkers use special clamping devices, such as bar clamps and C-clamps, to apply this pressure. The clamp pressure adjustment is done manually, and the pressure distribution is usually checked by visual inspection.

Medical Applications of Clamping Pressure

Clamping pressure also has several applications in the medical field. For example, a Foley catheter is clamped to control urine flow. The pressure applied should be just enough to prevent leakage but not too much to cause discomfort or damage to the patient.

Similarly, in the case of a chest tube, clamping is done to prevent air or fluid from escaping. The clamp is usually placed close to the patient‘s chest to minimize the risk of tube dislodgement or kinking.

Considerations in Clamping Pressure

While applying clamping pressure, several factors need to be considered. First, the pressure must be sufficient to hold the parts securely without causing damage. This requires a good understanding of the material properties and the clamping mechanics.

Second, the pressure distribution should be even. Uneven pressure can lead to deformation or damage to the parts. Pressure sensors can be used to monitor the pressure distribution and make necessary adjustments.

Lastly, the clamping system should be reliable and easy to use. In high-force clamping applications, hydraulic systems are preferred due to their high power and ease of control. However, for less demanding applications, mechanical clamping may be more cost-effective.

In conclusion, clamping pressure plays a crucial role in various fields. Understanding its practical applications and considerations can help in achieving optimal results. Whether you’re an injection molder, a woodworker, or a medical professional, mastering the principles of clamping pressure and pressure management is key to your success.

Defining Clamping Pressure

Clamping pressure, a fundamental concept in physics and engineering, is the force applied by a clamp to hold or secure objects together. This pressure is crucial in various applications, including injection molding, woodworking, and mechanical and hydraulic clamping systems.

In the context of injection molding, clamping pressure is the force exerted by the clamping unit to keep the mold closed during the injection of the molten plastic. It’s a critical parameter in the molding process, as it directly impacts the quality of the final product.

In woodworking, clamps apply pressure to hold pieces of wood together while glue dries or during cutting operations. The clamping pressure must be distributed evenly to ensure a secure bond without damaging the wood.

Clamping Pressure Definition

Clamping pressure can be defined as the force per unit area applied by a clamping device to hold or secure objects together. It’s measured in units of force per unit area, such as pounds per square inch (psi) or Newtons per square meter (N/m²), also known as Pascals (Pa).

For example, if a clamp applies a force of 50 Newtons over an area of 0.01 square meters, the clamping pressure would be 5000 Pascals.

Clamping Pressure Unit

The standard unit of clamping pressure in the International System of Units (SI) is the Pascal (Pa), equivalent to one Newton per square meter (N/m²). However, in certain industries like woodworking or injection molding, pressure may also be expressed in pounds per square inch (psi).

Pressure Unit Equivalent in Pascals (Pa)
Pascal (Pa) 1
Pound per square inch (psi) 6894.76

Clamping Pressure in Different Applications

Injection Molding Pressure

In injection molding, the clamping pressure must be high enough to prevent the mold from opening due to the high pressure of the injected plastic. However, excessive pressure can damage the mold or the machine. Therefore, pressure control and regulation are critical in this process.

Hydraulic and Mechanical Clamping

Hydraulic clamping systems use the principle of Pascal’s law, where pressure applied to a fluid in a confined space is transmitted equally in all directions. This allows for even pressure distribution and high-force clamping, which is beneficial in heavy-duty applications.

On the other hand, mechanical clamping devices, such as screws and wedges, rely on mechanical advantage to generate clamping force. The pressure applied depends on the force exerted and the area over which it is distributed.

Clamping in Woodworking

In woodworking, clamps are used to hold pieces of wood together securely. The clamping pressure should be sufficient to hold the pieces in place without causing damage. Woodworkers often use special clamping tools to distribute the pressure evenly and prevent marks or dents on the wood.

Clamping Pressure Calculation

The clamping pressure can be calculated using the formula:

Clamping Pressure = Force / Area

Where:
– Force is the total force applied by the clamp, measured in Newtons (N) or pounds-force (lbf).
– Area is the contact area over which the force is distributed, measured in square meters (m²) or square inches (in²).

For example, if a woodworker applies a force of 100 N using a clamp over an area of 0.02 m², the clamping pressure would be 5000 Pa or 0.725 psi.

Pressure Measurement and Management

Pressure sensors are often used in clamping systems to monitor and manage the clamping pressure. These sensors provide a signal proportional to the pressure, allowing for precise pressure control and adjustment. This is particularly important in high-pressure clamping applications, where accurate pressure management can prevent damage to the equipment or the workpiece.

In conclusion, understanding clamping pressure and its units is essential in many fields, including manufacturing, woodworking, and engineering. Proper pressure control and distribution can significantly improve the quality of the final product and prolong the lifespan of the tools and equipment.

Conclusion: The Role of Clamping Pressure in Various Applications

The Role of a Clamping Pressure Expert

As a physicist specializing in the mechanics of pressure and clamping systems, I’ve spent years studying the effects of clamping pressure in various applications. From injection molding pressure to hydraulic clamping, the role of clamping pressure is crucial in many industries, including manufacturing and woodworking.

Clamping pressure, defined by the force exerted by a clamping device, is a key factor in ensuring the stability and integrity of a workpiece. It’s the job of a clamping pressure expert to understand the mechanics behind clamping systems and to make sure that pressure is applied and distributed correctly. This involves a deep understanding of clamping technology, including mechanical clamping, high pressure clamping, and the use of pressure sensors.

Why is Clamping Pressure Important?

Clamping pressure is essential in many applications for a few reasons. First, it helps to hold a workpiece in place, preventing movement that could lead to inaccuracies or damage. In injection molding, for example, mold clamping is used to keep the mold closed under high pressure, ensuring the plastic fills and properly forms within the mold.

Second, clamping pressure, when applied correctly, can help distribute force evenly across a workpiece. This is particularly important in woodworking, where uneven pressure can cause materials to warp or break.

Lastly, clamping pressure is vital in pressure control and regulation. In hydraulic clamping systems, for instance, pressure management is crucial to prevent system failure or damage to the workpiece.

How Much Clamping Pressure is Necessary?

The amount of clamping pressure to apply can vary greatly depending on the specific application. For instance, in injection molding, the clamping force must be high enough to keep the mold closed against the high pressure of the injected plastic.

In woodworking, however, too much pressure can damage the material. Woodworkers often use special clamping devices and techniques to apply just the right amount of pressure. They also use pressure measurement tools to ensure they’re within the safe range for their materials.

Understanding the Right Amount of Clamping Pressure

Determining the right amount of clamping pressure involves a combination of experience, understanding of the material and process, and sometimes, calculations. For example, in mechanical clamping, the clamping force calculation is often used to determine the optimal pressure.

In general, the goal is to apply enough pressure to hold the workpiece securely without causing damage. This involves understanding the properties of the material, the requirements of the process, and the capabilities of the clamping system.

In conclusion, clamping pressure plays a vital role in a wide range of applications. Whether it’s holding a workpiece steady during a process, ensuring even pressure distribution, or regulating system pressure, understanding and correctly applying clamping pressure is crucial. As a clamping pressure expert, it’s my role to ensure that this important aspect of many processes is understood and applied correctly.

Frequently Asked Questions

What is clamping pressure in injection molding?

Injection moulding
Image source CC BY-SA 4.0: ariel cornejoInjection molding diagram

Clamping pressure in injection molding refers to the force applied to the mold to keep it closed during the injection process. This is crucial to prevent the mold from opening due to the high pressure of the injected plastic.

How to measure clamping pressure?

Clamping pressure can be measured using specific tools such as a clamping pressure gauge or sensor. These tools provide a precise measurement of the pressure exerted by the clamp on the object being clamped.

Why is clamp pressure important?

Clamp pressure is important because it ensures that the parts being clamped are held securely in place. In processes like injection molding or gluing, adequate clamp pressure is necessary to prevent defects and ensure a high-quality result.

How much clamping pressure is necessary for wood glue?

The necessary clamping pressure for wood glue varies depending on the type of wood and the size of the joint. However, a general rule is to apply enough pressure to ensure a thin, even spread of glue across the joint without causing the glue to squeeze out excessively.

What is the role of pressure control in clamping systems?

Pressure control in clamping systems is crucial to ensure that the right amount of force is applied. Too much pressure can cause damage, while too little pressure may not hold the parts securely. Pressure control allows for the adjustment of clamping force to suit specific requirements.

How to calculate clamping pressure?

Clamping pressure can be calculated using the clamping pressure equation or formula, which typically involves the area of the clamp and the force applied. It’s important to consult with a pressure expert or refer to specific clamping pressure calculation resources for accurate results.

What is the difference between hydraulic clamping and mechanical clamping?

Hydraulic clamping uses fluid pressure to generate clamping force, offering precise control and high force. Mechanical clamping, on the other hand, uses mechanical means like screws or levers to apply force. Each has its advantages and is used based on the specific requirements of the task.

What is meant by high pressure clamping?

High pressure clamping refers to clamping systems that apply a high amount of force. This is often necessary in industrial applications such as injection molding, where high pressure is needed to keep the mold closed during the injection process.

How does pressure distribution affect clamping?

Pressure distribution is crucial in clamping as it affects the quality of the end product. Uneven pressure can lead to defects or damage. Clamping devices and technology are designed to ensure even pressure distribution for optimal results.

What is the role of pressure sensors in clamping mechanics?

Pressure sensors in clamping mechanics are used to measure the amount of force being applied by the clamp. This information is crucial for pressure management, allowing for adjustments to be made to achieve the desired clamping force.

Globe Valve vs Gate Valve: Need to know Critical Facts

globe

Globe valves and gate valves are used for different applications. This article discusses about the topic globe valve vs gate valve in detail.

Globe valves are used for regulating the flow whereas the gate valve is used to completely shut off the flow. Lets see more differences in detail in further sections of this article.

What is a globe valve?

A globe valve is a type of control valve that is used for regulating or controlling the flow in a pipeline.

It is different from a ball valve. It consists of movable plug and a stationary ring seat fitted generally inside a spherical body.

globe valve vs gate valve
Image: Globe valve

Image credits: Wikipedia

What is a ball valve?

A ball valve is also a type of control valve that is used to regulate or control the flow in pipeline.

It is different from a globe valve. It has a hollow or perforated ball which is used for controlling the flow of fluid in the pipeline.

Where is a globe valve used?

Globe valve finds its applications in more areas than a gate valve does as it can be used for regulating flow and pressure as well.

Globe valves are most commonly used in plant piping. They can be used as a pressure relief valve or a check valve and they are also suitable for manual and automatic operations.

Which is better gate valve or ball valve and why?

A gate valve may be cheaper but it has many disadvantages over ball valve. So application wise, ball valve is superior than a gate valve. Although in high pressure applications, gate valve is desired more. Lets see why.

How do I know if my globe valve is open or closed?

A globe valve consists of a stem, bonnet and plug. The relative positions of these can determine whether the globe valve is open or not.

If the stem is completely inside bonnet, then the plug will rest on body where a hole is given for the water to flow. This means the globe valve is closed. If the stem rises from the bonnet then it is in open condition.

To open or close, one has to rotate the handle as done with screws.

Can globe valve be used for isolation?

First we need to understand what is isolation valve, it is simply a valve that can stop the fluid flow process to given location.

A typical globe valve can be used for lowering the pressure as well as isolation purposes. But globe valves show higher pressure drop than straight through valves (I.e ball valve, gate valve etc). So, a globe valve can be used for isolation when pressure drop is not a controlling factor of the flow.

Can a gate valve fail?

Absolutely yes. Every mechanical component has a life expectancy and so does a gate valve. Following are the cases where it can fail-

  • Most commonly it fails due to wear and corrosion.
  • Jamming of a gate valve takes place if not used for quite some time.
  • Freezing of bonnet can break the valve resulting in massive flooding.
  • Some amount of liquid can leak through the seats so that leakage factor has to be kept in mind.

When would you use a gate valve?

Normally gate valves are used when the liquids need to be shut off rather than being regulated.

Gate valves can be used in following scenarios-

  • When liquid needs to shut off.
  • When minor leakage of liquid is not an issue (eg. Heater circuits and sewer pipes etc.)
  • Low pressure applications where friction won’t be significant.

Can a gate valve reduce pressure?

Yes, a gate valve can reduce pressure if a bypass controller is attached to it.

The gate valves with larger diameters are fitted with a bypass controller. This way the pressure is reduced by a significant value before even reaching the valve itself. Pressure is reduced because in high pressure, the friction becomes a significant problem.

How can you tell if a gate valve is open or closed?

There is no visual indicator that indicates whether the gate valve is open or closed. However, the position of knob can be used to determine whether the valve is open or closed.

A gate valve consists of a knob which when rotated counter clockwise, opens the valve and closes when turned clockwise. As it opens the valve, knob rises up indicating that the valve is open and closed when the knob is resting on the bonnet.

Is globe valve a control valve?

A globe valve can be called as a control valve.

Globe valve can be used to regulate or completely stop the flow making it a control flow valve.

Is globe valve unidirectional?

Yes, a globe valve is unidirectional. Unidirectional means that it allows flow in only one direction, it cannot change the direction of the flow completely.

When compared to other valves, only gate valve is bi directional whereas globe and check valves are uni directional.

How do you free up a gate valve?

A gate valve can be jammed if not used over several years. It has to be tested after certain period of time else it will be damaged and we would not even know.

To open up a jammed valve, we can simply try moving the knob back and forth slowly with a plier. This way the jamming will open up gradually. Remember not to do it very fast else it might get damaged.

Can you adjust a gate valve?

It is very easy to adjust a gate valve or rebuild it again after dismantiling it. First we check the position till where the knob goes inside.

If the knob goes completely inside then the valve need not be fixed. If it goes upto only a certain length, then we will have to flush it out. Flushing means getting rid of excessive or unwanted materials lying inside the valve. This can be done by loosening one of the screws in the body.

What are the advantages and disadvantages of gate valve?

Each and every mechanical component has its own advantages and disadvantages.

The advantages of gate valves are-

  • They have very less fluid resistance–  The shape of this valve allows the fluid to flow with minimal fluid resistance.
  • They have a leak proof seal- The opening and closing mechanism of this valve are superior than shut off valves.
  • They have wide range of applications- Gate valves can be used for oils, steam or even granular solids like Alumina. They can be fond in a wide range of applications.
  • Gate valves are bidirectional- Unike globe valves, as discussed above, gate valves are bi-directional meaning they allow dual fluid flow directions.

The disadvantages of gate valves are-

  • The closing and opening speed of these valves is very slow– This particular disadvantage makes this valve undesirable for applications requiring rapid actions.
  • These valves can get scratches easily- Scratches may seem normal but eventually they grow and affect sealing capability of the valve.

How many turns does it take to open a gate valve?

Number of turns required for closing or opening a gate valve can be found out using the AWWA formula.

Number of turns is equal to three times the nominal valve size plus two or three turns of the operating nut.

For example 5 x 3= 15 plus 2 or 3= 17 or 18 turns.

Function of globe valve and gate valve

The function of globe valve and gate valve are given in the table as shown below-

Globe valveGate valve
Regulates, starts and stops the flow of fluid.Used for completely shutting off flow of fluids rather than regulating.
Can be used as ON/OFF valve.Used in heating circuits and sewer piping.
Can be used for throttling purposes.They are used with large pipe diameters because they are easy to construct.
Table: Functions of globe valve and gate valve

Globe valve types

The term globe doesnt necessarily mean that the valve will have a round shape. In addition to that, it comes in various types. They are-

  • Tee-This is the most common type of globe valve. They are used in throttling purposes. The horizontal design of the seat allows the stem as well as disk to travel perpendicular to the horizontal plane.
  • Angle-The name suggests that there is an angular turn inside this valve which is true. The ends of this valve are at ninety degrees allowing the flow to flow in a perpendicular direction to handle the slugging effect.
  • Wye-This valve is an alternative for high pressure drop found in globe valves. The angle between seat and stem are forty five degrees which provides a better flow path with lesser resistance to flow.

Globe valve vs butterfly valve

The differences between a globe valve and butterfly valve are given below-

Globe valveButterfly valve
The disc of the globe moves in a straight line.Butterfly valve has a plate shaped disc that rotates around its own axis.
Main parts are bonnet, stem, body and handwheel.Main parts are valve body, stem, butterfly plate and sealing ring.
Can be used for cutting off or regulating the flow of fluid.It is used for flow regulation mostly for throttling purposes.
Table: Difference between globe valve vs butterfly valve

How does a gate valve work?

These valves work by inserting a gate (mostly rectangular) or wedge between the path of flow. This plate is actuated by threaded stem which itself is actuated by hand or electric motor.

How does a directional valve perform in three functions?

A directional valve is designed to work only in three functions.

The three functions in which the directional valves work are- stop the fluid flow, start the fluid flow or change the direction of fluid flow.

How do you lubricate a ball valve?

Lubrication is necessary else the ball inside the ball valve will jam and the valve will be rendered useless.

We can lubricate the ball valve by spraying penetrating lubricant around the ball valve handle precisely between the coloured handle and the pipe portion of the ball valve. After applying lubricant, turn the knob back and forth so that the lubricant can pass through the tight crack and enter the body of the valve.

This way the lubricant can penetrate inside and lubricate internal components of the valve too.

How Does A Control Valve Work: Critical Insights And Facts

Pressure regulators

Control valves control the flow of fluid by reducing or increasing the cross section of the passage. This article discusses about how does a control valve work.

Control valves can stop, increase or decrease the discharge of the fluid. These valves find their applications in hydraulic as well as pneumatic systems. 

What is a control valve?

Control valves regulate the flow of fluid in the passage.

The applications may require different amount of discharge rate at different time. Valves are used to achieve this function.

How does a control valve control flow ?

The control valves regulate the pressure of the flowing fluid in order to change the discharge rates.

The cross section of the valve’s passage will reduce if one wants to reduce the flow rate and vice versa for increasing the flow rate.

Does a flow control valve reduce pressure?

In a high pressure system, the pressure can be reduced by using pressure reducing valves.

In pressure reducing valves, high pressure fluid enters the inlet and exits as low pressure fluid. It is done by restricting the flow downstream. Hence, we can say that a flow control valve can reduce pressure.

Which valve is best for flow control?

Many valves such as ball valves, globe valves, butterfly valves etc are used in industries out of which a globe valve is considered the best.

Globe valves are good at regulating the flow. They are used for throttling purposes. The opening and closing time of a globe valve is much shorter than other valves which makes this valve more desirable.

Can a control valve increase pressure?

Higher the flow rate through the valve, higher will be the pressure drop and vice versa.

While the pressure reduces downstream in pressure reducing valves, the pressure increases upstream.

Can ball valve be used for flow control?

Globe valves are the best type of valves for regulating the flow. Although ball valves can also be used to serve this purpose.

Opening and closing of ball in ball valve controls the flow. Ball is the main characteristic of ball valve. It can be closed, open or partially closed. Ball valves have an advantage over others because it is easier to tell whether ball valve is open or closed.

How do you choose a control valve?

A lot of characteristics are taken into account for choosing a control valve. Some considerations are noise, maintenance, cost and energy consumption. A good valve should serve most of the following-

  • Ability to regulate the rate of flow or throttle.
  • It should work with low turbulence.
  • Short opening and closing time as it can be used in emergency.
  • Tight seal that prevents leaks.
  • Opening at a pre set pressure.
  • It should be able to hold any corrosive materials to avoid rapid wearing.

What is a pressure regulator?

The type of valve that is used for controlling the pressure of the fluid to a desired value is called as pressure regulator.

Pressure is controlled by using a negative feedback from the controlled pressure. If the flow rate is high inside the valve then pressure drop will also be higher.

how does a control valve work
Image: (A) Pressure reducing regulator and (B) Back pressure regulator
Image credits: Peter SouthwoodPressure regulators schematicCC BY-SA 4.0

What are the types of pressure regulators?

There are mainly two types of pressure regulators used in industry. They are-

  • Pressure reducing regulator– As the name suggests, it is a valve that reduces input pressure to a desired one at the output. It is a open valve that is installed in upstream.
  • Pressure sustaining regulator– Unlike pressure reducing regulator, the pressure sustaining regulator maintains a set pressure at the input side by opening itself to allow the flow when it exceeds the set value.

How does a flow control valve affect pressure?

Generally, by controlling the pressure of fluid the flow of fluid can be controlled.

A higher flow rate through a restriction will result in greater pressure drop and similarly a lower flow rate will result in lower pressure drop. The pressure will be high upstream as the downstream pressure reduces.

What type of control is used to regulate the pressure of water?

Pressure of water can be regulated with the use of a certain type of valve. That valve is called as a water pressure regulator. It is also called as pressure-reducing valve.

It is a specialized plumbing valve which reduces the pressure coming into inlet. It is not needed everywhere but if the pressure of water from municipal corporation is high then a water regulator must be used in order to reduce the pressure.

How does a water pressure regulator work?

A water pressure regulator will look like a dome shaped device that would be situated near the mai shut off valve where the main water line enters the house.

It has a spring loaded mechanism for regulating the pressure of the water. A diaphragm is attahced at the end of spring which widens and narrows depending upon the amount of water coming inside the valve.

A water pressure regulator protects the inner valves of appliances as there will be less stress on them.

Mathematically,

F = Pi – Po + PoS + f

Where,

F is diaphragm spring force

f is poppet spring force

Pi is inlet pressure

Po is outlet pressure

s is poppet area

S is diaphragm area

What are the different types of pressure reducing regulators?

The pressure reducing regulators can be classified on the basis of number of stages through which water is passing. They are-

  • Single stage regulator– As the name suggests, the water passes through a single stage. When operating with this type of valve, the outlet pressure starts climbing when the supply pressure gets low.
  • Double stage regulator– In this type of regulator, the water passes through two stages. The first stage has a pre set value of pressure, so the inlet pressure gets converted to this pre set value. The next stage is variable that is user can control the pressure of the fluid by knob. This way the user can achieve the desired pressure just by rotating the knob.

The pressure gauges on the regulators show the magnitude of pressure of flowing fluid.

Installation tips on water pressure regulator

The best location of installing a water regulator is beside the main shutoff valve controlling the water coming into inlet.

This location is desirable because it makes it easy to quickly shut off the control valve and allows the regulator to protect all the pipes present in the system.

If the regulator needs to be replaced then it is easier to replace it with the same brand and model because it will have the examct dimensions as the previous one.

Maintenance of water pressure regulator

Like every mechanical component needs maintenance after some point of time, water pressure regulators also need maitenance for their smooth operation.

If water hammering takes place or other inconsistencies take place then it is a sign or symptom that pressure regulator is not working properly. It is always recommended to test the regulator at least once a year or whenever there is a slight noticeable change in regulator’s effectiveness. If the adjustment screw’s movement has no effect in changing the pressure then it can be concluded that it should be replaced.

Too much water pressure in the system can cause water hammer to occur in walls or sometimes burst pipes of the system.

What are the factors to consider when selecting a control valve?

Many factors are considered while selecting a control valve. If not considered, the system may work inefficiently. The major considerations are-

  • A valve should have a good throttlability and should be able to control the rate of flow.
  • The operation should not be turbulent.
  • The valve should have a shorter opening and closing time.
  • The valve should be able to tighten properly to avoid leaks through the system.
  • It should be able to open at a pre set pressure.
  • It should be able to handle abrasive fluids.

What are the three types of control valves used in hydraulic systems?

Hydraulic systems can be broadly classified into three types. These three types are- flow control valves, pressure control valves and directional control valves.

  • Directional control valves-Directional control valves can start, stop or change the flow of direction of the flowing fluid. Most commonly used directional valves include directional poppet valves, directional spool valves and check and non return valves.
  • Pressure control valves-Pressure control valve use throttling to regulate the flow of fluid. They switch at pre determined pressure setting. Examples of pressure control valves are pressure valves relief function, pressure valves fixed function, pressure valve reducing functions etc.
  • Flow controlled valves-Flow control valves increase or decrease the area of throttling point to control the flow of fluid. Examples of flow controlled valves are pressure compensated valves, throttle valves etc.

What is CV value of control valve?

CV value of a control valve or Value flow co efficient of a control valve is defined as the ratio of capability of flow of a control at fully open conditions to the pressure drop taking place through the valve.

This particular value is significant as it is the only standardized selection method for control valve sizing which is why it is used throughout the industry.

Mathematically,

Where,

Q is the flow in gallons per minute

G is the specific gravity of fluid

Del P is differential pressure over valve.

Control Valve Uses: Critical Insights and Facts

This article discusses about control valve uses. Control valve as the name suggests, controls the flow rate and related properties of flowing fluid such as pressure and temperature.

What is a control valve?

As discussed above, a control valve is a device that controls the flow rate and related properties such as pressure and temperature.

The control action takes place as directed by the signal from controller. It opens and closes which helps in controlling the fluid flow in the passage.

control valve uses
Image: Globe control valve
Image credits: Pl_control_valve.GIF: Rafał Rygielski derivative work: User A1 (talk), Pl control valveCC BY-SA 3.0

What are different types of pressure control valves?

Pressure control valves are most commonly found in every hydraulic and pneumatic system.

The different types of pressure control valves used in industries are as follows-

  • Pressure relief valves– Usually the hydraulic system and pneumatic systems work in a specified pressure range. When the pressure goes beyond this range, that is when relief valves come into picture. They avoid the components from getting damaged by controlling the pressure differential.
  • Sequencing valves- If the circuit has more than one actuators then it is necessary for these actuators to move in a sequence. This can be achieved by using limit switches, timers or digital control devices with sequencing valves.
  • Pressure reducing valves– The name itself implies that these valves are used for reducing the pressure of the fluid that is flowing. This ca be achieved in a single stage as well as two stages depending upon the application. This provides a better repititive accuracy. In hydraulic applications, there may be blockage of flow due to oil contamination.
  • Counter balance valves– Counter balance valves are not used directly, they are used passively. That means they are closed valves which maintain a set pressure in certain portion of a flowing circuit. This is done usually to achieve counter balancing of weight. The design of this valve is perfect for counter balancing an external force or counter act a weight as in a press to keep it from free falling.

What is a directional control valve?

Directional control valves or DCVs are the most important parts in both hydraulic and pneumatic systems.

Directional control valves allow the fluid to flow in different passages from one or multiple sources. These valves are actuated by the action of a spool whose position restricts or permits the flow of fluid.

What is a spool in directional control valve?

Spool is responsible for controlling the fluid flow.

It is used to regulate/control the flowing fluid and connects internal passages and port. Its design includes lands and undercuts which are encased in precisely machined housing. The lands and undercuts will open and close flow paths once the spool shifts.

Classification of directional control valves

The classification of directional control valves or DCVs is done as follows-

  • According to number of ports– Depending on the number of ports, directional control valves are classified as 2-way, 3-way or 4-ways valves.
  • According to type of spool– Depending on the type of spool used, they are classified as poppet, rotary and sliding valves.
  • According to actuating method used– The position of the valve is changed by the actuating the handle which can be done manually, mechanically or electronically.

Directional Control Valve benefits and features

The features of directional control valves make them beneficial for industries to use them.

The features and benefits of directional control valve are as follows-

  • Custom porting is available.
  • It is light in weight as aluminium is used for construction.
  • Blocked, open and power beyond options are available.
  • High flow options are also available.

Directional control valve uses

Hydraulic directional valves are used in many agricultural and Mobile industries to have smooth operation and low pressure drop.

The directional control valves are used in many applications such as-

  • Car carriers
  • Machinery
  • Assembly line
  • Energy production
  • Construction machines
  • Material handling cranes
  • Trucks and rigs

What are the things to be considered while choosing a directional control valve?

The following points should be considered while analyzing the performance of a directional control valve-

  • Dynamic power limit.
  • Static power limit.
  • Resistance to flow
  • Switching time
  • Leakage

What is a differential pressure control valve?

Differential pressure valves or DPCVs are valves that are used in heating or cooling systems to regulate sub-circuit pressure to desired or given maximum.

A differential pressure control valve reduces energy consumption, provides silent operation and has simple commissioning process.

How does a differential pressure control valve work?

A differential pressure control valve includes a capillary tube, spring and a diaphragm.

A DPCV controls or regulates differential pressure in the circuit depending on the impulse of pressure coming from the inlet and direct pressure from the outlet side. The spring force will be equal in magnitude as the differential pressure force across the circuit.

Differential pressure control valve uses

Differential pressure control valve sets the differential pressure in the circuit to a maximum due to which we get following uses of differential pressure control valve-

  • Extremely efficient
  • Reduces noise and provides a silent operation.
  • Reduces energy consumption.
  • Makes the commissioning process less complex.
  • As they are pressure relieved so low force actuators can be used.
  • Keeps high controllablity in the system.
  • Reduces pump head.

What is PICV?

PICV stands for Pressure independent control valve.

These valves are used in heating applications where differential pressure exists, by adding an actuator these valves act as flow limited control valves that balances the system and hence provides the best possible indoor comfort and energy efficiency.

What are the features and benefits of pressure independent control valves ?

PICV provides similar features and benefits as that of DPCV.

The features and benefits of pressure independent control valves are-

  • Stable room temperature– It eliminates the overflow situations at partial load conditions that helps in maintaining stable room temperature.
  • Improved indoor comfort– As the room temperature becomes more and more stable, the indoor comfort increases. The desired temperature is accurately met which also increases the productivity of employees.
  • Energy savings– A perfectly balanced system increases the energy savings and cost savings.
  • Reduced maintenance costs– As these valves ensure perfect working conditions, the actuators require few movements which in turn reduces the need of maintenance.