9 Radioactive Isotopes Examples: Detailed Explanations

Radioactive isotopes eventually decay, or disintegrate, to harmless materials. Some isotopes decay in hours or even minutes, but others decay very slowly.

Radioactive Isotopes Examples are listed below:

Radioactive isotopes are unstable isotopes of chemical elements which have different atomic mass than defined by the periodic table.

Strontium-90 and cesium-137 have half-lives of about 30 years (half the radioactivity will decay in 30 years). Plutonium-239 has a half-life of 24,000 years.

The unstable radioactive isotopes decay emitting alpha, beta or gamma rays to form the stable nuclei or sometimes another unstable nuclei or radionuclei as it is commonly called. The decay times of a radionuclei vary widely and it is designated by its half-life.

Around 2400 radionuclei have half-lives less than 60 minutes, most of which are produced artificially. A few of the radionuclei have very high half-lives ranging above 100 million years such as Uranium and thorium. They can occur both naturally as well as synthesized artificially.

Radioactive Isotopes Examples Detailed Explanations

Examples of radioactive isotopes and their usage can found in almost all fields of modern science, whether it is medicine, biology, food preservation, mining, industrial applications, astronomy, particle physics etc.

Tritium

The lightest radioactive isotope is of hydrogen, which has a mass number of 3 and called Tritium. It has 2 neutrons in its nucleus and one proton. Tritium is naturally occurring isotope, which means it forms naturally by means of cosmic rays which fall on the nitrogen molecule breaking it to form tritium. Tritium is also formed in nuclear reactors carrying out fission reaction as by products or through various nuclear weapon explosions. It has a half life of around 12.3 years. It is also available in nature in very small amount. Reacting with oxygen it converts into water form and being a part of the food chain.

Carbon-14

Carbon-14 is the radioactive isotope of carbon having 6 protons and 8 neutrons. By far the most common use of carbon-14 is in archaeological dating. The time of death of an organism can be estimated easily by determining the quantity of carbon-14 available in a dead organism. The interaction of cosmic ray and nitrogen atoms results the formation of carbon-14 naturally in the atmosphere.

Carbon dioxide formed from carbon-14 is absorbed by plants and passed on to the food chain. The carbon-14 in an organism is continuously being replenished till the organism is alive and its quantity starts to reduce by emission of beta rays. It has a half life of around 5700 years. 567px-Carbon_exchange_reservoir_2.svg.png

radioactive isotopes examples
Carbon Exchange in Nature; Image Credit:wikipedia

Cobalt-60

Cobalt 60 is an isotope of cobalt. It doesn’t form naturally can be produced artificially by bombarding a cobalt-59 source by slow neutron source and by nuclear reactor operations. Cobalt-60 decays by emitting gamma rays, with a relatively high intensity. Cobalt-60 when ingested is partly excreted in faeces but some amount of it is also absorbed by kidney and liver which leads to development of cancer cells.

External exposure to high level of gamma radiation emitted by cobalt-60 also causes skin burns, acute radiation sickness and death. It has a half life of 5.3 years.

Iodine-129

Iodine-129 occurs naturally in small quantity but it has gained notoriety because of its formation during nuclear weapon testing and by product of nuclear fission reactors along with its very long half life extending to millions of years.

The long half life of iodine-129 makes it suitable for dating of meteorites and ground water. Iodine is normally absorbed by the thyroid gland and is used to produce hormones. Radioactive iodine is ingested by human, it would be absorbed by thyroid glna d leading to thyroid cancer.

Iodine-131

Like Iodine -129, Iodine-131 too is produced as by product of nuclear fission and nuclear weapon testing. Commercially it is produced from neutron irradiation of naturally occurring tellurium. It has a half life of around 8 days and hence considered less dangerous than iodine-129. Exposure to Iodine-131 has same impacts as that of Iodine-129.

Thorium-232

Thorium-232 is an isotope of thorium element and it has the longest half life among the radionuclei of more than 14 billion years and hence it occurs naturally. It undergoes alpha decay to form radium- 228. Among the isotopes of thorium, thorium-232 is the most abundant.

Thorium-232 can be converted to Th-233 by capturing a neutron which is unstable. Thorium-233 produces fissile isotope uranium-33 by undergoing two consecutive beta decays.

Uranium-235

Uranium-235 exits naturally and hence it is called primordial radioactive isotope. The abundance of U-235 in the predominant isotope U-238 is around 0.7%. Uranium-235 is fissile, i.e. it can sustain a nuclear chain reaction and hence it is the predominant fuel in nuclear reactors around the world. It has a half life of around 700 million years.

Plutonium-239

Plutonium is one on the three fissile radioactive isotopes which can be used for both nuclear weapons as well as in nuclear reactors. The other two being uranium-235 and uranium-233.

Among the fissile radioactive isotopes, plutonium-239 has smallest critical mass:- which can be explained as the minimum amount of fissile material to sustain  nuclear fission reaction. Plutonium-239 can be synthesized in nuclear reactor from uranium-239 and it has a half life of more than 24000 yea

Xenon-135

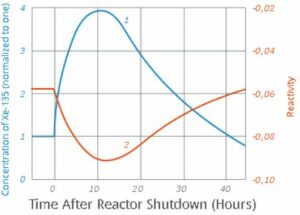
Xenon-135 isotope is formed in the nuclear reactors in the fission reaction of Uranium-235. It is an unstable isotope having a half life of 9.2 hours. In the U-235 nuclear reactors, it acts a reaction poison by virtue of its neutron absorbing capability.

In fact, Xenon-135 is strongest known neutron absorber and the uranium fission reaction yields around 6% Xenon-135, which temporarily slows down and inhibits the nuclear reaction as it starts building up the core.

The phenomenon of decrease in reactivity Uranium reactor due to build-up of Xenon-135 is called iodine pit. The name iodine is derived from the fact that, in the uranium decay chain, Xenon-135 is formed by beta decay of Iodine-135.

Radon-222

Radon-22 is the isotope of radon gas. It is formed in the decay chain of uranium-238, the most abundant of uranium isotopes. Radon-222 thus occurs naturally. The immediate precursor to Radon-22 in U-238 decay chain in radium-226. It has a half-life of 3.2 days.

Owing to its natural origin and occurrence and being gaseous in nature, the risk of radiation exposure to general public is high for radon-222. It can form in the soil and rock beneath from decay of uranium-238 and permeate through openings and cervices to the buildings above. Long term radiation exposure to Radon-222 causes lung cancer.

Radioactive Isotopes Uses

Radioactive isotopes find use in various fields primarily being Energy, archaeology and medical sciences.

Over the years, radioactivity and radioactive isotopes found use in various fields.The various uses of radioactive substances can be broadly classified as follows:

  • Nuclear Energy and Weapons
  • Radiocarbon and  Surface Exposure Dating
  • Medical Use and research
  • Industrial Use

Radioactivity as a phenomenon was discovered towards the end of 19th of century; however it attained worldwide attention upon its use in manufacture and use of nuclear weapons during World War II.

Nuclear Energy and Weapons

Radioactive isotopes can produce nuclear energy by means of nuclear fission reaction and those radioisotopes which can sustain a nuclear fission chain reaction are called fissile.

 The commonly used radioisotopes for this purpose are Uranium-233, Uranium-235 and Plutonium-239. The energy produced by nuclear fission can be utilised to produce electricity in a nuclear power plant, power naval submarines or manufacture nuclear war heads to be used in missiles.
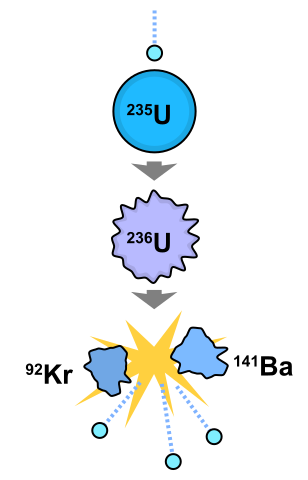
308px Nuclear fission.svg 1
Nuclear Fission; Image Credit:wikipedia

Radiocarbon and Surface Exposure dating

Radiocarbon dating and exposure dating both dating technologies are utilised to determine the age of an object.This is because, when an organism is alive, its carbon-14 component is in equilibrium with that present in the environment as the organism continuously exchanges carbon though food in case of animals and through photosynthesis in case of plants.

As the organism dies, carbon -14 starts radioactive decay with a half life of around 5700 years. So by measuring the amount of carbon-14 left in a dead tree trunk or a piece of bone, the period when the organism was living can be determined.

Surface exposure dating is utilised to determine the exposure of a rock or a surface to the atmosphere or how long it has been kept buried.

A number of radioactive isotopes such as Beryllium-10, Aluminium-26, Iodine-129, calcium-41 etc are formed by interaction of cosmic rays with its parent isotope. So by measuring the amount of these radioisotopes in rock or water samples, its age can be determined.

Medical Use and research

Radioactive isotopes finds numerable use in medical and biomedical research fields from medical treatment in form of nuclear medicine, diagnosis to study of cellular function and bone formation in animals.

In medical field, Iodine-123 and Iodine -131 are utilised for treatment thyroid disorders, while Iodine-125 and Iodine-129 are used for diagnosis of thyroid disorders. Radioisotopes Cesium-137, Cobalt-60 and Copper-67 are used for treatment of cancer.
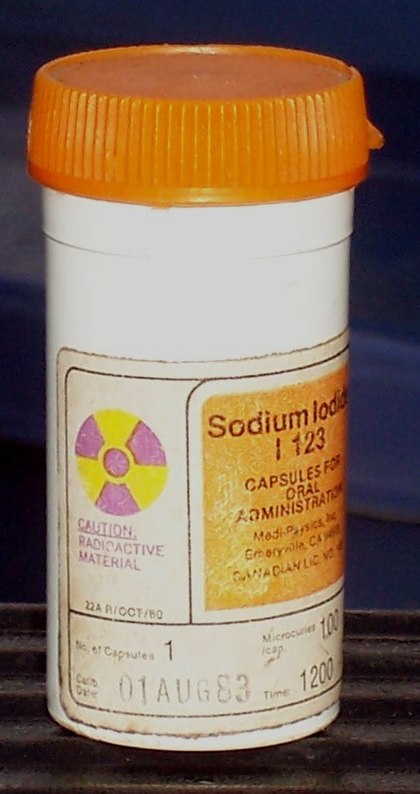
420px Lead container for nuclear medications
Lead container for iodine-123 capsule; Image credit: wikipedia

Radioisotopes Phosphorus-32 and Phophorus-33 are utilised in molecular biology and genetics research. Others such as Selenium-75 and Strontium-85 are utilised in various studies of life sciences like bone formation, metabolism etc.

Industrial Use

Radioactive isotopes find wide range of industrial use.

Iridium-192 is used to check the weld integrity of pipelines, vessels, aircraft parts etc. Amricum-241 is used in the smoke detectors. Californium-252 is used to check for hidden explosives in luggage at airport.

Radioactive Isotopes Types

Radioactive isotopes can be broadly classified into two types: – naturally occurring and synthetic

Naturally occurring radioactive isotopes are those, which occur naturally and whose traces can be found on the environment and they were not created due to any human activity.Synthetic radioisotopes are those that are formed either as a by product of nuclear fission reaction or synthesized deliberately in nuclear reactors and particle accelerators.

Naturally occurring radioactive isotopes can be further classified to: Primordial, Secondary and Cosmogonic isotopes.

Primordial radioactive isotopes are those that were formed with the formation of universe and their half lives are so large that complete decay to daughter isotopes has not been completed. Hence, they can be found in nature, like the isotopes of Uranium and thorium.

Secondary radioactive isotopes are those, which are formed by radioactive decay of primordial radioactive isotopes. These are intermediate radioactive isotopes in the decay chain of primordial isotopes, e.g. polonium and radium.

Cosmogonic isotopes are those which are formed by the impact of cosmic rays on a stable element. For example radioisotope carbon-14 is formed by impact of cosmic rays on nitrogen.

Synthetic radioisotopes are also produced due to nuclear explosions that were carried out in the past.

Some of the examples of synthesized radioactive isotopes are plutonium-238, plutonium -239, Americium-241, Gadolinium-153 etc.

Radioactive Isotopes Properties

The chemical properties of a radioactive isotope are similar to that of the non-radioactive stable isotope of the same element; however it is unstable because of excess nuclear energy.

The nucleus of a radioactive isotope has an extra neutron and hence has higher atomic mass but having the same number of electrons as that of the stable isotope. Since chemical reaction depends upon the electrons, chemical properties are same for all isotopes of an element.
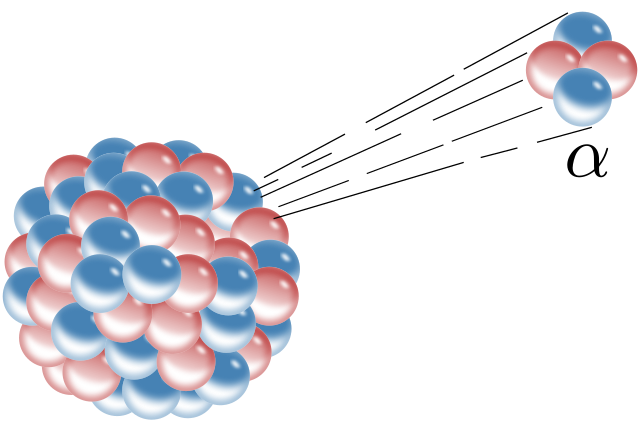
640px Alpha Decay.svg
Alpha Decay; Image credit: wikipedia

The excess energy of a radioisotope is released by means of alpha, beta or gamma radiation decay. The radiation decay of a radioisotope results in formation of isotope of another element or same element, which can either be a stable or an unstable isotope. If the resultant isotope is unstable, further decay takes place until it becomes a stable element. The simultaneous decay of an unstable radioactive isotope is also called its decay chain.
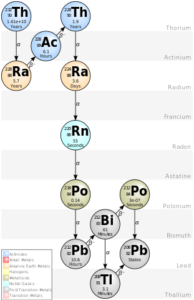
311px Decay Chain Thorium.svg 1
Decay Chain of Thorium; Image Credit:  wikipedia

All radioactive isotopes are defined by their half-life or amount of time it requires to decay to 50% of its original mass. The half-life of radioisotopes are specific to a isotope and this property is utilised for various scientific studies raging from age dating of dead organic material to exposure dating of rocks, groundwater etc.

Some radioisotopes have a half life of few seconds to minutes, while other have half life as large as age of universe
How To Calculate Pressure Difference: What, How, Examples

“How to calculate pressure difference?”, in this article we will try to find the answer for this question. Also we will discuss about different pressure difference measuring devices.

Pressure difference also known as pressure gradient or differential pressure is the difference between two measured pressure values or it is the comparison of two arbitrary pressures.

Pressure difference is calculated in different industries in day to day basis for flow and filtration of various fluids through pipelines.

Pressure difference or differential pressure ΔP is the difference between any two applied pressures, generally all pressure readings can be assumed as differential reading as, in case of absolute pressure, in relation to vacuum pressure and gauge pressure in relation to atmospheric pressure.

justus menke hwHJrWIh5SM unsplash 1
Water Pressure; Image Credit:unsplash
istockphoto 466029458 612x612 1
High Pressure Pipe Leaking; Image Credit:unsplash

What Is Pressure?

In simple word, pressure is the force exerted over a given area.

Pressure is defined as the force per unit area.

Pressure=Force/Area

Where Force(F) is in Newton

And Area(A) is in meter2

Therefore Pressure,p=F/A Newton/metre2 or Pascal.

 Pressure increases as we move down from the liquid surface, the pressure is always greater for denser medium. Manometer and Barometer are the measuring instruments used to measure pressure.

how to calculate pressure difference
Pressure as exerted by particle collisions inside a closed container; Image Credit:wikipedia
200px Pressure force area.svg
Pressure=Force/Area; Image Credit: wikipedia

What is Pressure Difference?

Pressure Difference is calculated in regular intervals or continuously in different industries like chemical plants, refineries, petrochemical plants etc.

Pressure Difference is the difference between pressures when they are measured in different points. Pressure Difference calculations are done regularly in various industries for flow and level measurement of fluids, filter monitoring and clog detection. Pressure difference is measures in Pound per Square Inch(PSI).

This simple concept of pressure difference acts as a vital concept in process industries because it is responsible for the flow of a fluid from one point to another. Pressurization of airplane cabins is one of the most appreciated application of Pressure Difference.

istockphoto 908299346 170667a
Pressure device for industry system; Image Credit:unsplash

Pressure Difference is continuously monitored in industries to know whether there is any clog or contaminates through a pipeline.

If a part of a pipeline gets clogged, there is a change in pressure which makes a change in Pressure Difference, an operator can easily detect the exact blockage point and clean the pipeline to ensure the smooth flow of the fluid.

For a maximum value of pressure difference, we may have to change the filter otherwise it may lead to damage or corrosion.

To determine the respiratory flow in medical devices, air flow blockages in different devices, clogged filter detection in extractor fans, air conditioner, exhaust ducts are the examples of applications where Pressure difference monitoring plays an important role.

Hydrostatic Pressure Difference

Hydrostatic Pressure Difference is specific measurement of liquid pressure above a vertical datum at different points or at different heights from the datum line.

The pressure of a liquid at rest at a certain depth due to gravitational force is known as Hydrostatic Pressure and hydrostatic pressure increases as the depth measured from the surface increases because of the increasing weight of the fluid exerts more downward force on the lower liquid layers.

800px TorricelliLawDiagram.svg
Hydrostatic Pressure at different depths; Image Credit: wikipedia

The formula used to calculate hydrostatic pressure is shown below:

p=ρgh

Where,

P is the pressure exerted by the liquid in Nm-2

ρ is the density of the liquid in kgm-3

g is the acceleration due to gravity considered as 9.81 ms-2

h is the height of the fluid column in ‘m’

A swimmer experiences more pressure as he goes deeper underwater because of the more and more weight on the top as well as the air above him.

How to Calculate Pressure Difference?

.Differential Pressure Gauges and Differential U-tube Manometer are used to calculate the pressure difference between two points of same liquid or different liquids.

Differential pressure gauges consists of two inlet ports, each port is connected to one of the pipes or sources whose pressure is to be monitored.

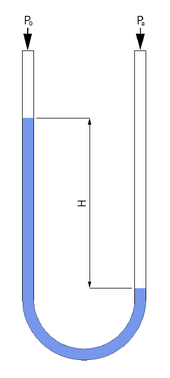
U tube manometer is a device used to measure the pressure difference between two points which may be in the same pipe or in two different pipes. As the name suggest it looks like the alphabet U, the bottom portion of the glass tube is filled with heavy liquid like mercury, water and air are also used as per requirement.

330px Mercury pressure gauge.svg
Differential Mercury Manometer; Image Credit:wikipedia
Manometer anim 01
A pressure gauge in action ; Image Credit:wikipedia

Differential Pressure gauge performs the mathematical operation of subtraction through mechanical means, If there is a pressure difference in both the pipes or sources, the pressure exerted on one measuring element is more than the pressure exerted on another chamber element,then the Differential Pressure gauge shows deflection.

How to Calculate Pressure Difference in Manometer?

Pressure Difference between two pipes or sources is calculated by using Differential U-type Manometer.

A Differential manometer is a device used to compare the pressures in two different pipes or containers from the vertical distance from the surface of a liquid in two limbs when each of the limbs are connected to two different sources.

170px Utube
U-tube Manometer; Image credit: wikipedia

To determine the difference in pressure, multiply the difference in height by the density of the fluid and the acceleration due to gravity. The final units should be in pascals.

How to Calculate flow rate from pressure difference?

Bernoulli’s Equation gives a relationship between the Pressure Difference and the Flow of a fluid, using this relation we can easily calculate the amount of fluid flowing within a time interval.

The Bernoulli’s Principle applicable for incompressible fluids(with negligible viscosity) states that an increase in a speed of a fluid moving in a streamline occurs with a decrease in static pressure of the fluid. In simple words, static pressure+ dynamic pressure=total pressure which is constant.

VenturiFlow
Flow of fluid through a venturimeter; Image Credit:wikipedia
2000px BernoullisLawDerivationDiagram.svg
Flow of fluid through a venturimeter; Image Credit:wikipedia

Bernoulli’s Principle can be expressed in terms of a mathematical formula as below:

Where v=fluid speed

g = acceleration due to gravity considered as 9.81 m.s-2

y=height above datum line

p=pressure of the fluid

ρ = density of the fluid

Now considering any two points in the liquid,

Now g is same at both the points,

gif

Since the fluid is considered as incompressible,

gif

From Continuity Equation, v1A1 = v2A2

From Eq(2),

gif.latex?v%20 %7B2%7D%3D%20%5Csqrt%7B2%5Cfrac%7B%5Cfrac%7B1%7D%7B%5Crho%20%7D%28p %7B1%7D p %7B2%7D%29+g%28y %7B1%7D y %7B2%7D%29%7D%7B%281 %5Cfrac%7BA %7B2%5E%7B2%7D%7D%7D%7BA %7B2%5E%7B2%7D%7D%7D%29%7D%7D......

From Eq(3) we can calculate flow rate(Q=Area x average velocity) through the duct using pressure difference p1 – p2

Measurement of amount of fluid flows within a time interval is quite important in a process industry for the smooth and safe running of different operations.

Hagen Poiseuille equation gives the relationship between pressure drop and flow rate of a fluid through a long cylindrical pipe. The equation is applied for laminar flow of incompressible liquid flowing through a pipe of constant cross sectional area.

gif

Where Δp is   the pressure difference between the two ends of the pipe

L is the length of pipe,

μ is the dynamic viscosity,

gif

is the volumetric flow rate,

R is the pipe radius,

A is the cross section of pipe.

How to Calculate Pressure Difference in Venturi meter?

A venturimeter is a type of flow meter where volumetric flow rate of a fluid is determined on the basis of Bernoulli’s theorem.

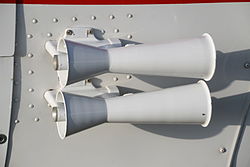
When a fluid passes through a venturimeter, it accelerates in the convergent part and then decelerates in the divergent part. The pressure of fluid is different throughout the venturimeter and the Pressure Difference is obtained from the Manometer reading. Using this estimated pressure difference and applying Bernoulli’s equation and Continuity equation, volumetric flow rate is calculated.

how to calculate pressure difference
Venturimeter; Image Credit: wikipedia
250px Aircraft venturi 1
Venturimeter; Image Credit: wikipedia
gif
gif
gif
gif

To know about Flow Rate(click here)

Adiabatic Turbine: What, How, Several Types, Examples

Dampfturbine Montage01 251x300 1

This article discusses about adiabatic turbine. The term adiabatic is often used in the field of thermodynamics. It refers to a system or boundary which does not allow heat transfer to take place.

A turbine is an essential device used in power plants which assists in generation of electricity. It contains elements that rotate. This rotation is transferred to generator which generates the electricity. We will study more about adiabatic turbines in this article.

What is an adiabatic system?

The system from which transfer of heat is restricted is called as adiabatic system. That is the heat cannot be transferred to surroundings and the heat cannot enter the system from surroundings.

The net heat transfer is zero. This is because of the walls of the system are adiabatic. Heat is not allowed to be transferred from the system. The entire content of heat remains inside the system only which becomes the internal energy of the system.

What is a turbine?

A mechanical device that is used to convert hydraulic energy to mechanical energy is called as turbine. The hydraulic energy comes in the form of moving water/steam which hits the propellers of turbine.

The movement of fluid that is the kinetic energy of fluid is transferred to the propellers of turbine. Because of this reason the shaft of turbine start rotating. This way the conversion of energy takes place from hydraulic to mechanical. Further sections will tell us more about turbine in detail. 

Working of turbine

After discussing in the above section we now know that the turbine converts kinetic energy of fluid to mechanical energy.

In power plants, steam is used as the working fluid and in dams water is used as the working fluid. Working fluid here refers to the fluid which is responsible for rotation of shaft. The shaft rotates after working fluid strikes the surface of propeller. The rotating shaft is connected to generator which generates electricity.

What is adiabatic turbine?

Now we know the meanings of both adiabatic system and turbine. Let us see what is an adiabatic turbine.

An adiabatic turbine is a turbine whose walls are adiabatic. These walls don’t allow heat transfer through them. This way no amount of heat can escape the turbine. Hence, the net transfer from the turbine is zero. No heat is added to the turbine and no heat escapes the turbine when the turbine is adiabatic.

Adiabatic turbine working

We know what an adiabatic turbine is. We can see that there is no physical difference between a normal turbine and an adiabatic turbine, only difference between them is that adiabatic turbine does not allow heat transfer to take place.

Similarly, the working of an adiabatic turbine is also same as that of normal turbine. In almost all cases, the walls of the turbine are kept adiabatic. Hence the working of an adiabatic turbine is same as that of a normal turbine that we have discussed in above sections.

Adiabatic gas turbine

As we have studied about the turbines used dams, they use water as the working fluid that rotates the propeller shaft in turbines.

When the working fluid used is a gas then the turbine is called as gas turbine. Gas turbines are mostly used in aeroplane power plants and thermal power plants used for generating electricity. The materials used in both the turbines are different because the type of working fluid used is different.

Adiabatic steam turbine

Adiabatic steam turbine is a turbine in which steam is used as the working fluid. Steam as we all know is the gaseous form of water.

The steam contains high kinetic energy which is transferred to the propeller of turbine. The turbine rotor starts moving when the high energy steam strikes the surface of propeller. Pressure drop will take place inside the turbine, while entering the steam is at high pressure. This pressure drops and the steam becomes low pressure steam after passing through turbine. 

Adiabatic reversible turbine

The term reversible refers to a turbine in which all the processes are ideal. The losses de to friction or energy leaks are not present in reversible processes.

When we talk about adiabatic reversible turbine, it means the expansion process taking place inside the turbine is nearly ideal. Usually a multiple staged turbine is considered as a reversible turbine. When the walls are adiabatic, this turbine becomes adiabatic reversible turbine.

Adiabatic turbine equation

The equation used in adiabatic turbine is given below-

Work done by turbine is given by-

Wt= h2-h1

Where,

h2 is the enthalpy at point 2

h1 is the enthalpy at point 1

Adiabatic turbine efficiency

The efficiency is defined as the output gained from a system or device after pumping in some input.

The efficiency of adiabatic turbine is given as-

Efficiency= Output/Input = Wt/Qa

Where,

Wt is the work done by turbine

Qa is the amount of heat added in the system

Is a turbine reversible ?

We have already discussed in above section that a turbine is considered reversible when the expansion process in the turbine is ideal.

In reality, no device can be considered ideal, but a turbine can be made nearly ideal by increasing the number of stages of expansion process. This type of turbine is called as a multi staged turbine. The process of using multiple turbines is called as reheating.

Is a steam turbine adiabatic?

When the transfer of heat is restricted completely, a steam turbine can be said to be adiabatic.

The steam changes its phase to liquid after passing through the condenser. In a turbine only the pressure drop in steam takes place. The steam coming in with high pressure gets converted to a low energy steam at exit.

adiabatic turbine
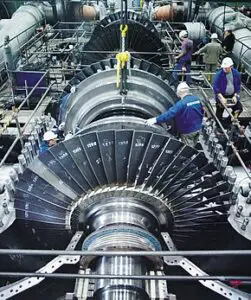
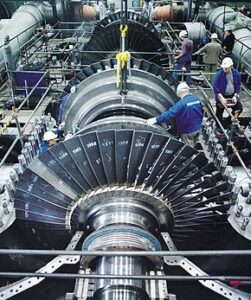
Image: Steam turbine with its case opened

Image credits: Siemens Pressebild, Dampfturbine Montage01CC BY-SA 3.0

Why are turbines adiabatic?

Turbines are adiabatic as the entire energy is taken to drive the turbine shaft.

No energy is lost in the form of heat or no energy enters the turbine in the form of heat. The only energy that participates in the energy transfer process is the kinetic energy of the fluid and kinetic energy of the turbine rotor.

Adiabatic turbine entropy

Before discussing about adiabatic turbine’s entropy, we shall know the meaning of entropy. Entropy’s widely accepted definition says that it is a measure of randomness in the system.

In actual turbines the entropy value increases. Whereas for reversible adiabatic processes the value of entropy generated is zero. This is because entropy is a state function and for a reversible process the end points are same and as the process is adiabatic, due to no heat transfer the change in entropy is zero.

Back Work Ratio: What, How, Formula, Several Cycles

260px Rankine cycle layout

Introduction to Back Work Ratio

The back work ratio is a crucial parameter in the field of thermodynamics, specifically in the study of gas and steam turbines. It provides valuable insights into the efficiency and performance of these machines. In this section, we will delve into the definition of the back work ratio and explore the formula used to calculate it.

Definition of Back Work Ratio

The back work ratio is a measure of the amount of work required to operate a turbine compared to the work it produces. It is expressed as a ratio and is an essential factor in determining the overall efficiency of a turbine.

In a gas or steam turbine, the back work ratio represents the portion of the work output that is used to drive the compressor or pump. This work is necessary to maintain the required pressure ratio and ensure the continuous operation of the turbine.

A high back work ratio indicates that a significant portion of the turbine’s power output is used to drive the compressor or pump, resulting in lower overall efficiency. Conversely, a low back work ratio signifies that a smaller proportion of the power output is consumed by these components, leading to higher efficiency.

Formula for Back Work Ratio

The back work ratio can be calculated using the following formula:

Back Work Ratio = (Work Input - Work Output) / Work Output

To understand this formula better, let’s break it down:

  • Work Input: This refers to the amount of work required to operate the turbine. It includes the work needed to drive the compressor or pump, as well as any other external work input.

  • Work Output: This represents the actual work produced by the turbine. It is the net power output available for useful work, such as generating electricity or driving machinery.

By subtracting the work output from the work input and dividing it by the work output, we obtain the back work ratio. This ratio provides a quantitative measure of the energy losses within the turbine system.

It is important to note that the back work ratio is influenced by various factors, including turbine efficiency, compressor efficiency, pressure ratio, and isentropic efficiency. These parameters play a significant role in determining the overall performance and effectiveness of the thermodynamic cycle.

In the next sections, we will explore each of these factors in more detail and understand their impact on the back work ratio.

Back Work Ratio in Gas Turbine Engines

The back work ratio is an important parameter that measures the efficiency of a gas turbine engine. It represents the amount of work required to drive the compressor compared to the work produced by the turbine. In other words, it quantifies the energy losses within the engine.

Reasons for Relatively High Back Work Ratio

There are several factors that contribute to a relatively high back work ratio in gas turbine engines. Understanding these reasons is crucial for optimizing the performance of these engines.

  1. Compressor Efficiency: The efficiency of the compressor plays a significant role in determining the back work ratio. A less efficient compressor requires more work to achieve the desired pressure ratio, resulting in a higher back work ratio.

  2. Pressure Ratio: The pressure ratio, which is the ratio of the compressor outlet pressure to the inlet pressure, also affects the back work ratio. Higher pressure ratios generally lead to higher back work ratios.

  3. Isentropic Efficiency: The isentropic efficiency of the compressor and turbine stages impacts the back work ratio. Lower isentropic efficiencies result in higher back work ratios, as more work is required to compensate for the energy losses.

Typical Back Work Ratio Values for Gas Turbine Engines

The back work ratio values for gas turbine engines can vary depending on various factors such as engine design, operating conditions, and specific applications. However, there are some typical ranges that can be observed.

  1. Aircraft Gas Turbines: In aircraft gas turbines, the back work ratio is usually in the range of 0.3 to 0.5. These engines are designed to prioritize power output and fuel efficiency, which leads to relatively lower back work ratios.

  2. Industrial Gas Turbines: Industrial gas turbines, used in power generation and other industrial applications, tend to have higher back work ratios. Typical values for these engines range from 0.5 to 0.8. The higher back work ratios are often a result of the need for higher power output and efficiency.

  3. Combined Cycle Power Plants: Gas turbines used in combined cycle power plants, where the exhaust gases are used to generate steam for a steam turbine, have lower back work ratios compared to standalone gas turbines. The back work ratio for these systems can range from 0.2 to 0.4.

It’s important to note that these values are general guidelines and can vary depending on specific engine configurations and operating conditions.

In conclusion, the back work ratio is a critical parameter in gas turbine engines that measures the efficiency of the engine. Understanding the reasons for a relatively high back work ratio and typical values for different types of gas turbines can help engineers and operators optimize the performance of these engines. By focusing on improving compressor efficiency, pressure ratio, and isentropic efficiency, it is possible to reduce the back work ratio and enhance the overall efficiency of gas turbine engines.

Back Work Ratio in Brayton Cycle

The back work ratio is an important parameter in the Brayton cycle, which is a thermodynamic cycle commonly used in gas turbine engines. It quantifies the amount of work required to drive the compressor compared to the work output of the turbine. In this section, we will explore the explanation of the Brayton cycle and the formula used to calculate the back work ratio.

Explanation of Brayton Cycle

The Brayton cycle is a thermodynamic cycle that describes the operation of a gas turbine engine. It consists of four main processes: compression, combustion, expansion, and exhaust. Let’s take a closer look at each of these processes:

  1. Compression: In this process, the air is drawn into the compressor and compressed to a higher pressure. The compressor plays a crucial role in increasing the pressure of the air before it enters the combustion chamber.

  2. Combustion: Once the air is compressed, it is mixed with fuel and ignited in the combustion chamber. The combustion process releases a large amount of heat, which increases the temperature and pressure of the working fluid.

  3. Expansion: The high-pressure, high-temperature gas from the combustion chamber is expanded in the turbine. As the gas expands, it loses energy, which is converted into mechanical work to drive the turbine and any attached load, such as an aircraft engine or a power generator.

  4. Exhaust: After the expansion process, the gas is exhausted from the turbine. It may still contain some energy, but it is typically at a lower pressure and temperature compared to the gas entering the turbine.

The Brayton cycle is often referred to as an ideal cycle, assuming certain ideal conditions such as no losses due to friction or heat transfer. However, in real-world applications, these losses are inevitable and can impact the overall efficiency of the cycle.

Back Work Ratio Formula in Brayton Cycle

The back work ratio (BWR) is defined as the ratio of the work required to drive the compressor to the work output of the turbine. It is an essential parameter in determining the overall efficiency of the gas turbine engine. The formula to calculate the back work ratio is as follows:

BWR = (Work Input to Compressor) / (Work Output of Turbine)

The work input to the compressor is the energy required to compress the air, while the work output of the turbine is the energy produced by the expansion of the high-pressure gas. By comparing these two values, we can determine the efficiency of the Brayton cycle.

A high back work ratio indicates that a significant portion of the turbine’s output work is used to drive the compressor, resulting in lower net power output. Conversely, a low back work ratio implies that the turbine is more efficient, as less work is required to drive the compressor.

It is important to note that the back work ratio is influenced by various factors, including the efficiency of the compressor and turbine, the pressure ratio across the compressor and turbine, and the isentropic efficiencies of these components. Optimizing these factors can help improve the overall efficiency of the Brayton cycle.

In conclusion, the back work ratio is a crucial parameter in the Brayton cycle, as it quantifies the efficiency of the gas turbine engine. By understanding the explanation of the Brayton cycle and the formula to calculate the back work ratio, engineers and designers can make informed decisions to optimize the performance of gas turbine systems.

Back Work Ratio in Rankine Cycle

Explanation of Rankine Cycle

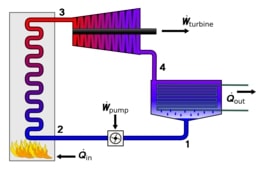
The Rankine Cycle is a thermodynamic cycle commonly used in power plants to generate electricity. It is a closed-loop cycle that utilizes both a heat source and a heat sink to convert heat energy into mechanical work. The cycle consists of four main components: a boiler, a turbine, a condenser, and a pump.

The process begins in the boiler, where heat is added to the working fluid, typically water, to convert it into high-pressure steam. This high-pressure steam then enters the turbine, where it expands and does work by driving the turbine blades. As the steam expands, its pressure and temperature decrease.

After leaving the turbine, the low-pressure steam enters the condenser, where it is cooled and condensed back into liquid form. This condensation process releases heat, which is transferred to a cooling medium, such as water from a nearby river or ocean. The condensed liquid is then pumped back to the boiler to repeat the cycle.

Back Work Ratio Formula in Rankine Cycle

The back work ratio (BWR) is a parameter used to evaluate the performance of a Rankine Cycle. It represents the ratio of the work required to operate the pump to the net work output of the turbine. Mathematically, it can be expressed as:

BWR = (Work input to pump) / (Net work output of turbine)

The work input to the pump is the energy required to increase the pressure of the working fluid from the condenser pressure to the boiler pressure. This work input is typically expressed in terms of kilojoules per kilogram (kJ/kg) of the working fluid.

On the other hand, the net work output of the turbine is the difference between the work done by the turbine and the work done by the pump. The work done by the turbine is the energy extracted from the steam as it expands in the turbine, while the work done by the pump is the energy required to increase the pressure of the working fluid.

The back work ratio is an important parameter because it indicates the efficiency of the Rankine Cycle. A lower back work ratio implies a more efficient cycle, as less work is required to operate the pump relative to the work output of the turbine. Conversely, a higher back work ratio indicates a less efficient cycle, as more work is needed to operate the pump.

In practice, engineers strive to minimize the back work ratio by optimizing the design and operation of the Rankine Cycle. This can be achieved by using efficient pumps and turbines, maximizing the temperature difference between the heat source and heat sink, and reducing losses due to friction and heat transfer.

By carefully considering the back work ratio, engineers can improve the overall efficiency and performance of power plants that utilize the Rankine Cycle. This, in turn, leads to reduced energy consumption and lower environmental impact.

Back Work Ratio in Otto Cycle

The back work ratio is an important parameter in the Otto cycle, which is a thermodynamic cycle commonly used in internal combustion engines. It helps us understand the efficiency of the cycle and the amount of work required to operate the engine. In this section, we will explain the Otto cycle and discuss the formula for calculating the back work ratio.

Explanation of Otto Cycle

The Otto cycle is a theoretical thermodynamic cycle that describes the operation of a typical gasoline engine. It consists of four processes: intake, compression, combustion, and exhaust. During the intake process, the fuel-air mixture is drawn into the cylinder. In the compression process, the mixture is compressed to increase its temperature and pressure. The combustion process involves the ignition of the compressed mixture, resulting in a rapid expansion of gases and the generation of power. Finally, in the exhaust process, the burned gases are expelled from the cylinder.

The Otto cycle is an idealized representation of the actual engine operation, assuming certain ideal conditions such as perfect combustion, no heat loss, and ideal gas behavior. Despite these simplifications, the Otto cycle provides a useful framework for analyzing engine performance.

Back Work Ratio Formula in Otto Cycle

The back work ratio (BWR) is defined as the ratio of the work required to operate the engine’s auxiliaries (such as the compressor and the pump) to the net work output of the engine. It is an indicator of the efficiency of the cycle and is typically expressed as a percentage.

The formula for calculating the back work ratio in the Otto cycle is:

BWR = (Work Input to Compressor + Work Input to Pump) / Work Output of Engine * 100

The work input to the compressor is the work required to compress the air-fuel mixture during the compression process. It is influenced by factors such as the compression ratio and the efficiency of the compressor. The work input to the pump is the work required to circulate the coolant or lubricant in the engine. It depends on the flow rate and the pressure difference across the pump.

The work output of the engine is the net work produced during the power stroke of the combustion process. It is influenced by factors such as the pressure ratio, the isentropic efficiency of the combustion process, and the mechanical efficiency of the engine.

By calculating the back work ratio, engineers can assess the efficiency of the engine’s auxiliaries and identify areas for improvement. A high back work ratio indicates that a significant portion of the engine’s power is consumed by the auxiliaries, reducing the overall efficiency of the system. On the other hand, a low back work ratio suggests that the auxiliaries are operating efficiently, allowing more power to be delivered to the output.

In conclusion, the back work ratio is an important parameter in the Otto cycle, providing insights into the efficiency of the engine’s auxiliaries. By understanding and optimizing the back work ratio, engineers can enhance the overall performance of internal combustion engines.

Significance of Back Work Ratio

The back work ratio is an important parameter in the field of thermodynamics, specifically in the study of gas turbines and steam turbines. It plays a crucial role in determining the overall efficiency and performance of these power generation systems. In this section, we will explore the importance of the back work ratio and how it is calculated.

Importance of Back Work Ratio

The back work ratio is a measure of the energy required to drive the compressor or the pump in a thermodynamic cycle. It represents the fraction of the work output that is used to overcome the losses in the turbine or the compressor. A low back work ratio indicates that a significant portion of the work output is consumed by these losses, resulting in reduced overall efficiency.

One of the key reasons why the back work ratio is significant is its direct impact on the efficiency of the turbine. The back work ratio affects both the turbine efficiency and the overall power output of the system. A higher back work ratio means that more energy is required to drive the compressor or the pump, resulting in a decrease in the net power output of the turbine.

Additionally, the back work ratio also influences the pressure ratio and the isentropic efficiency of the compressor or the pump. These parameters are crucial in determining the performance of the entire thermodynamic cycle. A higher back work ratio leads to an increase in the pressure ratio, which can have a positive effect on the overall efficiency of the system.

Furthermore, the back work ratio is closely related to the efficiency of the turbine. By minimizing the losses in the turbine or the compressor, the back work ratio can significantly improve the overall efficiency of the system. This is particularly important in power generation applications, where even a small increase in efficiency can result in substantial cost savings and environmental benefits.

Calculation of Back Work Ratio

The back work ratio can be calculated using the following formula:

Back Work Ratio = (Work Input - Work Output) / Work Output

To calculate the back work ratio, we need to determine the work input and the work output of the system. The work input represents the energy required to drive the compressor or the pump, while the work output represents the useful work produced by the turbine.

In a gas turbine, the work input is typically calculated by measuring the power input to the compressor, while the work output is determined by measuring the power output from the turbine. Similarly, in a steam turbine, the work input is calculated based on the enthalpy change of the steam, while the work output is determined by measuring the power output from the turbine.

Once we have the values for the work input and the work output, we can substitute them into the formula to calculate the back work ratio. The resulting value provides us with a quantitative measure of the energy losses in the turbine or the compressor.

In conclusion, the back work ratio is a significant parameter in the study of gas turbines and steam turbines. It directly influences the efficiency and performance of these power generation systems. By understanding the importance of the back work ratio and how to calculate it, engineers and researchers can optimize the design and operation of turbines to achieve higher efficiency and improved performance.
Conclusion

In conclusion, the back work ratio is a crucial metric that helps measure the efficiency of a heat engine or a refrigeration system. It indicates the amount of useful work output obtained from a system compared to the amount of work input required to operate it. A higher back work ratio signifies a more efficient system, as it indicates that a larger proportion of the input energy is converted into useful work. On the other hand, a lower back work ratio suggests that a significant portion of the input energy is lost as waste or used to operate auxiliary components. By optimizing the back work ratio, engineers and designers can improve the overall performance and energy efficiency of various systems, including power plants, engines, and refrigeration units. It is important to consider the back work ratio when evaluating and comparing different systems, as it provides valuable insights into their energy conversion capabilities. By understanding and optimizing the back work ratio, we can strive towards more sustainable and energy-efficient technologies that minimize waste and maximize the utilization of available resources.

Frequently Asked Questions

Q: Why are the back work ratio relatively high in gas turbine engines?

A: Gas turbine engines have relatively high back work ratios because a significant portion of the work produced by the turbine is used to drive the compressor, resulting in a higher energy requirement for the overall operation of the engine.

Q: What are typical back work ratio values for gas-turbine engines?

A: Typical back work ratio values for gas turbine engines can vary depending on the specific design and operating conditions. However, values between 0.3 and 0.5 are commonly observed in practice.

Q: What is back work ratio?

260px Rankine cycle layout

A: Back work ratio is a thermodynamic parameter that represents the ratio of work required to drive the compressor to the work produced by the turbine in a thermodynamic cycle. It is an indicator of the efficiency of the overall cycle.

Q: What is the back work ratio of this cycle?

A: The back work ratio of a specific cycle depends on the design and operating conditions of the system. It can be calculated by dividing the work required to drive the compressor by the work produced by the turbine.

Q: What is back work ratio in Brayton cycle?

A: In the Brayton cycle, the back work ratio represents the ratio of work required to drive the compressor to the work produced by the turbine. It is an important parameter that affects the overall efficiency of the cycle.

Q: What is back work ratio formula?

A: The formula to calculate the back work ratio is: Back Work Ratio = Work Required to Drive Compressor / Work Produced by Turbine.

Q: What is back work ratio of gas turbine?

A: The back work ratio of a gas turbine represents the ratio of work required to drive the compressor to the work produced by the turbine. It is an important parameter that affects the efficiency and performance of the gas turbine.

Q: What is back work ratio in thermodynamics?

A: In thermodynamics, back work ratio is a parameter that measures the efficiency of a thermodynamic cycle. It represents the ratio of work required to drive the compressor to the work produced by the turbine.

Q: What is turbine efficiency?

A: Turbine efficiency is a measure of how effectively a turbine converts the energy of a fluid (such as gas or steam) into mechanical work. It is typically expressed as a percentage and is influenced by factors such as design, operating conditions, and losses.

Q: What is compressor efficiency?

A: Compressor efficiency is a measure of how effectively a compressor increases the pressure of a fluid. It is typically expressed as a percentage and is influenced by factors such as design, operating conditions, and losses.

11 Examples of Turbulent Flow: Detailed Explanations

Los Angeles attack sub 2 275x300 1

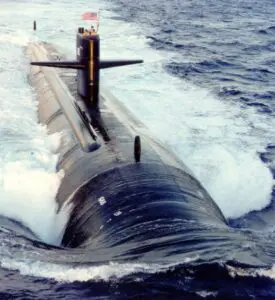
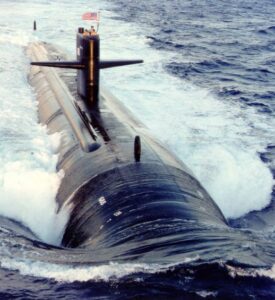
In our surroundings most of the flows of the viscous fluids are examples of turbulent flow. Examples of turbulent flow mainly flow via very small size ways and the flow will be slower than the regular.

12+ Examples of Turbulent Flow is listed below,

What is the meaning of turbulent flow?

Turbulent flow mainly occurs when excessive amount of kinetic energy is present in the flow of motion in the fluids. By the help of Reynolds number the flow of turbulent can be easily determined in the fluid.

Turbulent flow can be explain as, the fluid or in turbulent water  an unbalanced situation is appear in restlessness or compound of two or than two liquid substance. For the reason of the restlessness of the fluid the velocity, pressure and other physical parameters are not same at the each point of the fluid.

Los Angeles attack sub 2
Image – Turbulent flow;
Image Credit – Wikipedia

If the value of the Reynolds number is more than 3500 then the type of fluid known as turbulent flow.

In which factors the flow of the turbulent is dependent?

The factors the flow of the turbulent is dependent is listed below,

The factors are briefly discuss,

Velocity:

The flow of turbulent is depends on the physical property of velocity. The relationship with the flow of turbulent and velocity is proportional to each other. Means if the rate of velocity is increases then the value of flow of turbulent is also increases and if the rate of velocity is decreases then the value of flow of turbulent is also decreases.

Viscosity:

The flow of turbulent is depends on viscosity. The relationship with the flow of turbulent and viscosity is indirectly proportional to each other. Means if the rate of viscosity is increases then the value of flow of turbulent is decreases and if the rate of viscosity is decreases then the value of flow of turbulent is increases.

Pressure:

Another parameter where the flow of turbulent is depends that is pressure. The relationship with the flow of turbulent and pressure is directly proportional to each other. Means if the rate of pressure is increases then the value of flow of turbulent is also increases and if the rate of pressure is decreases then the value of flow of turbulent is also decrease in the same way.

12+ Examples of Turbulent Flow facts are broadly discuss in below,

Flow of the lava:

In the flow of the lava turbulent flow is appearing. If we observe the flowing condition of the lava then we easily can observe that when lava is came out from the inside of the earth to the surface of the earth that time the particles are not flow in a directional motion the layers of the lava is mixing with each other for this particular reason the physical parameters like velocity, pressure, viscosity is not remain same at each of the molecules of the fluid.                

examples of turbulent flow
Image – Flow of lava;
Image Credit – Wikimedia Commons

Flow of the blood in arteries:

In the flow of the blood in arteries the flow of turbulent is present. If we observe the flowing condition of the blood then we easily can observe that when blood is flow through the arteries the particles are not flow in a directional motion. The layers of the blood is mixing with each other for this particular reason the physical parameters like velocity, pressure, viscosity is not remain same at each of the molecules of the fluid and turbulent flow appear.

800px Coronary Artery Disease
Image – Flow of the blood in arteries; Image Credit – Wikimedia Commons

Transpiration of oil through the pipelines:

In the transpiration of oil through the pipelines flow of turbulent is present. If we observe the flowing condition of fluid then we easily can observe that when fluid is flow through the pipes the particles are not flow in a directional motion.

Flow in the wake of the boat:

In the flow in the wake of the boat the flow of turbulent is present. The flowing condition of fluid is directional motion and the physical parameters like velocity, pressure, viscosity is not remain same at each of the molecules of the fluid and turbulent flow appear.

Aircraft wing tips:

In aircraft wing tips the flow of turbulent is present. The physical parameters like velocity, pressure, viscosity is not remain same at each of the molecules of the fluid and turbulent flow appear.

Currents in the atmosphere:

In the currents of the atmospheric the presence of the turbulent flow can be observe.

Currents in the ocean:

In the currents of the oceans the flow of turbulent is present. The physical parameters like velocity, pressure, viscosity is not remain same at each of the molecules of the fluid and turbulent flow appear.

Smoke:

In the smoke of turbulent is present. When smoke is mix with the surrounding the physical parameters like velocity, pressure, viscosity is not remain same at each of the molecules of the fluid and turbulent flow appear.

800px Ognisko ubt 0126
Image – Smoke;
Image Credit – Wikimedia Commons

Car exhaust:

In the flow of the car exhaust flow of turbulent is present. When smoke is emitted from the vehicle smoke is mix with the surrounding the physical parameters like velocity, pressure, viscosity is not remain same at each of the molecules of the fluid and turbulent flow appear.

Rivers:

In river water the layers are mix with each other and turbulent flow is present.

Herault River Agde 09
Image – River;
Image Credit – Wikimedia Commons

Read more about Mass Flow Rate : Its Important relations and FAQs

Air flow through the air conditioning system:

In air flow of ac turbulent is present because the layers are not flow in one direction.

Windmill:

In windmill flow of turbulent is present. When windmill start the surrounding air mix up a turbulence is appear.

Read more about Wind Turbine Efficiency : Complete Insights and FAQs

Examples of turbulent flow
Image – Windmill;
Image Credit – Wikimedia Commons

Frequent Asked Question:-

Question: – Describe the relation between Reynolds number and flow of the fluid.

Solution: – Reynolds number is dimensionless physical factor. By the using Reynolds number easily can estimate the type of the flow of viscous fluid. The Reynolds number easily can understand us the flow is laminar or turbulent.

The relation between Reynolds number and flow of the fluid is given below,

gif
gif

Where,

Re = Reynolds number

ρ = Density for the viscous fluid

V = Characteristic velocity for the viscous fluid

L = Characteristic length for the viscous fluid

μ = Dynamic viscosity for the viscous fluid

v = Kinematic viscosity for the viscous fluid

The change of state middle of the dynamic viscosity and kinematic viscosity is given below,

v = μ/ρ

Reynolds number:-

Reynolds number can be deriving as the ratio between the inertia force and viscous force.

Mathematically Reynolds number can be written as,

Re =ρuL/μ

Where,

Re = Reynolds number

ρ = Density of the viscous fluid

u = Speed of flow of the viscous fluid

L = Characteristics linear dimension of the viscous fluid

μ = Dynamic viscosity of the viscous fluid

With the help of Reynolds number we can estimate several properties of the fluid such as viscosity, velocity, length, pressure and many others.

Read more about Reynolds number : It’s 10+ Important facts

Question: – Write the major difference between flow of laminar and flow of turbulent.

Solution: – The major difference between flow of laminar and flow of turbulent is discuss below,

ParametersLaminar flowTurbulent flow
Reynolds numberLess than 2000Greater than 4000
ViscosityLowHigh
Movement of the molecules in the liquid substanceRegular movement is presentIrregular movement is present
Mathematical analysisEasy to doComplication is appear
Motion DirectionLayers of the flow of the water is flow in one direction and no mixing of the liquid is occurAverage motion is present and that is not one directional and mixing of the liquid is occur
OccurSmall size diameter rodBigger size diameter rod
Shear stressShear stress of the flow of laminar is depending on the viscosity of the liquid substance and not depends on the liquid substance density.Shear stress of the flow of turbulent is depending on the density of the liquid substance.

11 Examples of Laminar Flow: Detailed Explanations

5b9bc62bf8fd409b53f9939d3688d0c798bb28d9 300x200 1

Examples of laminar flow mainly found in the cases where the flow of the channel is comparatively smaller than the regular flow. In this article examples of laminar flow and its related everything is prate.

The 11+ examples of laminar flow are listed below:-

What is the meaning of laminar flow?

In the laminar flow the physical quantities remains same for this particular reason the laminar flow also called as the flow of streamline. In the laminar flow pressure, velocity and many more physical quantities remains same.

Laminar flow explain as,  the viscous fluid when flow in a motion that time the molecules of the viscous fluid can move in parallel layers at a certain time period. In the flow of the laminar velocity and pressure and other parameter of physical stays same at the each of the particles of the parallel layers.

800px Closeup of Horseshoe Falls
Image – Laminar flow;
Image Credit – Wikipedia

When a viscous fluid flow is a motion through a closed system such as rod or pipe and middle of the flat plates that time flow of the laminar is appear. Laminar flow of a viscous fluid depends upon viscosity, velocity and the shape or size of the rod.

In which factors the flow of the laminar is dependent?

If we go through the law of Poiseuille then how the flow of the laminar is dependent on the physical factor easily can be understand.

The flow of laminar depends on some factors. The factors are,

Viscosity:

The flow of laminar depends on viscosity. The relationship with the flow of laminar and viscosity is indirectly proportional to each other. Means if the rate of viscosity is increases then the value of flow of laminar is decreases and if the rate of viscosity is decreases then the value of flow of laminar is increases.

Velocity:

The flow of laminar depends on velocity. The relationship with the flow of laminar and velocity is directly proportional. Means if the rate of velocity is increases then the value of flow of laminar is also increases and if the rate of velocity is decreases then the value of flow of laminar is also decreases.

Pressure:

The flow of laminar depends on pressure. The relationship with the flow of laminar and pressure is directly proportional to each other. Means if the rate of pressure is increases then the value of flow of laminar is also increases and if the rate of pressure is decreases then the value of flow of laminar is also decrease in the same way.

Size of the rod or pipe:

The flow of laminar depends on size of the rod or pipe. The relationship with the flow of laminar and size of the rod or pipe is indirectly proportional to each other. Means if the rate of size of the rod or pipe is increases then the value of flow of laminar is decreases and if the rate of size of the rod or pipe is decreases then the value of flow of laminar is increases.

The relation between Reynolds number and flow of the fluid:

Reynolds number is dimensionless physical factor. By the using Reynolds number easily can estimate the type of the flow of viscous fluid. The Reynolds number easily can understand us the flow is laminar or turbulent.

The relation between Reynolds number and flow of the fluid is given below,

gif
gif

Where,

Re = Reynolds number

ρ = Density for the viscous fluid

V = Characteristic velocity for the viscous fluid

L = Characteristic length for the viscous fluid

μ = Dynamic viscosity for the viscous fluid

v = Kinematic viscosity for the viscous fluid

The change of state middle of the dynamic viscosity and kinematic viscosity is given below,

v = μ/ρ

Reynolds number:-

Reynolds number can be deriving as the ratio between the inertia force and viscous force.

Mathematically Reynolds number can be written as,

Re = ρuL/μ

Where,

Re = Reynolds number

ρ = Density of the viscous fluid

u = Speed of flow of the viscous fluid

L = Characteristics linear dimension of the viscous fluid

μ = Dynamic viscosity of the viscous fluid

With the help of Reynolds number we can estimate several properties of the fluid such as viscosity, velocity, length, pressure and many others.

The 11+ examples of laminar flow derive briefly in below;

Aircrafts:

An aircraft is a machine or vehicle that can fly with the support of air. An aircraft can fly using the force of static lift, force of dynamic lift with the air foil. An aircraft is an example of laminar flow which we use in our practical daily life. By the help of aircraft anybody can reach to their desired place in a very short time.

Examples of laminar flow
Image – Aircraft;
Image Credit – Unsplash

Canals:

A canal is an example of laminar flow which we use in our practical daily life. Canal actually a waterway which made of artificially for transfer vehicles in the waterway or to build the management of the drainage system. Canal can carry free, in a smooth calm surface where water easily can flow under the pressure of atmospheric.

examples of laminar flow
Image – Canal;
Image Credit – Wikimedia Commons

River:

A river is an example of laminar flow which we use in our practical daily life. A river is actually a natural waterway that depth can be huge or shallow. In the river the water is falls towards the downstream due to the gravitational force. A smaller size river that also known as brook, stream or creek.

Wilkin River close to its confluence with Makarora River Otago New Zealand
Image – River;
Image Credit – Wikimedia Commons

Taps:

A tap is an example of laminar flow which we use in our practical daily life. When the water is comes through the tap the flow will straight there turbulence is not present. When the water is comes from taps that moment pressure and viscosity became same at each point of the water.

Read more about Pipe Elbow Dimensions : Exhaustive Problems Solution and Facts

Tea pouring from kettle:

Tea pouring from kettle is an example of laminar flow which we are used in our practical daily life. When tea is comes through the nozzle of the kettle the flow will straight and there turbulence is not present for this reason laminar flow is appearing. When the tea is comes from kettle that moment pressure and viscosity and other parameter of physical remain same at each point of the tea.

5b9bc62bf8fd409b53f9939d3688d0c798bb28d9
Image – Tea pouring from kettle; Image Credit – Snappygoat

Viscous fluid:

Every viscous fluid is an example of laminar flow which we use in our practical daily life. In every viscous fluid pressure, viscosity and other parameter of physical remain same at each point of the fluid for this reason laminar flow is appearing.

Read more about Volumetric flow rate : It’s All important Concept

Fountains:

A fountain is an example of laminar flow which we use in our practical daily life. A fountain is actually a reservoir which is used as decoration. In the decorative reservoir mainly water is discharge. In every fountain the pressure, viscosity and other parameter of physical remain same at each point of the water for this reason laminar flow is appearing.

Schlossplatzspringbrunnen Schlossplatz Stuttgart 2015 03
Image – Fountain;
Image Credit – Wikimedia Commons

Read more about Mass flow rate : Its Important relations and FAQs

Smoke:

A smoke is an example of laminar flow which we produce in our practical daily life. When smoke is comes there turbulence is not present for this reason laminar flow is appearing. In smoke pressure and viscosity and other parameter of physical remain same at each point.

Candle smoke structure 1
Image – Candle smoke;
Image Credit – Wikipedia Commons

Water balloon:

A water balloon is an example of laminar flow which we use in our practical daily life. When water is comes through the balloon the flow of the fluid will straight and there turbulence is not present for this reason laminar flow is appearing.

500px Balloon burst
Image – Water balloon;
Image Credit – Wikimedia Commons

Blood flow:

Blood flow an example of laminar flow which we use in our practical daily life. When blood is flow that time layer will be one directional.

Blood Anemia
Image – Blood flow;
Image Credit – Wikipedia Commons

Honey run from the container:

Honey run from the container an example of laminar flow and that time turbulence is absent and viscosity ans velocity stays same in each and every point of the honey.

Why Does Ionization Energy Increases Across A Period: Detailed Explanations

Ionization energy 300x111 1

This article answers the question why does ionization energy increase across a period? We will study basics of periodic table first.

Then carry our discussion to trends followed by ionisation energy of different elements in the periodic table. It is important to know the meaning of ionisation energy first, so we shall discuss about ionisation energy and then continue with our discussion.

What is ionisation energy?

If we want to remove an electron from an atom, it is logical to remove the most loosely packed electron of that atom.

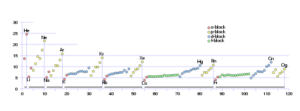
Ionisation energy is the name given to this energy that is required to remove the loosely packed electron. Without this energy, we won’t be able to remove the electron from the influence of nuclear force of attraction.

why does ionization energy increase across a period
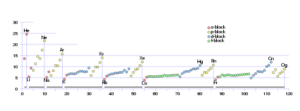
Image: Ionization Energies of different elements

Image credits: Double sharpFirst Ionization Energy blocksCC BY-SA 4.0

What is periodic table?

Periodic table is a table which represents different chemical elements found on Earth. These elements are given a specific atomic number and are then arranged in ascending order of atomic number.

Periodic table has many divisions in it. These divisions are called as blocks. With all the rows being called as period and all the columns being called as groups. We shall study about the trends of ionisation energy across both periods and groups.

What is atomic number?

Atomic number is considered as the fingerprint of the chemical element. It is simply the total number of protons present inside the atom.

Number of protons for every chemical element is unique hence it is considered as the fingerprint of that particular chemical element. The arrangement of chemical elements in the periodic table is done in increasing values of atomic numbers.

What is a period?

A period is simply a row in periodic table. Horizontal arrangement of chemical elements in periodic table is termed as period.

The atomic number increases by 1 as we move ahead in a period. The last element of any period is a noble gas. Noble gases have no free electron revolving around the nucleus. Noble gases are considered as the most stable elements in the periodic table.

What is a group?

As discussed above, rows of periodic table are called as period. Similarly, the columns are called as groups.

Here as we move down the group, the atomic number increases but not by 1. These groups divide metals from non metals and noble gases and alkali metals. Even the groups follow a trend for different properties. We shall discuss about them in later sections of this article.

Periodic trends

Different properties follow different trends as we move from left to right in a period. There are certain exceptions as well which don’t fit inside the trend.

We shall discuss about different trends in a period in the section given below-

  • Atomic radius– The atomic radius or the size of an atom generally decreases as we move across a period from left to right. This is due to the fact that the magnitude of nuclear charge is same but number of electrons keep increasing in the shell.
  • Ionsiation energy- Ionisation energy depends on the atomic radius. As the radius decreases acrosss a period, the ionisation energy keeps on increasing as we move across a period. It is maximum for nobel gases.
  • Electorn affinity– This property is exactly opposite to ionisation energy. Energy is released when an electron is stuffed into an atom meaning it is added to an atom. Electron affinity will increase while moving towards right in the periodic table.
  • Electronegativity – This property increases its value when we move towards right in the period. Metallicity- The metals are situated at the left hand side of the periodic table and non metals are situated at the right hand side of the periodic table. We can conclude that the metallicity value decreases when we move towards right in a period.

Group trends

A column of periodic table is called as group. The properties exhibited by these elements follow different trends along the group. We shall discuss about these trends in section given below-

  • Atomic radius- As we move down the group, an extra shell is added in the elements. We can say that due to addition of an extra shell, the atomic radius increases as we go down along the group.
  • Ionisation energy – The minimum value of energy required to pull out an electron from the influence of nucleus is called as ionisation energy. As the atomic radius increases as we move down the group, the influence of nucleus decreases on the electron and hence it becomes easier to remove electron. So we can conclude that the value of ionisation energy decreases as we go down along the group.
  • Electron affinity– Its meaning is right opposite to that of ionisation energy. Atom will release energy if an electron is plucked from it or stuffed into it. Similar to the trend of ionisation energy, electron affinity decreases while moving towards bottom in a group.
  • Electronegativity– While going towards the bottom of group, electronegativity keeps decreasing.
  • Metallicity- Metallicity can becompared to the tendency of an atom to lose electron. Metallicity increases while going towards the bottom of group in periodic table.

Why does ionization energy increase across a period?

Coming to the most important question in this article that is why does ionization energy increase across a period? The answer is already discussed n above sections, but we shall discuss it again.

Atomic radius is a deciding factor behind the energy required to remove the loosely packed electron. This is because smaller the radius, closer the electron will be to the nucleus. Hence greater will be the attractive force of nucleus towards electron. Hence ionisation energies of Hydrogen is low and keeps on increasing as we move towards right in the period. Only Oxygen has an exception because it forms electron pairs, due to repulsive forces, the electron is easily removed.

Why is second ionisation energy greater than first ionisation energy?

The name itself suggests that first ionisation energy is related to the first electron. It is the energy required to pluck out the first electron from the atom.

Similarly the second ionisation energy is used to remove second electron from the already electron deficit atom. The influence of nucleus on electron increases as and when we dig deeper into the atom. Hence it becomes difficult to remove that electron from the influence of nucleus thus justifying the fact that second ionisation energy is more than first ionisation energy.

23 Intensive Property Examples:Detailed Explanations

intensive 300x147 1

The properties of matters divided into two-part, either it is an intensive or extensive property. List of intensive property examples

The properties of the matters are divided into two parts broadly. We are going to explore on intensive property examples.

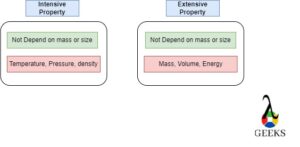
An Intensive property is one whose extent does not depend on the system’s mass or matter. In other words, we can say that the size of system does not play any role in the intensive properties.

It does not matter whatever amount of material is present in the system. An intensive property is the same even if the material is 1 kg or 1000 kg. The intensive properties in the material vary from point to point as per the situation.

Temperature

For example, if we measure temperature or pressure at one end of a pipe (300 K, 1 Bar). It is possible that the other end data may be different (325 K, 1.5 Bar).

Pressure

The temperature or pressure does not depend on how much quantity, but it depends on which point we are measuring.

An extensive property  is related with the size of the system and the mass of the system. It varies if we change the system’s size or mass.

There is a straightforward way to differentiate between intensive and extensive properties.

  • Step 1
  • Take a sample with appropriate mass and size.
  • Step 2
  • Now break the sample into two pieces. Two-piece of sample: A, B
  • Step 3
  • Now measure particular properties like temperature volume and observe
  • Step 4
  • If a property is the same for both pieces, It is an intensive property—for Intensive property examples, Pressure, Temperature, density, etc.

If a property is different for both pieces A and B, It is an extensive property. For example: Mass, Volume, etc.

The intensive property examples is the same for small samples and bulk systems. It is most helpful for the sampling process. The property of a small sample is the same as the property of a large system. It is useful in many fields of engineering and science.

Sometimes questions arise in our mind that density is the ratio of the mass and the volume. Still, the density is the intensive property. What is the reason behind it?

Intensive property examples
Intensive Property Examples

Density

In actuality, The mass and the volume both are extensive properties. The ratio of the two extensive properties turned into an intensive property examples. That’s why density is the intensive property examples. Now one question to ignite your mind, Why is density displayed on the fuel pumps? If you have answered the, write it in the comment section.

Specific Properties

One more hint: The specific properties are always intensive—the specific properties like specific volume, specific weight, specific heat capacity, specific internal energy, etc.

Color | Odor | Luster

The properties like odor, color, and luster are tested while examining samples. These properties are not related with the mass or size, so it’s intensive.

Intensive properties are bulk properties, which means they do not depend on the amount of matter present. Examples of intensive properties include:

Intensive property examples can help identify a sample because these characteristics do not depend on the amount of sample, nor do they change according to conditions.

Boiling Point| Melting Point

The temperature is the measured on individual point, so the boiling and melting point are also intensive. The boiling point is the measured value of temp. (on liquid start evaporating). The melting point is the measured value of temperature (on solid start melting). The pressure and temperature are related with the particular point.

Material Property

The properties of material like ductility, malleability, and hardness do not depend on the object’s size or mass. These are an intensive property examples of material science and metallurgy. In every engineering field and science, the intensive properties are studied at a significant or certain level.

Viscosity | Surface Tension

In fluid mechanics, Two widely known terms are surface tension and viscosity. These both are considered intensive properties. The dynamic viscosity is a fundamental property to measure samples of oil, fuel, and chemicals. It can vary with temperature, but it does not change with fluid mass. The surface tension is the phenomena of opposing the tensile force developed on the liquid surface. Because of surface tension, The bird can drink water.

Electrical Conductivity

The electrical conductivity is related on the No. of valences to pass electric current. The material’s thermal conductivity is more if the material can transfer more heat. It depends on the free electrons. No mass or size interaction comes into the picture.

One popular technique for one to remember the definition of the intensive property,

Intensive means “Independent on mass or size“. Recall the word “In”. It is straightforward to remember.

Opposite to intensive is the extensive property.

Low Limit Switch: What, How, Working, How To Test

AirCoilFreezeStat 253x260 1

In this article we will discuss different facts related to Low Limit Switch. As the name indicates Low Limit Switch is used for control applications.

Low Limit Switch is most widely used in the equipments where low temperature protection is a prior requirement. Low Limit Switch(also known as Freeze Stats)is designed with a vapour charged capillary sensing tube.


Mainly used in refrigerated cells and different equipments where operational temperature is maintained very low, minimum operational temperature is up to -40°C.

What is Low Limit Switch?

The Low Limit Switch plays the role of frost protection switch in water treatment and water supply plants, HVAC air conditioning( preferred in cold areas) etc.

Low Limit Switch is designed to monitor low temperature and to prevent damages that may occur due to frost accumulation. Generally suitable for hot water coil pipe unit, cold water pipe unit, heat exchanger, liquid carrying pipelines, surface air cooler etc.

Certain features of Low Limit Switch which make it more versatile for its wide range of application are easy to read dial, compact size, high reliability, quick response action etc.

low limit switch
Low Limit Switch; Image Credit: wikipedia

Low Limit Switch Working Principle

The working principle of Low Limit Switch is single- pole double-throw.

Low Limit Switch consists of a long copper capillary tube, full of vapour inside and acts as a sensing part. If any part of the capillary has senses a temperature lower than the setup point, inner switch will be off until temperature rises upto 2 or 2.5 °C than the set temperature. After that again the switch starts working.

To detect the low temperature and protective action the capillary tube is enclosed inside the pipeline. The long sensing tube contains vapour and the main body has an adjustable enclosure.

Generally freeze stats are made of 1/8”OD flexible tubing, filled with temperature sensitive gas vapour, the pressure of gas vapour goes down with decreasing temperature. The capillary tube is connected to a control box, where a temperature is set(35 F typically).

If any part of the temperature sensor element experiences a temperature drop lower than the predetermined or set point, the freeze stat will immediately trip. The sensor element has different lengths up to of 20 ft long and generally trip occur if the length within 12” to 18” goes lower than the set point.

330px MechanicalFreezeStat 400x300 1
Mechanical Free stat; Image Credit:wikipedia
DigitalFreezeStat320x240
Digital Free stat; Image credit: wikipedia

Low Limit Switch were designed for use on HVAC equipment which require low temperature cut out protection to prevent cooling coils from freezing. Low Limit Switch is connected between the heating and cooling coils on the supply side of the fan unit and gives an indication of lower temperature as per the senses received by the sensing element.

Low Limit Switch or Freeze Stats has both automatic and manual reset versions with a wide range of capillary lengths.

Applications of Low Limit Switch

Low Limit Switch protects cooling coils in air handler systems by preventing frost build up.

Low Limit Switch are most widely used in HVAC equipments, cooling coils and heat exchangers.

 The thermostat and capillary sensing element provide an antifreeze function by sensing the lowest temperature along any one foot section of capillary tube. Automatic reset relays signal the building management system and also cut off the fan. As the temperature goes below the fixed safety point(set point), the low limit Switch immediately detects it.

Low Voltage Limit Switch

Low Voltage Limit Switch is used to control loads such as blower fans and heating elements without an intervening relay.

Low Voltage Switch is connected in circuits where a low voltage has to be maintained for perfect running of the machine. In case of a magnetic relay circuit it is so connected that a drop in voltage cause the motor starter to disconnect the motor from the line.

5142986746 695d09bfe3 b
Voltage Sensing Relay; Image Credit: Flickr

Limit Switches are used in a wide range of application including the production floor as well as daily lives. Limit Switches are the mechanical/electronic components on a production floor for control and safety purposes. Although the function of a Limit Switch is very obvious, wide variety of these switches are available in the market to offer flexibility.

Low Temperature Limit Switch

Low Temperature Limit Switch is a special version of limit switches designing for low operational  temperature applications  such as refrigerated cells or equipments.

Temperature Limit Switch controls the electrical circuit which in turn regulates the machine and its moving parts as per the requirement. Special materials are used to manufacture Low Temperature Limit Switches and it can perform well at an operational temperature below down to -40°C.

Low Temperature Limit Switch acts as a pilot device in magnetic starter control circuits and allow it to regulate the start, stop, slow down or accelerate the functions of an electric motor.

Some of the manufacturer design certain Low Limit Switches that can be used in the most hazardous and arduous application of industries to withstand harshet conditions and duty cycles including extreme cold at -60 °C.

How to Test a Low Limit Switch?

With the help of a basic Ohmmeter or Digital Multi-meter we can know whether the Limit Switch is working or not.

To test a Limit Switch we have to follow the following steps:

  1. first disconnect the switch from the system and then place the Digital Muliti-meter leads to each terminal.
  2. The resistance should be very high for a normally open(NO)limit switch.
  3. If the Limit Switch is normally closed(NC), the resistance should be closed to zero.
  4. Now keeping the limit switch into active position, measure the resistance.
  5. It should be the opposite in this setting, if there is no transition, the limit switch is bad.

Installation of a Low Limit Switch

The steps followed for installation of a Low Limit Switch are as follows:

  • To install on a wall, make a hole with the help of a drilling machine as per the instructions in the manual and then lock the switch using self-tapping screw.
  • Set the temperature in such a manner that environmental temperature should not be less than the setting temperature. Environmental temperature shouldn’t be lower than setting temperature.  Keep away from cold and hot sources and avoid installing in outdoor.
  •  Never press the sensing capillary to avoid change in calibration result to maintain accuracy.
  • For ensure accurate and reliable action, should at least wrap over 200mm length sensing capillary onto pipeline of related protection devices.
  • In case of heat exchanger and surface air cooler, the sensing capillary of the limit switch should be installed at their leeward side.
  • Make sure that power should be OFF before staring wiring to avoid any kind of accident.

11 Radioactive Waste Examples: Detailed Explanations

Capture 1 300x188 1

In this article we will discuss about Radioactive Waste Examples which are quite hazardous.Radioactive waste are the by product from different activities  like nuclear research, nuclear power plants, defence sectors, earth mining, hospitals etc.

Examples of Radioactive waste are listed below:

Radioactive waste mainly contains radioactive materials due to which the disposable and storage of these waste is an important matter of concern.

Production of radioactive waste should be avoided as much as possible. If the production of radioactive waste is unavoidable, then try to minimise the production rate.

radioactive waste examples
Low level Radioactive Waste Disposal; Image credit: flickr

What is a Radioactive Waste?

Radioactive waste should be always managed with care and following the restrictions as per the Government rules throughout its life cycle starting from arising to recognised end point.

Once the radioactive waste has been generated, its influence does not end until it is decayed naturally. Packaging of radioactive waste in containers doesn’t reduce their radioactivity and radioactivity reduction by dilution is an expensive option.

Most of the industries produce radioactive waste in large amount and these wastes should be disposed safely to avoid the spread of contamination. 

1200px Low Level Waste Facility Graphic
Low Level Waste; Image Credit: wikipedia

Radioactive Waste Examples in Details

Radioactive waste is considered as a serious threat to mankind as well as nature because of its long duration for decantation.

Wastes from Defence Activities

Radioactive waste produced from defence activities are similar to wastes produced from nuclear power plants, but the amount of waste produced is much less if we compare it with total amount of waste production. The sources of production are activities like Navy operations, decommissioning of nuclear powered submarines, clean up of disused military sites etc.

Mill Tailings

They are the by product during the milling process of certain ores to get uranium or thorium. Mill Tailings  consist of thorium, radium and small residual amount of uranium. Mill tailings are not highly radioactive due to the less amount of radioactive materilas but possess long half lives.

Transuranic waste

These type of waste are contaminated with alpha-emitting transuranic  radionuclides and have a half lives more than 20 years, but they are not classified as HLW. More caution is required for its disposable  than LLW and ILW due to the longer half live. Transuranic waste, sometimes called TRU are obtained generally from the manufacturing process of nuclear weapons.

Electricity Generation

Use of nuclear reactors to generate electricity is a major source of radioactive waste, which can be classified as HLW. The reactor operation results highly reactive fission products, uranium and plutonium produce transuranic elements which mix with used fuel.

Nuclear fuel cycle

The whole cycle of nuclear fuel starting from radioactive fuel extraction, processing, uses and finally disposal generate radioactive wastes. If the disposal process is not proper enough then the rate of waste production is quite high.

Reprocessing of used fuel

Used fuel also possess radioactivity because they still contain some amount of U-235,different plutonium isotopes, U-238, the amount can be resemble with 96% of original uranium content and almost half of the original energy content. These used nuclear fuel has been reprocessed to extract fissile materials and also to reduce the volume of HLW.

Mining through to fuel fabrication

Fine sandy tailings are generated from the uranium mining operation and these tailings contain all the radioactive elements which are available in uranium ore.  Generally tailings are kept under water in dams and after few months covered with a layer of clay and rock to prevent the leakage of radon gas.

Decommissioning and dismantling of nuclear reactors

Decommissioning and dismantling of nuclear reactorsand other nuclear facilities are also responsible for radioactive waste generation.

Waste from Nuclear Conflicts

Nuclear conflicts among different countries is a source of radioactive wastes on a large scale. In this case, due to the use of nuclear arms a vast area may be contaminated by radioactive materials and the effect of contamination in the soil remains for a quite long period of time which is really hazardous for human being, animal and for the whole atmosphere.

Natural nuclear waste sources

Crude oil, natural gas, coal etc are nuclear materials available in our nature. These radioactive materials generate radioactive waste during the industrial processes to extract them for commercial purposes. Coal power plants, oil refineries and drilling plants, gas industries produce radioactive by products like radium, radon etc.

Waste from Medical purposes

Medical  is one of the main sources of radioactive wastes, medical research for medicines and different medication facilities generate huge amount of radioactive wastes. For example, during  the surgery of  thyroid cancer, lymphoma, bone cancer etc radioactive wastes are produced. 

Classification of Radioactive Waste

Radioactive wastes are classified depending on the amount of radioactivity present and the heat produced by this radioactivity.

Radioactive waste are classified as below:

  • High Level Waste (HLW): Majority of radioactivity is associated with HLW, temperature may rise significantly due to their radioactivity, the storage and disposal of these wastes should be well planned. When the production of electricity has been completed, a huge amount of HLW is remaining in the form of  spent fuel inside the reactors. These are highly radioactive and emits heat, HLW always require cooling and shielding for disposal.  
  • Low Level Waste(LLW):Generally produced from reactor operations, medical, academic, factories and other commercial activities where radioactive materials are used. LLW are contaminated with radioactive materials and sometimes become radioactive through exposure to neutron radiation. Some LLW are wiping rags, mops, tools, papers, filters, clothing, medical tubes, injection needles which have small amount of short lived radioactivity. LLW may be stored on site by licensees until has been decayed away or disposed as common trash.
  • Intermediate Level Waste(ILW):They contain higher amount of radioactivity and need some shielding, more radioactive than LLW. But heat generation is less than 2 KW/m3, so design or selection for storage and disposal is not considered much. Contaminated materials from reactor decommissioning, chemical sludge, resins, metal fuel cladding etc typically considered as ILW.
  • Very Low Level Waste(VLLW):Amount of radioactive materials present in VLLW is not considered as harmful to people or surrounding environment. Examples of VLLW are demolished materials like concrete, plaster, bricks, metal rods, pipes, valves etc obtained during dismantling works on nuclear industrial sites. Food Processing, chemical, steel industries also produce VLLW, as small amount of radioactivity present in certain minerals used in their manufacturing processes.

Effects of Radioactive Waste

Major effects of Nuclear Waste are as follows:

  • Though great care is maintained for the transportation of radioactive waste, sometimes leakage or accident may occur. The leakage of radioactive waste during transportation will lead to soil contamination and make it unusable for cultivation, the effect remains for a long period of time because many of them have a long half lives. 
  • Radioactive waste can cause serious diseases for human being as well as animals which may lead to even death. In a long term it can change the DNA structure and alter the future generations.
  • The area which is used for storage purpose is fully polluted and becomes useless for any other activities.
  • Radioactive waste has a significant adverse effect on nature.
  • A significant effect can be observed in nature including plants and animals which in turn influence the human life through the food chain.
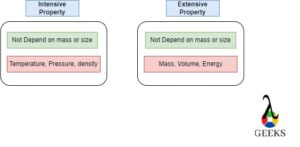
48584606132 86a36b45f6 b
Radio active Waste Barrels; Image Credit: flickr
5693475989 5222af3036
Nuclear Waste Storage System; Image Credit: Flickr

To know about Limit Switch Valve( Click here)